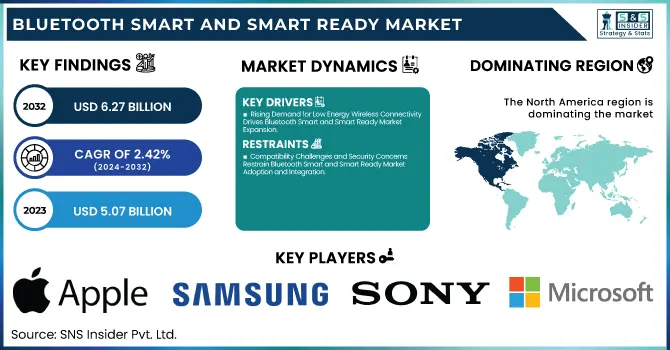
The Bluetooth Smart and Smart Ready Market was valued at USD 5.07 billion in 2023 and is expected to reach USD 6.27 billion by 2032, growing at a CAGR of 2.42% over the forecast period 2024-2032.
To Get more information on Bluetooth Smart and Smart Ready Market - Request Free Sample Report
The market is rapidly moving toward the adoption of technologies such as Bluetooth Smart and Smart Ready, owing to the increasing demand for low-power wide-area networks (LPWAN) used in consumer electronics, healthcare, and Internet of Things (IoT) devices. At least devices now provide better average battery life for targeted types (like wearables and smart home solutions). Upgrades of protocols such as Bluetooth 5.0, 5.2, etc.; are being widely adapted for enhanced data transfer along with power efficiency. Lower latency and longer-range capabilities only help to enable seamless connectivity across different use cases. The U.S. Bluetooth Smart and Smart Ready market grew rapidly on the back of the growth of smart home devices and wearables. In the smart home sector alone Bluetooth device shipments exceeded over 13% of all Bluetooth device shipments, which equals around 815 million Bluetooth-enabled products around the world. This trend was bolstered by the growth of wireless connectivity in consumer electronics and the wider Internet of Things (IoT) ecosystem.
The U.S. Bluetooth Smart and Smart Ready Market is estimated to be USD 1.36 Billion in 2023 and is projected to grow at a CAGR of 2.25%. Facilitated by increasing smartphone penetration, consumer demands seamless device connection, and the adoption of devices such as wireless audio devices and fitness trackers are expected to drive the growth of the U.S. Bluetooth Smart and Smart Ready market. Further accelerating the market is the promise of richer user experiences, better energy efficiency, and mainstream adoption into consumer and enterprise ecosystems.
Key Drivers:
Rising Demand for Low Energy Wireless Connectivity Drives Bluetooth Smart and Smart Ready Market Expansion
The increasing need for low-energy and efficient wireless interconnection propagation areas consists of the driver for the growth of the Bluetooth Smart and SMART READY market over the forecast period. The rise of IoT devices and the expansion of smartphone, tablet, and smart wearables usage greatly hastens the adoption of Bluetooth technologies. Bluetooth Smart Ready is already being employed in various automotive applications for infotainment, diagnostics, and hands-free communication aspects. Furthermore, as smart homes and industrial automation expand rapidly and more mobile, infield and modern automation systems proliferate that are increasingly dependent on reliable, interoperable wireless standards, market growth continues.
Restrain:
Compatibility Challenges and Security Concerns Restrain Bluetooth Smart and Smart Ready Market Adoption and Integration
Interoperability or fragmentation issues in Bluetooth versions and devices are one of the major restraints for the growth of Bluetooth smart and smart ready especially in the early periods of its implementation. The older tech like Bluetooth 5.0 shows remarkable upgrades yet, most legacy devices lack support for it, which leads to compatibility issues. This may restrict uninterrupted interconnectivity, especially in corporate and industrial settings where legacy and emerging frameworks work hand in hand. Moreover, privacy and data security are also issues, particularly in healthcare and wearable applications where very sensitive personal data is transmitted wirelessly. Although Bluetooth communication provides encryption protocols that can help protected devices with their communication, should Bluetooth not be updated regularly or implemented correctly, it could contain vulnerabilities.
Opportunity:
Bluetooth Advances Unlock Growth in Healthcare Smart Retail Industry 4.0 and Cross-Platform Innovation Potential
Bluetooth 5.0 and above has the potential to grow through emerging sectors like remote healthcare monitoring, smart retail solutions, and asset tracking. With its improved range, velocity, and broadcasting skills, it is a perfect suit for technology wearables and medical gadgets. Additionally, growing spending toward integrated smart infrastructure, along with the growing emergence of Industry 4.0, is likely to create significant demand for industrial measurement and diagnostics tools equipped with Bluetooth capabilities. With Bluetooth Low Energy (BLE) creating waves in the industry, there is plenty of room for manufacturers to truly innovate and provide unique value by focusing on cross-platform capabilities, security, AI, and edge computing.
Challenges:
Bluetooth Faces Performance and Efficiency Challenges in Complex Environments Requiring High Precision and Low Latency
The key obstacle is delivering consistent performance in assorted environments. Many different factors such as physical barriers, interference from other wireless technologies (like Wi-Fi or Zigbee), and different ranges may affect the reliability of Bluetooth connections. However, in high precision, low latency applications like those in industrial diagnostics or healthcare monitoring this variability impedes adoption. Other Limitations While power efficiency remains a key consideration in supporting high data rates and longer-range transmission while maintaining compactness, this still poses a technical challenge to developers. Bluetooth has come a long way and will continue with constant R&D and standardization, yet we still have challenges ahead that need to be overcome for Bluetooth to continue its growth in the market.
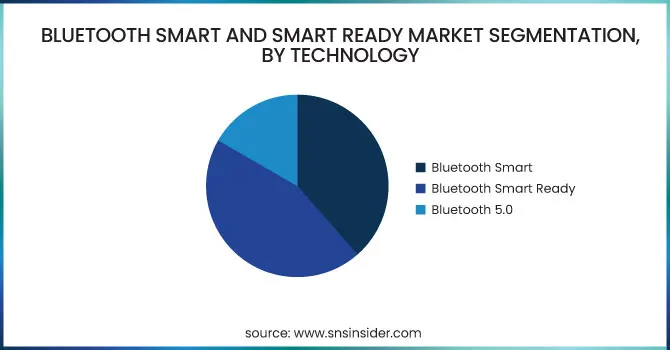
By Technology
Bluetooth Smart Ready accounted for the largest share of the global market in 2023, at 44.7%, owing to backward compatibility with traditional Bluetooth and BLE devices. The widespread adoption of automotive infotainment systems, consumer electronics, and smart home applications was instrumental in cementing its dominant market position. This functionality of the technology to promote different kinds of devices made it the ideal solution for manufacturers who had their eyes set on future flexibility and expanding backward compatibility.
Between 2024 and 2032, Bluetooth 5.0 is anticipated to register the highest CAGR, owing to its better capabilities, including wide range, high-speed data transfer, and enhanced broadcasting capacity. This enables applications that ultimately feature wearable electronics, healthcare monitoring, and industrial IoT. Bluetooth 5.0 is primed to usher in the next developmental phase of innovation and connectivity across industries driven by increasing demand for high-performance low-power wireless solutions.
By Application
The automotive segment accounted for 21. 3% of the Bluetooth Smart and Smart Ready market in 2023. The primary reason behind this monopoly was the growing demand for Bluetooth-enabled hands-free calling, audio streaming, vehicle diagnostics, and advanced infotainment systems inside of vehicles. Bluetooth Smart Ready technology (Bluetooth classic or low energy) has emerged as one of the key enablers for these transformations since automakers continue to enhance in-vehicle connectivity.
The fastest CAGR from 2024 to 2032 is expected to be recorded for wearable electronics during this period due to rising consumer demand for smartwatches, fitness trackers, and health monitoring devices. Low energy consumption, higher data rates, and longer range make Bluetooth 5.0 the ideal candidate for wearable applications that must maintain constant communication without draining thousands of milliamperes. The health and fitness tech trend is expanding, coupled with more new sensor technologies into miniaturized sensors. Bluetooth-enabled wearables are indispensable for the next stage of market growth.
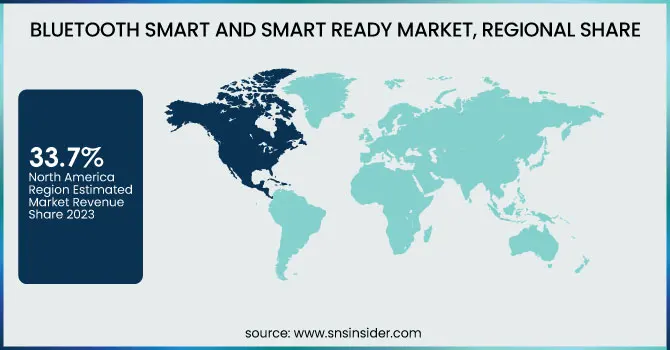
The largest share of the Bluetooth Smart and Smart Ready was held by North America in 2023, capturing 33.7% of the global revenue. This dominance is largely due to the early adoption of advanced wireless technologies in the region along with high demand from end-use industries, such as automotive, healthcare, and consumer electronics. Market growth is also driven by the penetration of market leaders such as Apple, Tesla, and General Motors who actively implement Bluetooth solutions in their products. Bluetooth connectivity is used everywhere, for example, Apple AirPods AirTags, and many other accessories depend on Bluetooth, and Tesla cars use Bluetooth for keyless entry, infotainment, and smartphone integration. Also used Bluetooth-enabled medical devices that are used in the healthcare industry across the U.S. are gaining popularity amongst people for patient monitoring and diagnostics.
The fastest CAGR from 2025 to 2032 is anticipated to be seen in the Asia Pacific, due to the rapid development of urbanization as well as the electronic manufacturing industry together with the increasing use of smartphones. China, Japan, South Korea, and India have seen a rising demand for Bluetooth-enabled wearables, smart home technologies, and industrial IoT applications. For instance, startup companies in the subcontinent are working on diagnostic equipment linked to a smartphone via Bluetooth, while Xiaomi and Samsung are pouring money and talent into Bluetooth-driven wearables. With a large Indian manufacturing base supported by a rapidly growing digital infrastructure, the region can be considered a key growth engine for the market.
Get Customized Report as per Your Business Requirement - Enquiry Now
Apple Inc. (Apple Watch),
Samsung Electronics Co., Ltd. (Galaxy Buds),
Sony Corporation (Sony WH-1000XM5),
Microsoft Corporation (Surface Pen),
Intel Corporation (Intel Wireless-AC 9560),
Qualcomm Technologies, Inc. (Snapdragon Bluetooth SoC),
Nordic Semiconductor (nRF52840 SoC),
Texas Instruments Incorporated (CC2640R2F Bluetooth MCU),
Broadcom Inc. (BCM4343W Bluetooth Combo Chip),
STMicroelectronics (BlueNRG-M2 module),
Fitbit Inc. (Fitbit Charge 5),
Garmin Ltd. (Garmin Forerunner 255),
Huawei Technologies Co., Ltd. (Huawei Band 7),
Xiaomi Corporation (Mi Smart Band 8),
LG Electronics Inc. (LG Tone Free Earbuds)
In January 2024, Sony India launched the Float Run WI-OE610, no-pressure wireless sports headphones designed for runners with an off-ear design for comfort and safety.
| Report Attributes | Details |
|---|---|
| Market Size in 2023 | USD 5.07 Billion |
| Market Size by 2032 | USD 6.27 Billion |
| CAGR | CAGR of 2.42% From 2024 to 2032 |
| Base Year | 2023 |
| Forecast Period | 2024-2032 |
| Historical Data | 2020-2022 |
| Report Scope & Coverage | Market Size, Segments Analysis, Competitive Landscape, Regional Analysis, DROC & SWOT Analysis, Forecast Outlook |
| Key Segments | • By Technology (Bluetooth Smart, Bluetooth Smart Ready, Bluetooth 5.0) • By Application (Automotive, Building & Retail, Wearable Electronics, Healthcare, Accessories, Industrial Measurement and Diagnostics) |
| Regional Analysis/Coverage | North America (US, Canada, Mexico), Europe (Eastern Europe [Poland, Romania, Hungary, Turkey, Rest of Eastern Europe] Western Europe] Germany, France, UK, Italy, Spain, Netherlands, Switzerland, Austria, Rest of Western Europe]), Asia Pacific (China, India, Japan, South Korea, Vietnam, Singapore, Australia, Rest of Asia Pacific), Middle East & Africa (Middle East [UAE, Egypt, Saudi Arabia, Qatar, Rest of Middle East], Africa [Nigeria, South Africa, Rest of Africa], Latin America (Brazil, Argentina, Colombia, Rest of Latin America) |
| Company Profiles | Apple Inc., Samsung Electronics Co., Ltd., Sony Corporation, Microsoft Corporation, Intel Corporation, Qualcomm Technologies, Inc., Nordic Semiconductor, Texas Instruments Incorporated, Broadcom Inc., STMicroelectronics, Fitbit Inc., Garmin Ltd., Huawei Technologies Co., Ltd., Xiaomi Corporation, LG Electronics Inc. |
Ans: The Bluetooth Smart and Smart Ready Market is expected to grow at a CAGR of 21.28% during 2024-2032.
Ans: Bluetooth Smart and Smart Ready Market size was USD 5.07 Billion in 2023 and is expected to Reach USD 6.27 Billion by 2032.
Ans: The major growth factor of the Bluetooth Smart and Smart Ready market is the rising demand for low-power, wireless connectivity across wearables, automotive, and IoT devices.
Ans: The Bluetooth Smart Ready segment dominated the Bluetooth Smart and Smart Ready market in 2023.
Ans: North America dominated the Bluetooth Smart and Smart Ready Market in 2023.
Table of Content
1. Introduction
1.1 Market Definition
1.2 Scope (Inclusion and Exclusions)
1.3 Research Assumptions
2. Executive Summary
2.1 Market Overview
2.2 Regional Synopsis
2.3 Competitive Summary
3. Research Methodology
3.1 Top-Down Approach
3.2 Bottom-up Approach
3.3. Data Validation
3.4 Primary Interviews
4. Market Dynamics Impact Analysis
4.1 Market Driving Factors Analysis
4.1.1 Drivers
4.1.2 Restraints
4.1.3 Opportunities
4.1.4 Challenges
4.2 PESTLE Analysis
4.3 Porter’s Five Forces Model
5. Statistical Insights and Trends Reporting
5.1 Technology Adoption Trends
5.2 Average Battery Life by Use Case
5.3 Protocol Upgrade Penetration Rate
5.4 Latency & Range Performance
6. Competitive Landscape
6.1 List of Major Companies, By Region
6.2 Market Share Analysis, By Region
6.3 Product Benchmarking
6.3.1 Product specifications and features
6.3.2 Pricing
6.4 Strategic Initiatives
6.4.1 Marketing and promotional activities
6.4.2 Distribution and Supply Chain Strategies
6.4.3 Expansion plans and new product launches
6.4.4 Strategic partnerships and collaborations
6.5 Technological Advancements
6.6 Market Positioning and Branding
7. Bluetooth Smart and Smart Ready Market Segmentation, By Technology
7.1 Chapter Overview
7.2 Bluetooth Smart
7.2.1 Bluetooth Smart Market Trends Analysis (2020-2032)
7.2.2 Bluetooth Smart Market Size Estimates and Forecasts to 2032 (USD BILLION)
7.3 Bluetooth Smart Ready
7.3.1 Bluetooth Smart Ready Market Trends Analysis (2020-2032)
7.3.2 Bluetooth Smart Ready Market Size Estimates and Forecasts to 2032 (USD BILLION)
7.4 Bluetooth 5.0
7.4.1 Bluetooth 5.0 Market Trends Analysis (2020-2032)
7.4.2 Bluetooth 5.0 Market Size Estimates and Forecasts to 2032 (USD BILLION)
8. Bluetooth Smart and Smart Ready Market Segmentation, By Application
8.1 Chapter Overview
8.2 Automotive
8.2.1 Automotive Market Trends Analysis (2020-2032)
8.2.2 Automotive Market Size Estimates and Forecasts to 2032 (USD BILLION)
8.3 Building & Retail
8.3.1 Building & Retail Market Trends Analysis (2020-2032)
8.3.2 Building & Retail Market Size Estimates and Forecasts to 2032 (USD BILLION)
8.4 Wearable Electronics
8.4.1 Wearable Electronics Market Trends Analysis (2020-2032)
8.4.2 Wearable Electronics Market Size Estimates and Forecasts to 2032 (USD BILLION)
8.5 Healthcare
8.5.1 Healthcare Market Trends Analysis (2020-2032)
8.5.2 Healthcare Market Size Estimates and Forecasts to 2032 (USD BILLION)
8.6 Accessories
8.6.1 Accessories Market Trends Analysis (2020-2032)
8.6.2 Accessories Market Size Estimates and Forecasts to 2032 (USD BILLION)
8.7 Industrial Measurement and Diagnostics
8.7.1 Industrial Measurement and Diagnostics Market Trends Analysis (2020-2032)
8.7.2 Industrial Measurement and Diagnostics Market Size Estimates and Forecasts to 2032 (USD BILLION)
9. Regional Analysis
9.1 Chapter Overview
9.2 North America
9.2.1 Trends Analysis
9.2.2 North America Bluetooth Smart and Smart Ready Market Estimates and Forecasts, by Country (2020-2032) (USD BILLION)
9.2.3 North America Bluetooth Smart and Smart Ready Market Estimates and Forecasts, By Technology (2020-2032) (USD BILLION)
9.2.4 North America Bluetooth Smart and Smart Ready Market Estimates and Forecasts, By Application (2020-2032) (USD BILLION)
9.2.5 USA
9.2.5.1 USA Bluetooth Smart and Smart Ready Market Estimates and Forecasts, By Technology (2020-2032) (USD BILLION)
9.2.5.2 USA Bluetooth Smart and Smart Ready Market Estimates and Forecasts, By Application (2020-2032) (USD BILLION)
9.2.6 Canada
9.2.6.1 Canada Bluetooth Smart and Smart Ready Market Estimates and Forecasts, By Technology (2020-2032) (USD BILLION)
9.2.6.2 Canada Bluetooth Smart and Smart Ready Market Estimates and Forecasts, By Application (2020-2032) (USD BILLION)
9.2.7 Mexico
9.2.7.1 Mexico Bluetooth Smart and Smart Ready Market Estimates and Forecasts, By Technology (2020-2032) (USD BILLION)
9.2.7.2 Mexico Bluetooth Smart and Smart Ready Market Estimates and Forecasts, By Application (2020-2032) (USD BILLION)
9.3 Europe
9.3.1 Eastern Europe
9.3.1.1 Trends Analysis
9.3.1.2 Eastern Europe Bluetooth Smart and Smart Ready Market Estimates and Forecasts, by Country (2020-2032) (USD BILLION)
9.3.1.3 Eastern Europe Bluetooth Smart and Smart Ready Market Estimates and Forecasts, By Technology (2020-2032) (USD BILLION)
9.3.1.4 Eastern Europe Bluetooth Smart and Smart Ready Market Estimates and Forecasts, By Application (2020-2032) (USD BILLION)
9.3.1.5 Poland
9.3.1.5.1 Poland Bluetooth Smart and Smart Ready Market Estimates and Forecasts, By Technology (2020-2032) (USD BILLION)
9.3.1.5.2 Poland Bluetooth Smart and Smart Ready Market Estimates and Forecasts, By Application (2020-2032) (USD BILLION)
9.3.1.6 Romania
9.3.1.6.1 Romania Bluetooth Smart and Smart Ready Market Estimates and Forecasts, By Technology (2020-2032) (USD BILLION)
9.3.1.6.2 Romania Bluetooth Smart and Smart Ready Market Estimates and Forecasts, By Application (2020-2032) (USD BILLION)
9.3.1.7 Hungary
9.3.1.7.1 Hungary Bluetooth Smart and Smart Ready Market Estimates and Forecasts, By Technology (2020-2032) (USD BILLION)
9.3.1.7.2 Hungary Bluetooth Smart and Smart Ready Market Estimates and Forecasts, By Application (2020-2032) (USD BILLION)
9.3.1.8 turkey
9.3.1.8.1 Turkey Bluetooth Smart and Smart Ready Market Estimates and Forecasts, By Technology (2020-2032) (USD BILLION)
9.3.1.8.2 Turkey Bluetooth Smart and Smart Ready Market Estimates and Forecasts, By Application (2020-2032) (USD BILLION)
9.3.1.9 Rest of Eastern Europe
9.3.1.9.1 Rest of Eastern Europe Bluetooth Smart and Smart Ready Market Estimates and Forecasts, By Technology (2020-2032) (USD BILLION)
9.3.1.9.2 Rest of Eastern Europe Bluetooth Smart and Smart Ready Market Estimates and Forecasts, By Application (2020-2032) (USD BILLION)
9.3.2 Western Europe
9.3.2.1 Trends Analysis
9.3.2.2 Western Europe Bluetooth Smart and Smart Ready Market Estimates and Forecasts, by Country (2020-2032) (USD BILLION)
9.3.2.3 Western Europe Bluetooth Smart and Smart Ready Market Estimates and Forecasts, By Technology (2020-2032) (USD BILLION)
9.3.2.4 Western Europe Bluetooth Smart and Smart Ready Market Estimates and Forecasts, By Application (2020-2032) (USD BILLION)
9.3.2.5 Germany
9.3.2.5.1 Germany Bluetooth Smart and Smart Ready Market Estimates and Forecasts, By Technology (2020-2032) (USD BILLION)
9.3.2.5.2 Germany Bluetooth Smart and Smart Ready Market Estimates and Forecasts, By Application (2020-2032) (USD BILLION)
9.3.2.6 France
9.3.2.6.1 France Bluetooth Smart and Smart Ready Market Estimates and Forecasts, By Technology (2020-2032) (USD BILLION)
9.3.2.6.2 France Bluetooth Smart and Smart Ready Market Estimates and Forecasts, By Application (2020-2032) (USD BILLION)
9.3.2.7 UK
9.3.2.7.1 UK Bluetooth Smart and Smart Ready Market Estimates and Forecasts, By Technology (2020-2032) (USD BILLION)
9.3.2.7.2 UK Bluetooth Smart and Smart Ready Market Estimates and Forecasts, By Application (2020-2032) (USD BILLION)
9.3.2.8 Italy
9.3.2.8.1 Italy Bluetooth Smart and Smart Ready Market Estimates and Forecasts, By Technology (2020-2032) (USD BILLION)
9.3.2.8.2 Italy Bluetooth Smart and Smart Ready Market Estimates and Forecasts, By Application (2020-2032) (USD BILLION)
9.3.2.9 Spain
9.3.2.9.1 Spain Bluetooth Smart and Smart Ready Market Estimates and Forecasts, By Technology (2020-2032) (USD BILLION)
9.3.2.9.2 Spain Bluetooth Smart and Smart Ready Market Estimates and Forecasts, By Application (2020-2032) (USD BILLION)
9.3.2.10 Netherlands
9.3.2.10.1 Netherlands Bluetooth Smart and Smart Ready Market Estimates and Forecasts, By Technology (2020-2032) (USD BILLION)
9.3.2.10.2 Netherlands Bluetooth Smart and Smart Ready Market Estimates and Forecasts, By Application (2020-2032) (USD BILLION)
9.3.2.11 Switzerland
9.3.2.11.1 Switzerland Bluetooth Smart and Smart Ready Market Estimates and Forecasts, By Technology (2020-2032) (USD BILLION)
9.3.2.11.2 Switzerland Bluetooth Smart and Smart Ready Market Estimates and Forecasts, By Application (2020-2032) (USD BILLION)
9.3.2.12 Austria
9.3.2.12.1 Austria Bluetooth Smart and Smart Ready Market Estimates and Forecasts, By Technology (2020-2032) (USD BILLION)
9.3.2.12.2 Austria Bluetooth Smart and Smart Ready Market Estimates and Forecasts, By Application (2020-2032) (USD BILLION)
9.3.2.13 Rest of Western Europe
9.3.2.13.1 Rest of Western Europe Bluetooth Smart and Smart Ready Market Estimates and Forecasts, By Technology (2020-2032) (USD BILLION)
9.3.2.13.2 Rest of Western Europe Bluetooth Smart and Smart Ready Market Estimates and Forecasts, By Application (2020-2032) (USD BILLION)
9.4 Asia Pacific
9.4.1 Trends Analysis
9.4.2 Asia Pacific Bluetooth Smart and Smart Ready Market Estimates and Forecasts, by Country (2020-2032) (USD BILLION)
9.4.3 Asia Pacific Bluetooth Smart and Smart Ready Market Estimates and Forecasts, By Technology (2020-2032) (USD BILLION)
9.4.4 Asia Pacific Bluetooth Smart and Smart Ready Market Estimates and Forecasts, By Application (2020-2032) (USD BILLION)
9.4.5 China
9.4.5.1 China Bluetooth Smart and Smart Ready Market Estimates and Forecasts, By Technology (2020-2032) (USD BILLION)
9.4.5.2 China Bluetooth Smart and Smart Ready Market Estimates and Forecasts, By Application (2020-2032) (USD BILLION)
9.4.6 India
9.4.5.1 India Bluetooth Smart and Smart Ready Market Estimates and Forecasts, By Technology (2020-2032) (USD BILLION)
9.4.5.2 India Bluetooth Smart and Smart Ready Market Estimates and Forecasts, By Application (2020-2032) (USD BILLION)
9.4.5 Japan
9.4.5.1 Japan Bluetooth Smart and Smart Ready Market Estimates and Forecasts, By Technology (2020-2032) (USD BILLION)
9.4.5.2 Japan Bluetooth Smart and Smart Ready Market Estimates and Forecasts, By Application (2020-2032) (USD BILLION)
9.4.6 South Korea
9.4.6.1 South Korea Bluetooth Smart and Smart Ready Market Estimates and Forecasts, By Technology (2020-2032) (USD BILLION)
9.4.6.2 South Korea Bluetooth Smart and Smart Ready Market Estimates and Forecasts, By Application (2020-2032) (USD BILLION)
9.4.7 Vietnam
9.4.7.1 Vietnam Bluetooth Smart and Smart Ready Market Estimates and Forecasts, By Technology (2020-2032) (USD BILLION)
9.2.7.2 Vietnam Bluetooth Smart and Smart Ready Market Estimates and Forecasts, By Application (2020-2032) (USD BILLION)
9.4.8 Singapore
9.4.8.1 Singapore Bluetooth Smart and Smart Ready Market Estimates and Forecasts, By Technology (2020-2032) (USD BILLION)
9.4.8.2 Singapore Bluetooth Smart and Smart Ready Market Estimates and Forecasts, By Application (2020-2032) (USD BILLION)
9.4.9 Australia
9.4.9.1 Australia Bluetooth Smart and Smart Ready Market Estimates and Forecasts, By Technology (2020-2032) (USD BILLION)
9.4.9.2 Australia Bluetooth Smart and Smart Ready Market Estimates and Forecasts, By Application (2020-2032) (USD BILLION)
9.4.10 Rest of Asia Pacific
9.4.10.1 Rest of Asia Pacific Bluetooth Smart and Smart Ready Market Estimates and Forecasts, By Technology (2020-2032) (USD BILLION)
9.4.10.2 Rest of Asia Pacific Bluetooth Smart and Smart Ready Market Estimates and Forecasts, By Application (2020-2032) (USD BILLION)
9.5 Middle East and Africa
9.5.1 Middle East
9.5.1.1 Trends Analysis
9.5.1.2 Middle East Bluetooth Smart and Smart Ready Market Estimates and Forecasts, by Country (2020-2032) (USD BILLION)
9.5.1.3 Middle East Bluetooth Smart and Smart Ready Market Estimates and Forecasts, By Technology (2020-2032) (USD BILLION)
9.5.1.4 Middle East Bluetooth Smart and Smart Ready Market Estimates and Forecasts, By Application (2020-2032) (USD BILLION)
9.5.1.5 UAE
9.5.1.5.1 UAE Bluetooth Smart and Smart Ready Market Estimates and Forecasts, By Technology (2020-2032) (USD BILLION)
9.5.1.5.2 UAE Bluetooth Smart and Smart Ready Market Estimates and Forecasts, By Application (2020-2032) (USD BILLION)
9.5.1.6 Egypt
9.5.1.6.1 Egypt Bluetooth Smart and Smart Ready Market Estimates and Forecasts, By Technology (2020-2032) (USD BILLION)
9.5.1.6.2 Egypt Bluetooth Smart and Smart Ready Market Estimates and Forecasts, By Application (2020-2032) (USD BILLION)
9.5.1.7 Saudi Arabia
9.5.1.7.1 Saudi Arabia Bluetooth Smart and Smart Ready Market Estimates and Forecasts, By Technology (2020-2032) (USD BILLION)
9.5.1.7.2 Saudi Arabia Bluetooth Smart and Smart Ready Market Estimates and Forecasts, By Application (2020-2032) (USD BILLION)
9.5.1.8 Qatar
9.5.1.8.1 Qatar Bluetooth Smart and Smart Ready Market Estimates and Forecasts, By Technology (2020-2032) (USD BILLION)
9.5.1.8.2 Qatar Bluetooth Smart and Smart Ready Market Estimates and Forecasts, By Application (2020-2032) (USD BILLION)
9.5.1.9 Rest of Middle East
9.5.1.9.1 Rest of Middle East Bluetooth Smart and Smart Ready Market Estimates and Forecasts, By Technology (2020-2032) (USD BILLION)
9.5.1.9.2 Rest of Middle East Bluetooth Smart and Smart Ready Market Estimates and Forecasts, By Application (2020-2032) (USD BILLION)
9.5.2 Africa
9.5.2.1 Trends Analysis
9.5.2.2 Africa Bluetooth Smart and Smart Ready Market Estimates and Forecasts, by Country (2020-2032) (USD BILLION)
9.5.2.3 Africa Bluetooth Smart and Smart Ready Market Estimates and Forecasts, By Technology (2020-2032) (USD BILLION)
9.5.2.4 Africa Bluetooth Smart and Smart Ready Market Estimates and Forecasts, By Application (2020-2032) (USD BILLION)
9.5.2.5 South Africa
9.5.2.5.1 South Africa Bluetooth Smart and Smart Ready Market Estimates and Forecasts, By Technology (2020-2032) (USD BILLION)
9.5.2.5.2 South Africa Bluetooth Smart and Smart Ready Market Estimates and Forecasts, By Application (2020-2032) (USD BILLION)
9.5.2.6 Nigeria
9.5.2.6.1 Nigeria Bluetooth Smart and Smart Ready Market Estimates and Forecasts, By Technology (2020-2032) (USD BILLION)
9.5.2.6.2 Nigeria Bluetooth Smart and Smart Ready Market Estimates and Forecasts, By Application (2020-2032) (USD BILLION)
9.5.2.7 Rest of Africa
9.5.2.7.1 Rest of Africa Bluetooth Smart and Smart Ready Market Estimates and Forecasts, By Technology (2020-2032) (USD BILLION)
9.5.2.7.2 Rest of Africa Bluetooth Smart and Smart Ready Market Estimates and Forecasts, By Application (2020-2032) (USD BILLION)
9.6 Latin America
9.6.1 Trends Analysis
9.6.2 Latin America Bluetooth Smart and Smart Ready Market Estimates and Forecasts, by Country (2020-2032) (USD BILLION)
9.6.3 Latin America Bluetooth Smart and Smart Ready Market Estimates and Forecasts, By Technology (2020-2032) (USD BILLION)
9.6.4 Latin America Bluetooth Smart and Smart Ready Market Estimates and Forecasts, By Application (2020-2032) (USD BILLION)
9.6.5 Brazil
9.6.5.1 Brazil Bluetooth Smart and Smart Ready Market Estimates and Forecasts, By Technology (2020-2032) (USD BILLION)
9.6.5.2 Brazil Bluetooth Smart and Smart Ready Market Estimates and Forecasts, By Application (2020-2032) (USD BILLION)
9.6.6 Argentina
9.6.6.1 Argentina Bluetooth Smart and Smart Ready Market Estimates and Forecasts, By Technology (2020-2032) (USD BILLION)
9.6.6.2 Argentina Bluetooth Smart and Smart Ready Market Estimates and Forecasts, By Application (2020-2032) (USD BILLION)
9.6.7 Colombia
9.6.7.1 Colombia Bluetooth Smart and Smart Ready Market Estimates and Forecasts, By Technology (2020-2032) (USD BILLION)
9.6.7.2 Colombia Bluetooth Smart and Smart Ready Market Estimates and Forecasts, By Application (2020-2032) (USD BILLION)
9.6.8 Rest of Latin America
9.6.8.1 Rest of Latin America Bluetooth Smart and Smart Ready Market Estimates and Forecasts, By Technology (2020-2032) (USD BILLION)
9.6.8.2 Rest of Latin America Bluetooth Smart and Smart Ready Market Estimates and Forecasts, By Application (2020-2032) (USD BILLION)
10. Company Profiles
10.1 Apple Inc.
10.1.1 Company Overview
10.1.2 Financial
10.1.3 Products/ Services Offered
110.1.4 SWOT Analysis
10.2 Samsung Electronics Co., Ltd
10.2.1 Company Overview
10.2.2 Financial
10.2.3 Products/ Services Offered
10.2.4 SWOT Analysis
10.3 Sony Corporation
10.3.1 Company Overview
10.3.2 Financial
10.3.3 Products/ Services Offered
10.3.4 SWOT Analysis
10.4 Microsoft Corporation
10.4.1 Company Overview
10.4.2 Financial
10.4.3 Products/ Services Offered
10.4.4 SWOT Analysis
10.5 Intel Corporation
10.5.1 Company Overview
10.5.2 Financial
10.5.3 Products/ Services Offered
10.5.4 SWOT Analysis
10.6 Qualcomm Technologies, Inc.
10.6.1 Company Overview
10.6.2 Financial
10.6.3 Products/ Services Offered
10.6.4 SWOT Analysis
10.7 Nordic Semiconductor
10.7.1 Company Overview
10.7.2 Financial
10.7.3 Products/ Services Offered
10.7.4 SWOT Analysis
10.8 Texas Instruments Incorporated
10.8.1 Company Overview
10.8.2 Financial
10.8.3 Products/ Services Offered
10.8.4 SWOT Analysis
10.9 Broadcom Inc.
10.9.1 Company Overview
10.9.2 Financial
10.9.3 Products/ Services Offered
10.9.4 SWOT Analysis
10.10 STMicroelectronics
10.9.1 Company Overview
10.9.2 Financial
10.9.3 Products/ Services Offered
10.9.4 SWOT Analysis
11. Use Cases and Best Practices
12. Conclusion
An accurate research report requires proper strategizing as well as implementation. There are multiple factors involved in the completion of good and accurate research report and selecting the best methodology to compete the research is the toughest part. Since the research reports we provide play a crucial role in any company’s decision-making process, therefore we at SNS Insider always believe that we should choose the best method which gives us results closer to reality. This allows us to reach at a stage wherein we can provide our clients best and accurate investment to output ratio.
Each report that we prepare takes a timeframe of 350-400 business hours for production. Starting from the selection of titles through a couple of in-depth brain storming session to the final QC process before uploading our titles on our website we dedicate around 350 working hours. The titles are selected based on their current market cap and the foreseen CAGR and growth.
The 5 steps process:
Step 1: Secondary Research:
Secondary Research or Desk Research is as the name suggests is a research process wherein, we collect data through the readily available information. In this process we use various paid and unpaid databases which our team has access to and gather data through the same. This includes examining of listed companies’ annual reports, Journals, SEC filling etc. Apart from this our team has access to various associations across the globe across different industries. Lastly, we have exchange relationships with various university as well as individual libraries.

Step 2: Primary Research
When we talk about primary research, it is a type of study in which the researchers collect relevant data samples directly, rather than relying on previously collected data. This type of research is focused on gaining content specific facts that can be sued to solve specific problems. Since the collected data is fresh and first hand therefore it makes the study more accurate and genuine.
We at SNS Insider have divided Primary Research into 2 parts.
Part 1 wherein we interview the KOLs of major players as well as the upcoming ones across various geographic regions. This allows us to have their view over the market scenario and acts as an important tool to come closer to the accurate market numbers. As many as 45 paid and unpaid primary interviews are taken from both the demand and supply side of the industry to make sure we land at an accurate judgement and analysis of the market.
This step involves the triangulation of data wherein our team analyses the interview transcripts, online survey responses and observation of on filed participants. The below mentioned chart should give a better understanding of the part 1 of the primary interview.

Part 2: In this part of primary research the data collected via secondary research and the part 1 of the primary research is validated with the interviews from individual consultants and subject matter experts.
Consultants are those set of people who have at least 12 years of experience and expertise within the industry whereas Subject Matter Experts are those with at least 15 years of experience behind their back within the same space. The data with the help of two main processes i.e., FGDs (Focused Group Discussions) and IDs (Individual Discussions). This gives us a 3rd party nonbiased primary view of the market scenario making it a more dependable one while collation of the data pointers.
Step 3: Data Bank Validation
Once all the information is collected via primary and secondary sources, we run that information for data validation. At our intelligence centre our research heads track a lot of information related to the market which includes the quarterly reports, the daily stock prices, and other relevant information. Our data bank server gets updated every fortnight and that is how the information which we collected using our primary and secondary information is revalidated in real time.

Step 4: QA/QC Process
After all the data collection and validation our team does a final level of quality check and quality assurance to get rid of any unwanted or undesired mistakes. This might include but not limited to getting rid of the any typos, duplication of numbers or missing of any important information. The people involved in this process include technical content writers, research heads and graphics people. Once this process is completed the title gets uploader on our platform for our clients to read it.
Step 5: Final QC/QA Process:
This is the last process and comes when the client has ordered the study. In this process a final QA/QC is done before the study is emailed to the client. Since we believe in giving our clients a good experience of our research studies, therefore, to make sure that we do not lack at our end in any way humanly possible we do a final round of quality check and then dispatch the study to the client.
Key Segments:
By Technology
Bluetooth Smart
Bluetooth Smart Ready
Bluetooth 5.0
By Application
Automotive
Building & Retail
Wearable Electronics
Healthcare
Accessories
Industrial Measurement and Diagnostics
Request for Segment Customization as per your Business Requirement: Segment Customization Request
Regional Coverage:
North America
US
Canada
Mexico
Europe
Eastern Europe
Poland
Romania
Hungary
Turkey
Rest of Eastern Europe
Western Europe
Germany
France
UK
Italy
Spain
Netherlands
Switzerland
Austria
Rest of Western Europe
Asia Pacific
China
India
Japan
South Korea
Vietnam
Singapore
Australia
Rest of Asia Pacific
Middle East & Africa
Middle East
UAE
Egypt
Saudi Arabia
Qatar
Rest of Middle East
Africa
Nigeria
South Africa
Rest of Africa
Latin America
Brazil
Argentina
Colombia
Rest of Latin America
Request for Country Level Research Report: Country Level Customization Request
Available Customization
With the given market data, SNS Insider offers customization as per the company’s specific needs. The following customization options are available for the report:
Detailed Volume Analysis
Criss-Cross segment analysis (e.g. Product X Application)
Competitive Product Benchmarking
Geographic Analysis
Additional countries in any of the regions
Customized Data Representation
Detailed analysis and profiling of additional market players
The Perimeter Security Market was valued at USD 72.78 billion in 2023 and is expected to reach USD 152.40 billion by 2032, growing at a CAGR of 8.61% over the forecast period 2024-2032.
The Alcohol Sensor Market size was valued at USD 1.78 billion in 2023 and is expected to grow to USD 5.42 billion by 2032, expanding at a robust CAGR of 12.74% over the forecast period of 2024-2032.
The Digital Scent Technology Market size was valued at USD 1.09 Billion in 2023 and expected to grow at a CAGR of 9.93% to reach USD 2.56 Billion by 2032.
The Laser Technology Market Size was valued at USD 18.76 Billion in 2023 and is expected to reach USD 37.26 Billion by 2032 and grow at a CAGR of 7.96% over the forecast period 2024-2032.
The 3D NAND Flash Memory Market size was USD 17.59 Billion in 2023 & is expected to Reach USD 75.44 Billion by 2032 & grow at a CAGR of 17.61% by 2024-2032.
The POS Terminals Market Size was valued at USD 107.4 billion in 2023 and is expected to reach USD 212.9 billion by 2032 and grow at a CAGR of 7.90% over the forecast period 2024-2032.

Hi! Click one of our member below to chat on Phone
© 2025 All Rights Reserved by SNS Insider Pvt Ltd


