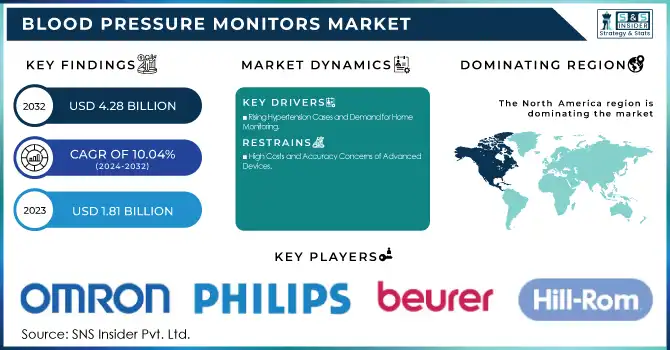
The Blood Pressure Monitors Market size was valued at USD 1.81 Billion in 2023 and is estimated to grow to USD 4.28 Billion by 2032 with a growing CAGR of 10.04% over the forecast period of 2024-2032.
This report points out the increasing prevalence and incidence of hypertension, driving demand for convenient and accurate monitoring devices. The research analyzes prescription and usage patterns of blood pressure monitors by region, indicating differences in healthcare infrastructure and consumer attitudes. It also delves into sales volume trends, examining regional demand and supply patterns and the effects of digital health and AI-based innovations that improve device precision, connectivity, and remote monitoring. The report also evaluates the increasing use of smart BP monitors, the effect of e-commerce on product availability, and the trend toward preventive healthcare solutions.
Get More Information on Blood Pressure Monitors Market - Request Sample Report
Drivers
Rising Hypertension Cases and Demand for Home Monitoring
Hypertension has emerged as a global health problem, with more than 1.28 billion adults affected, as indicated by the World Health Organization. Yet, only 42% of them are diagnosed and under treatment, as reported by WHO, showing that there is a large gap in hypertension care. The increasing burden drove the need for self-monitoring blood pressure instruments, especially digital and wearable BP monitors, which allow the population to monitor blood pressure with ease at home. Patients increasingly prefer home healthcare options, which provide affordable, user-friendly, and dependable options for repeated visits to clinics.
The growth of artificial intelligence and the Internet of Things in the healthcare sector has also spurred the use of advanced BP monitors. Intelligent BP devices now provide instant monitoring, cloud storage, and compatibility with mobile health apps, enabling easy sharing of readings with medical professionals. This not only enhances the management of disease but also aids in the early detection of anomalies, minimizing the likelihood of complications like stroke and heart failure. Industry leaders like Omron Healthcare and Withings are driving innovation here, with cuffless and wearable BP monitors and AI-powered analytics. As people become more aware of preventive healthcare, the need for intelligent, connected, and AI-based BP monitors will rise, transforming the landscape of managing hypertension.
Restraints
High Costs and Accuracy Concerns of Advanced Devices
The affordability of high-end BP monitors, especially wearable and AI-based ones, is a primary deterrent, cutting down access to lower-income households. Secondly, the accuracy and reliability of BP monitors based on wrists and smartwatches have raised concerns among healthcare workers, prompting skepticism regarding misdiagnosis. Variation in readings with motion artifacts or incorrect cuff fitting has also triggered skepticism regarding product effectiveness. Regulatory clearance for new BP monitoring technology can be protracted, and market entry may be delayed.
Opportunities
The rise of wearable blood pressure monitors and AI-driven diagnostics presents a significant growth opportunity.
Players such as Omron Healthcare and Withings have launched cuffless BP monitoring solutions, which attract technology-driven consumers. The convergence of remote patient monitoring (RPM) with telemedicine platforms is opening doors for chronic disease management. Further, government programs for preventive healthcare and digital health solutions will continue to fuel innovation and adoption in the space.
Challenges
Stringent regulatory approvals and compliance requirements for medical devices pose a challenge for market players.
Organizations such as the FDA and CE have stringent regulations to guarantee device accuracy and safety, resulting in longer approval times. Furthermore, the use of cloud-based and AI-powered BP monitors poses data security and patient privacy concerns. The threat of cyber-attacks and unauthorized access to health information is a persistent challenge that necessitates strong cybersecurity practices from device manufacturers.
By Product
In 2023, the devices segment held 75% of the overall market share and was the leading category in the blood pressure monitors market. This is largely due to the high usage of digital and automated BP monitors in clinical and homecare applications. The rising incidence of hypertension, increasing awareness of self-monitoring, and the inclusion of AI and smart connectivity features have also driven demand. Apart from this, hospitals and clinics also heavily depend on upper arm and wrist monitors for accurate and reliable readings, further boosting the segment's high market share.
The accessories segment will see considerable growth over the years, with driving forces being enhanced demand for spares such as replacement cuffs, batteries, and calibration tools. Increasing focus on maintenance of the device, accuracy, and increasing product life has seen sales rise in accessories. Also, there is increased usage of home care healthcare and telemedicine services driving up the requirement for spare parts and consumables. Increased demand for multi-user BP monitors by home and clinic consumers has also contributed to higher demand for accessories.
By End-user
The home healthcare segment controlled 60% of the market in 2023 and is the largest end-user category. The trend is fueled by increasing cases of hypertension, combined with a growing trend toward self-monitoring and preventive care. Ease of use of digital BP monitors, advancements in telehealth services, and better affordability have further boosted adoption. Also, the growth in more people living at home with chronic conditions has further helped the segment dominate the market.
The other segment, encompassing ambulatory surgical centers, pharmacies, and corporate wellness programs, is anticipated to see the highest growth. The increase in workplace wellness programs, mobile health screenings, and retail healthcare services has fueled demand in this segment. In addition, more pharmacies providing BP monitoring services and the growth of telemedicine-based hypertension management have helped the segment grow at a high rate. The ease of having on-the-spot BP readings taken in non-traditional healthcare environments is a major driver behind the growth of this segment.
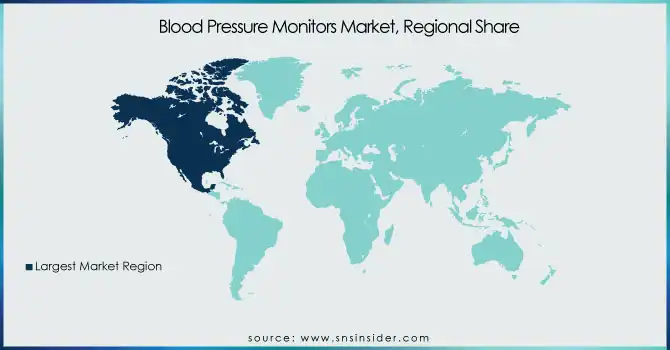
The North American region led the world in the blood pressure monitors market in 2023 due to the prevalence of high hypertension, sophisticated healthcare infrastructure, and rising use of home healthcare equipment. The United States has the highest market share, aided by government policies, reimbursement schemes, and the surge in demand for remote patient monitoring solutions. Furthermore, the concentration of major players like Omron Healthcare and GE Healthcare also bolsters market expansion in the region.
Europe is the second-largest market, with the UK, Germany, and France taking the lead owing to increased awareness regarding preventive healthcare and the well-established medical device market. Increasingly aging populations and high diagnosis rates for cardiovascular diseases are major growth drivers. Government-sponsored healthcare programs and positive regulatory policies also drive the adoption of BP monitors in clinics and homes.
The Asia-Pacific area is projected to experience the fastest growth due to the growing rate of hypertension, rising healthcare expenditures, and broadening availability of medical devices. China, Japan, and India are the contributing countries owing to their size and rising self-monitoring awareness. Wearable and smart blood pressure monitors are becoming increasingly in demand in this area, driven by digital health advancements.
Need any customization research on Blood Pressure Monitors Market - Enquiry Now
Key Players and Their Blood Pressure Monitor Products
Omron Healthcare – Evolv, Platinum, Gold, Silver, 7 Series, 10 Series, 3 Series
Hill-Rom Holdings, Inc. (Welch Allyn, Inc.) – Connex ProBP 3400, Spot Vital Signs 4400, Home BP Monitor
Nihon Kohden Corporation – Life Scope G5, Life Scope SVM Series
Koninklijke Philips N.V. (Philips Healthcare) – IntelliVue MP Series, SureSigns VS Series
Masimo – Rad-97, MightySat Rx with BP Monitoring
Beurer GmbH – BM 26, BM 28, BM 55, BM 85
GE Healthcare – Dinamap ProCare Series, Carescape V100
American Diagnostic Corporation – Diagnostix 700 Series, Prosphyg 775
SunTech Medical, Inc. – Tango M2, CT40, Oscar 2
A&D Medical Inc. – UA-651, UA-767, UA-1030T
Withings – BPM Connect, BPM Core
Briggs Healthcare – HealthSmart Standard, HealthSmart Premium
Kaz Inc. – SmartTemp BP Monitors
Microlife AG – BP A6 BT, BP B3 AFIB, BP W3 Comfort
Rossmax International Ltd. – X5, X9, S150
GF Health Products Inc. – Lumiscope 1143, 1145, 1147
Spacelabs Healthcare Inc. – OnTrak Ambulatory BP Monitor
B. Braun SE – Vista 120, Vista BP Monitoring Systems
Recent Developments
In Jan 2025, Novosound showcased the world's first ultrasound-based continuous blood pressure monitoring wearable at CES 2025, marking a breakthrough in the BP monitoring market. CEO Dave Hughes emphasized that ultrasound technology is the key to achieving real-time, non-invasive BP tracking, addressing a critical need in healthcare.
In Nov 2024, OMRON Healthcare received FDA De Novo authorization for its new AI-powered blood pressure monitors with IntelliSense AFib detection, marking a breakthrough in home monitoring by integrating machine learning for atrial fibrillation detection, a major stroke risk factor.
| Report Attributes | Details |
| Market Size in 2023 | USD 1.81 Billion |
| Market Size by 2032 | USD 4.28 Billion |
| CAGR | CAGR of 10.04% From 2024 to 2032 |
| Base Year | 2023 |
| Forecast Period | 2024-2032 |
| Historical Data | 2020-2022 |
| Report Scope & Coverage | Market Size, Segments Analysis, Competitive Landscape, Regional Analysis, DROC & SWOT Analysis, Forecast Outlook |
| Key Segments | • By Product [Devices (Sphygmomanometer, Digital BP Monitors, Ambulatory BP Monitors), Accessories (Blood Pressure Cuffs, Transducers, Others)] • By End-user [Hospitals & Clinics, Home Healthcare, Others] |
| Regional Analysis/Coverage | North America (US, Canada, Mexico), Europe (Eastern Europe [Poland, Romania, Hungary, Turkey, Rest of Eastern Europe] Western Europe] Germany, France, UK, Italy, Spain, Netherlands, Switzerland, Austria, Rest of Western Europe]), Asia Pacific (China, India, Japan, South Korea, Vietnam, Singapore, Australia, Rest of Asia Pacific), Middle East & Africa (Middle East [UAE, Egypt, Saudi Arabia, Qatar, Rest of Middle East], Africa [Nigeria, South Africa, Rest of Africa], Latin America (Brazil, Argentina, Colombia, Rest of Latin America) |
| Company Profiles | Omron Healthcare, Hill-Rom Holdings (Welch Allyn), Nihon Kohden Corporation, Koninklijke Philips N.V. (Philips Healthcare), Masimo, Beurer GmbH, GE Healthcare, American Diagnostic Corporation, SunTech Medical, A&D Medical, Withings, Briggs Healthcare, Kaz Inc., Microlife AG, Rossmax International, GF Health Products, Spacelabs Healthcare, B. Braun SE. |
Ans. The Compound Annual Growth rate for Blood Pressure Monitors Market over the forecast period is 10.04%.
Ans. The Blood Pressure Monitors Market was valued at USD 1.81 Billion in 2023 and is estimated to reach USD 4.28 Billion by 2032 with a growing CAGR of 10.04% over the forecast period of 2024-2032.
Ans. The major key players are Omron Healthcare, Hill-Rom Holdings, Koninklijke Philips, Beurer GmbH, GE Healthcare, American Diagnostic Corporation, SunTech Medical
Ans. Asia Pacific is the fastest growing region of the Blood Pressure Monitors Market.
Ans. The key drivers are rise in the people suffering from hypertension.
1. Introduction
1.1 Market Definition
1.2 Scope (Inclusion and Exclusions)
1.3 Research Assumptions
2. Executive Summary
2.1 Market Overview
2.2 Regional Synopsis
2.3 Competitive Summary
3. Research Methodology
3.1 Top-Down Approach
3.2 Bottom-up Approach
3.3. Data Validation
3.4 Primary Interviews
4. Market Dynamics Impact Analysis
4.1 Market Driving Factors Analysis
4.1.2 Drivers
4.1.2 Restraints
4.1.3 Opportunities
4.1.4 Challenges
4.2 PESTLE Analysis
4.3 Porter’s Five Forces Model
5. Statistical Insights and Trends Reporting
5.1 Incidence and Prevalence of Hypertension (2023)
5.2 Prescription and Usage Trends of Blood Pressure Monitors (2023), by Region
5.3 Blood Pressure Monitor Sales Volume, by Region (2020-2032)
5.4 Demand and Supply Trends of BP Monitors (2020-2032)
5.5 Impact of Digital Health and AI on BP Monitor Market Trends
6. Competitive Landscape
6.1 List of Major Companies, By Region
6.2 Market Share Analysis, By Region
6.3 Service Benchmarking
6.3.1 Service specifications and features
6.3.2 Pricing
6.4 Strategic Initiatives
6.4.1 Marketing and promotional activities
6.4.2 Distribution and Supply Chain Strategies
6.4.3 Expansion plans and new Service launches
6.4.4 Strategic partnerships and collaborations
6.5 Technological Advancements
6.6 Market Positioning and Branding
7. Blood Pressure Monitors Market Segmentation, by Product
7.1 Chapter Overview
7.2 Devices
7.2.1 Devices Market Trends Analysis (2020-2032)
7.2.2 Devices Market Size Estimates and Forecasts to 2032 (USD Billion)
7.2.3 Sphygmomanometer
7.2.3.1 Sphygmomanometer Market Trends Analysis (2020-2032)
7.2.3.2 Sphygmomanometer Market Size Estimates and Forecasts to 2032 (USD Billion)
7.2.4 Digital BP Monitors
7.2.4.1 Digital BP Monitors Market Trends Analysis (2020-2032)
7.2.4.2 Digital BP Monitors Market Size Estimates and Forecasts to 2032 (USD Billion)
7.2.5 Ambulatory BP Monitors
7.2.5.1 Ambulatory BP Monitors Market Trends Analysis (2020-2032)
7.2.5.2 Ambulatory BP Monitors Market Size Estimates and Forecasts to 2032 (USD Billion)
7.3 Accessories
7.3.1 Accessories Market Trends Analysis (2020-2032)
7.3.2 Accessories Market Size Estimates and Forecasts to 2032 (USD Billion)
7.3.3 Blood Pressure Cuffs
7.3.3.1 Blood Pressure Cuffs Market Trends Analysis (2020-2032)
7.3.3.2 Blood Pressure Cuffs Market Size Estimates and Forecasts to 2032 (USD Billion)
7.3.4 Transducers
7.3.4.1 Transducers Market Trends Analysis (2020-2032)
7.3.4.2 Transducers Market Size Estimates and Forecasts to 2032 (USD Billion)
7.3.5 Others
7.3.5.1 Others Market Trends Analysis (2020-2032)
7.3.5.2 Others Market Size Estimates and Forecasts to 2032 (USD Billion)
8. Blood Pressure Monitors Market Segmentation, by End-user
8.1 Chapter Overview
8.2 Hospitals & Clinics
8.2.1 Hospitals & Clinics Market Trends Analysis (2020-2032)
8.2.2 Hospitals & Clinics Market Size Estimates and Forecasts to 2032 (USD Billion)
8.3 Home Healthcare
8.3.1 Home Healthcare Market Trends Analysis (2020-2032)
8.3.2 Home Healthcare Market Size Estimates and Forecasts to 2032 (USD Billion)
8.4 Others
8.4.1 Others Market Trends Analysis (2020-2032)
8.4.2 Others Market Size Estimates and Forecasts to 2032 (USD Billion)
9. Regional Analysis
9.1 Chapter Overview
9.2 North America
9.2.1 Trends Analysis
9.2.2 North America Blood Pressure Monitors Market Estimates and Forecasts, by Country (2020-2032) (USD Billion)
9.2.3 North America Blood Pressure Monitors Market Estimates and Forecasts, by Product (2020-2032) (USD Billion)
9.2.4 North America Blood Pressure Monitors Market Estimates and Forecasts, by End-user (2020-2032) (USD Billion)
9.2.5 USA
9.2.5.1 USA Blood Pressure Monitors Market Estimates and Forecasts, by Product (2020-2032) (USD Billion)
9.2.5.2 USA Blood Pressure Monitors Market Estimates and Forecasts, by End-user (2020-2032) (USD Billion)
9.2.6 Canada
9.2.6.1 Canada Blood Pressure Monitors Market Estimates and Forecasts, by Product (2020-2032) (USD Billion)
9.2.6.2 Canada Blood Pressure Monitors Market Estimates and Forecasts, by End-user (2020-2032) (USD Billion)
9.2.7 Mexico
9.2.7.1 Mexico Blood Pressure Monitors Market Estimates and Forecasts, by Product (2020-2032) (USD Billion)
9.2.7.2 Mexico Blood Pressure Monitors Market Estimates and Forecasts, by End-user (2020-2032) (USD Billion)
9.3 Europe
9.3.1 Eastern Europe
9.3.1.1 Trends Analysis
9.3.1.2 Eastern Europe Blood Pressure Monitors Market Estimates and Forecasts, by Country (2020-2032) (USD Billion)
9.3.1.3 Eastern Europe Blood Pressure Monitors Market Estimates and Forecasts, by Product (2020-2032) (USD Billion)
9.3.1.4 Eastern Europe Blood Pressure Monitors Market Estimates and Forecasts, by End-user (2020-2032) (USD Billion)
9.3.1.5 Poland
9.3.1.5.1 Poland Blood Pressure Monitors Market Estimates and Forecasts, by Product (2020-2032) (USD Billion)
9.3.1.5.2 Poland Blood Pressure Monitors Market Estimates and Forecasts, by End-user (2020-2032) (USD Billion)
9.3.1.6 Romania
9.3.1.6.1 Romania Blood Pressure Monitors Market Estimates and Forecasts, by Product (2020-2032) (USD Billion)
9.3.1.6.2 Romania Blood Pressure Monitors Market Estimates and Forecasts, by End-user (2020-2032) (USD Billion)
9.3.1.7 Hungary
9.3.1.7.1 Hungary Blood Pressure Monitors Market Estimates and Forecasts, by Product (2020-2032) (USD Billion)
9.3.1.7.2 Hungary Blood Pressure Monitors Market Estimates and Forecasts, by End-user (2020-2032) (USD Billion)
9.3.1.8 Turkey
9.3.1.8.1 Turkey Blood Pressure Monitors Market Estimates and Forecasts, by Product (2020-2032) (USD Billion)
9.3.1.8.2 Turkey Blood Pressure Monitors Market Estimates and Forecasts, by End-user (2020-2032) (USD Billion)
9.3.1.9 Rest of Eastern Europe
9.3.1.9.1 Rest of Eastern Europe Blood Pressure Monitors Market Estimates and Forecasts, by Product (2020-2032) (USD Billion)
9.3.1.9.2 Rest of Eastern Europe Blood Pressure Monitors Market Estimates and Forecasts, by End-user (2020-2032) (USD Billion)
9.3.2 Western Europe
9.3.2.1 Trends Analysis
9.3.2.2 Western Europe Blood Pressure Monitors Market Estimates and Forecasts, by Country (2020-2032) (USD Billion)
9.3.2.3 Western Europe Blood Pressure Monitors Market Estimates and Forecasts, by Product (2020-2032) (USD Billion)
9.3.2.4 Western Europe Blood Pressure Monitors Market Estimates and Forecasts, by End-user (2020-2032) (USD Billion)
9.3.2.5 Germany
9.3.2.5.1 Germany Blood Pressure Monitors Market Estimates and Forecasts, by Product (2020-2032) (USD Billion)
9.3.2.5.2 Germany Blood Pressure Monitors Market Estimates and Forecasts, by End-user (2020-2032) (USD Billion)
9.3.2.6 France
9.3.2.6.1 France Blood Pressure Monitors Market Estimates and Forecasts, by Product (2020-2032) (USD Billion)
9.3.2.6.2 France Blood Pressure Monitors Market Estimates and Forecasts, by End-user (2020-2032) (USD Billion)
9.3.2.7 UK
9.3.2.7.1 UK Blood Pressure Monitors Market Estimates and Forecasts, by Product (2020-2032) (USD Billion)
9.3.2.7.2 UK Blood Pressure Monitors Market Estimates and Forecasts, by End-user (2020-2032) (USD Billion)
9.3.2.8 Italy
9.3.2.8.1 Italy Blood Pressure Monitors Market Estimates and Forecasts, by Product (2020-2032) (USD Billion)
9.3.2.8.2 Italy Blood Pressure Monitors Market Estimates and Forecasts, by End-user (2020-2032) (USD Billion)
9.3.2.9 Spain
9.3.2.9.1 Spain Blood Pressure Monitors Market Estimates and Forecasts, by Product (2020-2032) (USD Billion)
9.3.2.9.2 Spain Blood Pressure Monitors Market Estimates and Forecasts, by End-user (2020-2032) (USD Billion)
9.3.2.10 Netherlands
9.3.2.10.1 Netherlands Blood Pressure Monitors Market Estimates and Forecasts, by Product (2020-2032) (USD Billion)
9.3.2.10.2 Netherlands Blood Pressure Monitors Market Estimates and Forecasts, by End-user (2020-2032) (USD Billion)
9.3.2.11 Switzerland
9.3.2.11.1 Switzerland Blood Pressure Monitors Market Estimates and Forecasts, by Product (2020-2032) (USD Billion)
9.3.2.11.2 Switzerland Blood Pressure Monitors Market Estimates and Forecasts, by End-user (2020-2032) (USD Billion)
9.3.2.12 Austria
9.3.2.12.1 Austria Blood Pressure Monitors Market Estimates and Forecasts, by Product (2020-2032) (USD Billion)
9.3.2.12.2 Austria Blood Pressure Monitors Market Estimates and Forecasts, by End-user (2020-2032) (USD Billion)
9.3.2.13 Rest of Western Europe
9.3.2.13.1 Rest of Western Europe Blood Pressure Monitors Market Estimates and Forecasts, by Product (2020-2032) (USD Billion)
9.3.2.13.2 Rest of Western Europe Blood Pressure Monitors Market Estimates and Forecasts, by End-user (2020-2032) (USD Billion)
9.4 Asia Pacific
9.4.1 Trends Analysis
9.4.2 Asia Pacific Blood Pressure Monitors Market Estimates and Forecasts, by Country (2020-2032) (USD Billion)
9.4.3 Asia Pacific Blood Pressure Monitors Market Estimates and Forecasts, by Product (2020-2032) (USD Billion)
9.4.4 Asia Pacific Blood Pressure Monitors Market Estimates and Forecasts, by End-user (2020-2032) (USD Billion)
9.4.5 China
9.4.5.1 China Blood Pressure Monitors Market Estimates and Forecasts, by Product (2020-2032) (USD Billion)
9.4.5.2 China Blood Pressure Monitors Market Estimates and Forecasts, by End-user (2020-2032) (USD Billion)
9.4.6 India
9.4.5.1 India Blood Pressure Monitors Market Estimates and Forecasts, by Product (2020-2032) (USD Billion)
9.4.5.2 India Blood Pressure Monitors Market Estimates and Forecasts, by End-user (2020-2032) (USD Billion)
9.4.5 Japan
9.4.5.1 Japan Blood Pressure Monitors Market Estimates and Forecasts, by Product (2020-2032) (USD Billion)
9.4.5.2 Japan Blood Pressure Monitors Market Estimates and Forecasts, by End-user (2020-2032) (USD Billion)
9.4.6 South Korea
9.4.6.1 South Korea Blood Pressure Monitors Market Estimates and Forecasts, by Product (2020-2032) (USD Billion)
9.4.6.2 South Korea Blood Pressure Monitors Market Estimates and Forecasts, by End-user (2020-2032) (USD Billion)
9.4.7 Vietnam
9.4.7.1 Vietnam Blood Pressure Monitors Market Estimates and Forecasts, by Product (2020-2032) (USD Billion)
9.2.7.2 Vietnam Blood Pressure Monitors Market Estimates and Forecasts, by End-user (2020-2032) (USD Billion)
9.4.8 Singapore
9.4.8.1 Singapore Blood Pressure Monitors Market Estimates and Forecasts, by Product (2020-2032) (USD Billion)
9.4.8.2 Singapore Blood Pressure Monitors Market Estimates and Forecasts, by End-user (2020-2032) (USD Billion)
9.4.9 Australia
9.4.9.1 Australia Blood Pressure Monitors Market Estimates and Forecasts, by Product (2020-2032) (USD Billion)
9.4.9.2 Australia Blood Pressure Monitors Market Estimates and Forecasts, by End-user (2020-2032) (USD Billion)
9.4.10 Rest of Asia Pacific
9.4.10.1 Rest of Asia Pacific Blood Pressure Monitors Market Estimates and Forecasts, by Product (2020-2032) (USD Billion)
9.4.10.2 Rest of Asia Pacific Blood Pressure Monitors Market Estimates and Forecasts, by End-user (2020-2032) (USD Billion)
9.5 Middle East and Africa
9.5.1 Middle East
9.5.1.1 Trends Analysis
9.5.1.2 Middle East Blood Pressure Monitors Market Estimates and Forecasts, by Country (2020-2032) (USD Billion)
9.5.1.3 Middle East Blood Pressure Monitors Market Estimates and Forecasts, by Product (2020-2032) (USD Billion)
9.5.1.4 Middle East Blood Pressure Monitors Market Estimates and Forecasts, by End-user (2020-2032) (USD Billion)
9.5.1.5 UAE
9.5.1.5.1 UAE Blood Pressure Monitors Market Estimates and Forecasts, by Product (2020-2032) (USD Billion)
9.5.1.5.2 UAE Blood Pressure Monitors Market Estimates and Forecasts, by End-user (2020-2032) (USD Billion)
9.5.1.6 Egypt
9.5.1.6.1 Egypt Blood Pressure Monitors Market Estimates and Forecasts, by Product (2020-2032) (USD Billion)
9.5.1.6.2 Egypt Blood Pressure Monitors Market Estimates and Forecasts, by End-user (2020-2032) (USD Billion)
9.5.1.7 Saudi Arabia
9.5.1.7.1 Saudi Arabia Blood Pressure Monitors Market Estimates and Forecasts, by Product (2020-2032) (USD Billion)
9.5.1.7.2 Saudi Arabia Blood Pressure Monitors Market Estimates and Forecasts, by End-user (2020-2032) (USD Billion)
9.5.1.8 Qatar
9.5.1.8.1 Qatar Blood Pressure Monitors Market Estimates and Forecasts, by Product (2020-2032) (USD Billion)
9.5.1.8.2 Qatar Blood Pressure Monitors Market Estimates and Forecasts, by End-user (2020-2032) (USD Billion)
9.5.1.9 Rest of Middle East
9.5.1.9.1 Rest of Middle East Blood Pressure Monitors Market Estimates and Forecasts, by Product (2020-2032) (USD Billion)
9.5.1.9.2 Rest of Middle East Blood Pressure Monitors Market Estimates and Forecasts, by End-user (2020-2032) (USD Billion)
9.5.2 Africa
9.5.2.1 Trends Analysis
9.5.2.2 Africa Blood Pressure Monitors Market Estimates and Forecasts, by Country (2020-2032) (USD Billion)
9.5.2.3 Africa Blood Pressure Monitors Market Estimates and Forecasts, by Product (2020-2032) (USD Billion)
9.5.2.4 Africa Blood Pressure Monitors Market Estimates and Forecasts, by End-user (2020-2032) (USD Billion)
9.5.2.5 South Africa
9.5.2.5.1 South Africa Blood Pressure Monitors Market Estimates and Forecasts, by Product (2020-2032) (USD Billion)
9.5.2.5.2 South Africa Blood Pressure Monitors Market Estimates and Forecasts, by End-user (2020-2032) (USD Billion)
9.5.2.6 Nigeria
9.5.2.6.1 Nigeria Blood Pressure Monitors Market Estimates and Forecasts, by Product (2020-2032) (USD Billion)
9.5.2.6.2 Nigeria Blood Pressure Monitors Market Estimates and Forecasts, by End-user (2020-2032) (USD Billion)
9.6 Latin America
9.6.1 Trends Analysis
9.6.2 Latin America Blood Pressure Monitors Market Estimates and Forecasts, by Country (2020-2032) (USD Billion)
9.6.3 Latin America Blood Pressure Monitors Market Estimates and Forecasts, by Product (2020-2032) (USD Billion)
9.6.4 Latin America Blood Pressure Monitors Market Estimates and Forecasts, by End-user (2020-2032) (USD Billion)
9.6.5 Brazil
9.6.5.1 Brazil Blood Pressure Monitors Market Estimates and Forecasts, by Product (2020-2032) (USD Billion)
9.6.5.2 Brazil Blood Pressure Monitors Market Estimates and Forecasts, by End-user (2020-2032) (USD Billion)
9.6.6 Argentina
9.6.6.1 Argentina Blood Pressure Monitors Market Estimates and Forecasts, by Product (2020-2032) (USD Billion)
9.6.6.2 Argentina Blood Pressure Monitors Market Estimates and Forecasts, by End-user (2020-2032) (USD Billion)
9.6.7 Colombia
9.6.7.1 Colombia Blood Pressure Monitors Market Estimates and Forecasts, by Product (2020-2032) (USD Billion)
9.6.7.2 Colombia Blood Pressure Monitors Market Estimates and Forecasts, by End-user (2020-2032) (USD Billion)
9.6.8 Rest of Latin America
9.6.8.1 Rest of Latin America Blood Pressure Monitors Market Estimates and Forecasts, by Product (2020-2032) (USD Billion)
9.6.8.2 Rest of Latin America Blood Pressure Monitors Market Estimates and Forecasts, by End-user (2020-2032) (USD Billion)
10. Company Profiles
10.1 Omron Healthcare
10.1.1 Company Overview
10.1.2 Financial
10.1.3 Products/ Services Offered
10.1.4 SWOT Analysis
10.2 Hill-Rom Holdings, Inc. (Welch Allyn, Inc.)
10.2.1 Company Overview
10.2.2 Financial
10.2.3 Products/ Services Offered
10.2.4 SWOT Analysis
10.3 Nihon Kohden Corporation
10.3.1 Company Overview
10.3.2 Financial
10.3.3 Products/ Services Offered
10.3.4 SWOT Analysis
10.4 Koninklijke Philips N.V. (Philips Healthcare)
10.4.1 Company Overview
10.4.2 Financial
10.4.3 Products/ Services Offered
10.4.4 SWOT Analysis
10.5 GE Healthcare
10.5.1 Company Overview
10.5.2 Financial
10.5.3 Products/ Services Offered
10.5.4 SWOT Analysis
10.6 American Diagnostic Corporation
10.6.1 Company Overview
10.6.2 Financial
10.6.3 Products/ Services Offered
10.6.4 SWOT Analysis
10.7 Briggs Healthcare
10.7.1 Company Overview
10.7.2 Financial
10.7.3 Products/ Services Offered
10.7.4 SWOT Analysis
10.8 Microlife AG
10.8.1 Company Overview
10.8.2 Financial
10.8.3 Products/ Services Offered
10.8.4 SWOT Analysis
10.9 Rossmax International Ltd.
10.9.1 Company Overview
10.9.2 Financial
10.9.3 Products/ Services Offered
10.9.4 SWOT Analysis
10.10 Spacelabs Healthcare Inc.
10.10.1 Company Overview
10.10.2 Financial
10.10.3 Products/ Services Offered
10.10.4 SWOT Analysis
11. Use Cases and Best Practices
12. Conclusion
An accurate research report requires proper strategizing as well as implementation. There are multiple factors involved in the completion of good and accurate research report and selecting the best methodology to compete the research is the toughest part. Since the research reports we provide play a crucial role in any company’s decision-making process, therefore we at SNS Insider always believe that we should choose the best method which gives us results closer to reality. This allows us to reach at a stage wherein we can provide our clients best and accurate investment to output ratio.
Each report that we prepare takes a timeframe of 350-400 business hours for production. Starting from the selection of titles through a couple of in-depth brain storming session to the final QC process before uploading our titles on our website we dedicate around 350 working hours. The titles are selected based on their current market cap and the foreseen CAGR and growth.
The 5 steps process:
Step 1: Secondary Research:
Secondary Research or Desk Research is as the name suggests is a research process wherein, we collect data through the readily available information. In this process we use various paid and unpaid databases which our team has access to and gather data through the same. This includes examining of listed companies’ annual reports, Journals, SEC filling etc. Apart from this our team has access to various associations across the globe across different industries. Lastly, we have exchange relationships with various university as well as individual libraries.

Step 2: Primary Research
When we talk about primary research, it is a type of study in which the researchers collect relevant data samples directly, rather than relying on previously collected data. This type of research is focused on gaining content specific facts that can be sued to solve specific problems. Since the collected data is fresh and first hand therefore it makes the study more accurate and genuine.
We at SNS Insider have divided Primary Research into 2 parts.
Part 1 wherein we interview the KOLs of major players as well as the upcoming ones across various geographic regions. This allows us to have their view over the market scenario and acts as an important tool to come closer to the accurate market numbers. As many as 45 paid and unpaid primary interviews are taken from both the demand and supply side of the industry to make sure we land at an accurate judgement and analysis of the market.
This step involves the triangulation of data wherein our team analyses the interview transcripts, online survey responses and observation of on filed participants. The below mentioned chart should give a better understanding of the part 1 of the primary interview.

Part 2: In this part of primary research the data collected via secondary research and the part 1 of the primary research is validated with the interviews from individual consultants and subject matter experts.
Consultants are those set of people who have at least 12 years of experience and expertise within the industry whereas Subject Matter Experts are those with at least 15 years of experience behind their back within the same space. The data with the help of two main processes i.e., FGDs (Focused Group Discussions) and IDs (Individual Discussions). This gives us a 3rd party nonbiased primary view of the market scenario making it a more dependable one while collation of the data pointers.
Step 3: Data Bank Validation
Once all the information is collected via primary and secondary sources, we run that information for data validation. At our intelligence centre our research heads track a lot of information related to the market which includes the quarterly reports, the daily stock prices, and other relevant information. Our data bank server gets updated every fortnight and that is how the information which we collected using our primary and secondary information is revalidated in real time.

Step 4: QA/QC Process
After all the data collection and validation our team does a final level of quality check and quality assurance to get rid of any unwanted or undesired mistakes. This might include but not limited to getting rid of the any typos, duplication of numbers or missing of any important information. The people involved in this process include technical content writers, research heads and graphics people. Once this process is completed the title gets uploader on our platform for our clients to read it.
Step 5: Final QC/QA Process:
This is the last process and comes when the client has ordered the study. In this process a final QA/QC is done before the study is emailed to the client. Since we believe in giving our clients a good experience of our research studies, therefore, to make sure that we do not lack at our end in any way humanly possible we do a final round of quality check and then dispatch the study to the client.
By Product
Devices
Sphygmomanometer
Digital BP Monitors
Ambulatory BP Monitors
Accessories
Blood Pressure Cuffs
Transducers
Others
By End-user
Hospitals & Clinics
Home Healthcare
Others
Request for Segment Customization as per your Business Requirement: Segment Customization Request
Regional Coverage:
North America
US
Canada
Mexico
Europe
Eastern Europe
Poland
Romania
Hungary
Turkey
Rest of Eastern Europe
Western Europe
Germany
France
UK
Italy
Spain
Netherlands
Switzerland
Austria
Rest of Western Europe
Asia Pacific
China
India
Japan
South Korea
Vietnam
Singapore
Australia
Rest of Asia Pacific
Middle East & Africa
Middle East
UAE
Egypt
Saudi Arabia
Qatar
Rest of Middle East
Africa
Nigeria
South Africa
Rest of Africa
Latin America
Brazil
Argentina
Colombia
Rest of Latin America
Request for Country Level Research Report: Country Level Customization Request
Available Customization
With the given market data, SNS Insider offers customization as per the company’s specific needs. The following customization options are available for the report:
Detailed Volume Analysis
Criss-Cross segment analysis (e.g. Product X Application)
Competitive Product Benchmarking
Geographic Analysis
Additional countries in any of the regions
Customized Data Representation
Detailed analysis and profiling of additional market players
Veterinary CRO and CDMO Market was valued at USD 6.23 billion in 2023 and is expected to reach USD 13.3. billion by 2032, growing at a CAGR of 8.84% over the forecast period of 2024-2032.
The Healthcare Cold Chain Monitoring Market Size was valued at USD 2.29 billion in 2023 and is expected to reach USD 5.68 billion by 2032 and grow at a CAGR of 10.64% over the forecast period 2024-2032.
The Radiopharmaceutical Injectors Market was valued at USD 27.8 million in 2023 and will reach USD 52.3 million by 2032, with a growing CAGR of 7.2% during the forecast period of 2024-2032.
The Digital Therapeutics Market size was estimated at USD 6.3 billion in 2023 and is expected to reach USD 50.2 billion by 2032 at a CAGR of 25.9% during the forecast period of 2024-2032.
The Toxoid Vaccine Market Size was worth US$ 5.46 billion in 2023 and is estimated to reach US$ 7.67 billion by 2032, growing at a CAGR of 3.86% by 2024-2032.
The Healthcare Analytical Testing Services Market Size was valued at USD 7.37 Bn in 2023, expected to reach USD 19.14 Bn by 2032 growing at a CAGR of 11.21%.

Hi! Click one of our member below to chat on Phone
© 2025 All Rights Reserved by SNS Insider Pvt Ltd


