image

Blood Pressure Cuffs Market Report Scope & Overview:

Blood Pressure Cuffs Market Revenue Analysis

Get more information on Blood Pressure Cuffs Market - Request Free Sample Report

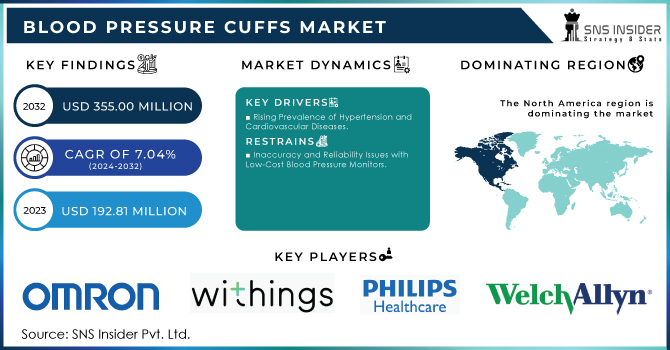
The Blood Pressure Cuffs Market Size was valued at USD 192.81 Million in 2023 and is expected to reach USD 355.00 Million by 2032 and grow at a CAGR of 7.04% over the forecast period 2024-2032.

The blood pressure cuffs market has experienced a notable expansion in recent years due to the rising occurrence of hypertension, an increasing elderly demographic, and enhanced awareness regarding cardiovascular well-being. Blood pressure cuffs, crucial medical instruments utilized for blood pressure assessment, are vital in the diagnosis and management of different health issues, especially high blood pressure. The market includes a variety of products such as manual, digital, and ambulatory blood pressure monitors, all tailored to meet various user requirements.

High blood pressure, also known as hypertension, is a primary factor in cardiovascular diseases, which rank among the top reasons for death globally. The World Health Organization (WHO) reports that around 1.89 billion adults between 30 and 79 years old suffer from hypertension, with most residing in low- and middle-income nations. The increasing prevalence has resulted in a rising need for blood pressure monitoring devices, for both medical and personal use. Blood pressure cuffs play a crucial role in these devices, ensuring precise measurements that are essential for diagnosing and managing hypertension effectively. Elderly individuals are at a higher risk for developing hypertension and associated health problems, which highlights the importance of consistent monitoring. Moreover, improvements in technology have resulted in the creation of more advanced blood pressure monitoring devices, such as digital cuffs which provide convenience, portability, and improved accuracy.

Market Dynamics

Drivers

  • Rising Prevalence of Hypertension and Cardiovascular Diseases.

The worldwide prevalence of high blood pressure is increasing rapidly, with millions of new diagnoses reported annually. This illness, also known as the silent killer, seldom shows signs in the beginning, causing a delay in diagnosis and treatment. Therefore, regular monitoring of blood pressure has become an essential part of preventive healthcare. Blood pressure cuffs are being more widely used in both medical facilities and homes as a key tool for monitoring. Changes in lifestyle, such as unhealthy eating patterns, sedentary behavior, and higher levels of stress, play a major role in the increasing number of hypertension diagnoses. The increasing number of elderly people is another important aspect, as they are more prone to developing high blood pressure. This population change is most noticeable in advanced nations, where healthcare systems are placing more emphasis on the management of chronic illnesses.

  • Technological Advancements in Blood Pressure Monitoring Devices.

Innovations in technology have transformed the market for blood pressure cuffs in the medical device industry. The shift from traditional manual blood pressure monitors to digital and automated ones has improved the accuracy, convenience, and accessibility of monitoring for a wider range of people. Blood pressure monitors with digital technology, including features such as spacious screens, memory capabilities, and error detection, are gaining popularity with customers. These devices make it easier to use as they eliminate the requirement for a stethoscope and manual inflation, particularly beneficial for the elderly and individuals with minimal medical understanding. The addition of Bluetooth and wireless connectivity has improved user experience by enabling the transfer of data to smartphones and health apps for improved tracking and management.

Restraints

  • Inaccuracy and Reliability Issues with Low-Cost Blood Pressure Monitors

The growing number of affordable blood pressure monitors has expanded the reach of these tools to a wider range of people. The affordability of these monitors frequently compromises their accuracy and reliability. Incorrect measurements may result in the improper handling of high blood pressure, posing potential risks for patients. Inexpensive monitors are frequently made using low-quality materials and technology, which may affect how well they work. Calibration problems, low-quality sensors, and erratic readings are frequent issues related to these gadgets. Incorrect readings can result in patients either overestimating or underestimating their blood pressure, which can lead to decisions about treatment that are not appropriate. The dependability of these gadgets is a worry as well, especially in isolated or rural regions where it may be difficult to reach healthcare professionals for verification or calibration. The extensive use of untrustworthy monitors may erode public trust in at-home blood pressure monitoring, leading to a negative effect on the market as a whole.

Market Segmentation Analysis

By Type

Automated cuffs led the market in 2023 with a major market share of 55% and are expected to grow at a faster CAGR during 2024-2032. Automated blood pressure cuffs are becoming more popular because they are simple to use, accurate, and can quickly provide readings without needing extensive training. These devices are frequently seen in household and medical environments, providing the benefit of minimizing mistakes made during manual readings. Incorporating advanced technologies like digital screens and automatic inflation and deflation systems improves user convenience and dependability. Moreover, the increased occurrence of high blood pressure and heart conditions, along with the growing popularity of self-tracking, has led to a higher need for automated blood pressure cuffs. Their fast acceptance is driven by their ability to work well with telemedicine platforms and electronic health records, making them the leading and quickest-growing segment in the market.
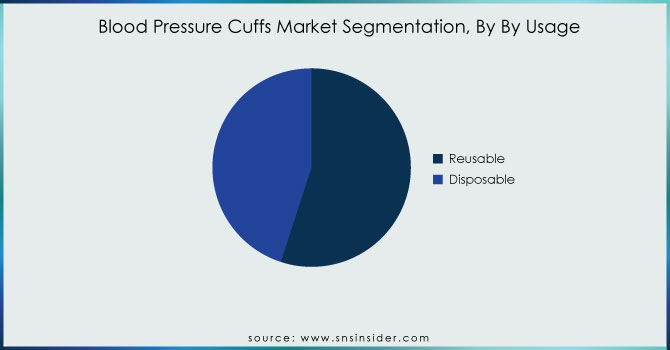
By Usage

Reusable cuffs dominated in 2023 with a market share of 55% because of their cost-effectiveness in the long run, particularly in medical facilities like hospitals and clinics that handle high patient volumes. These restraints are constructed from sturdy materials, enabling them to endure regular usage and cleaning, which makes them a popular option for healthcare facilities seeking to reduce continual expenses. They provide the benefit of being eco-friendly by minimizing medical waste, which supports the growing worldwide focus on sustainability in healthcare.

Blood-Pressure-Cuffs-Market-Segmentation-By-By-Usage

Get Customized Report as per your Business Requirement - Request For Customized Report

Disposable cuffs are to retain their rapid growth rate during 2024-2032 and become the fastest-growing segment. The growing focus on infection control and patient safety is fueling their need, especially in environments with a high risk of cross-contamination like ICUs and ORs. The COVID-19 outbreak hastened this pattern, emphasizing the significance of disposable medical tools in stopping infections from spreading. Healthcare providers find disposables convenient and increasingly affordable, which is attractive in areas with strict infection control rules.

By End User

Hospitals captured a major market share of more than 40% in 2023 and dominated the market. Hospitals always have the greatest need for blood pressure cuffs because they handle a large number of patients every day. These healthcare facilities need dependable, long-lasting, and precise blood pressure monitoring gadgets for different areas like ERs, ICUs, and wards. Hospitals are the main users of blood pressure cuffs due to the need for ongoing patient monitoring and strict healthcare regulations.

Medical centers are accounted for experiencing the most rapid growth in the Blood Pressure Cuffs Market during 2024-2032. The increase in clinics, especially in urban and semi-urban locations, is a major factor contributing to this expansion. Clinics are becoming a more popular choice for regular health check-ups and managing chronic illnesses because they are easily accessible and convenient. Due to the increasing focus on preventative healthcare, clinics are broadening their offerings to include routine blood pressure checks, resulting in a higher need for blood pressure cuffs.

Regional Analysis

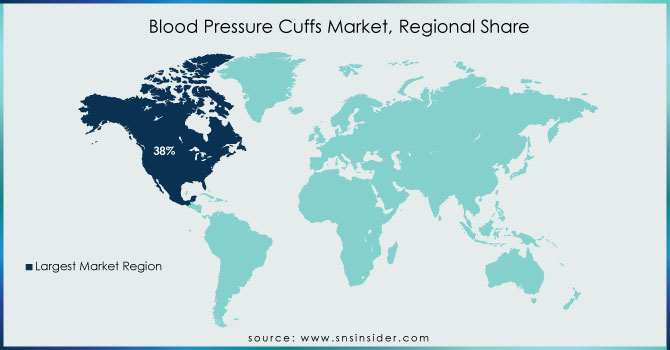
North America led the market in 2023 with a market share of above 38%, because of its excellent healthcare system, high rate of hypertension, and growing focus on monitoring blood pressure. The area sees advantages from substantial healthcare technology investments and the presence of leading market players who continuously create more precise and user-friendly devices. The increasing elderly population, who are at a higher risk for hypertension, continues to drive the need for blood pressure cuffs. Furthermore, the growing prevalence of lifestyle-related illnesses like obesity and heart conditions adds to the rising demand for efficient blood pressure monitoring solutions.

Asia-Pacific is to experience a rapid growth rate during 2024-2032, due to the region's expanding healthcare industry and growing focus on health and well-being. The area is seeing a notable increase in economic growth, leading to better availability of healthcare services and medical equipment. Government efforts to enhance healthcare infrastructure and the increasing utilization of home healthcare options are further fueling market expansion. China, India, and Japan are leading the way in this growth, with growing investments in healthcare and international companies entering to capitalize on the huge opportunities in these developing markets.

Blood-Pressure-Cuffs-Market-Regional-Share

Key Players

The major key players are Omron Healthcare, Withings, Philips Healthcare, A&D Medical, Welch Allyn, Beurer, Microlife, iHealth Labs, CardioCom, SunTech Medical, Spacelabs Healthcare, Draeger, Nisus Corp, GE Healthcare, and other key players.

Recent Development

  • February 2024, Omron Healthcare has developed the Complete Wireless Upper Arm Blood Pressure Monitor + EKG. The device is a blood pressure monitor that incorporates an electrocardiogram to determine the parameters of the human organism’s cardiovascular health. It is designed for more convenient use for the customers at home. The monitor can synchronize its data with a mobile device through Bluetooth.

  • June 2023, Withings has presented the BPM Core as part of the range of the blood pressure monitors. It is considered the most advanced among the range of the Withings devices. The monitor records ECG and operates as a digital stethoscope that can detect any valvular heart disease. The usage is aimed at more detailed self-control of the heart work of the customers at home.

Blood Pressure Cuffs Market Report Scope:

Report Attributes Details
Market Size in 2023 USD 192.81 Million 
Market Size by 2032 USD 355.00 Million 
CAGR CAGR of 7.04% From 2024 to 2032
Base Year 2023
Forecast Period 2024-2032
Historical Data 2020-2022
Report Scope & Coverage Market Size, Segments Analysis, Competitive  Landscape, Regional Analysis, DROC & SWOT Analysis, Forecast Outlook
Key Segments • By Type (Manual, Automated)
• By Usage (Reusable, Disposable)
• By End User (Hospitals, Clinics, Others)
Regional Analysis/Coverage North America (US, Canada, Mexico), Europe (Eastern Europe [Poland, Romania, Hungary, Turkey, Rest of Eastern Europe] Western Europe [Germany, France, UK, Italy, Spain, Netherlands, Switzerland, Austria, Rest of Western Europe]), Asia Pacific (China, India, Japan, South Korea, Vietnam, Singapore, Australia, Rest of Asia Pacific), Middle East & Africa (Middle East [UAE, Egypt, Saudi Arabia, Qatar, Rest of Middle East], Africa [Nigeria, South Africa, Rest of Africa], Latin America (Brazil, Argentina, Colombia, Rest of Latin America)
Company Profiles Omron Healthcare, Withings, Philips Healthcare, A&D Medical, Welch Allyn, Beurer, Microlife, iHealth Labs, CardioCom, SunTech Medical, Spacelabs Healthcare, Draeger, Nisus Corp, GE Healthcare
Key Drivers • Rising Prevalence of Hypertension and Cardiovascular Diseases.
• Technological Advancements in Blood Pressure Monitoring Devices.
RESTRAINTS • Inaccuracy and Reliability Issues with Low-Cost Blood Pressure Monitors

Frequently Asked Questions

Ans:  The Blood Pressure Cuffs Market is expected to grow at a CAGR of 7.04% during 2024-2032.

Ans: Blood Pressure Cuffs Market size was USD 192.81 Million in 2023 and is expected to Reach USD 355.00 Million by 2032.

Ans: Technological advancements in blood pressure monitoring devices are a major growth factor in the Blood Pressure Cuffs Market.

Ans: The automated segment dominated the Blood Pressure Cuffs Market.

Ans: North America dominated the Blood Pressure Cuffs Market in 2023.

Table of Contents

1. Introduction

1.1 Market Definition

1.2 Scope (Inclusion and Exclusions)

1.3 Research Assumptions

2. Executive Summary

2.1 Market Overview

2.2 Regional Synopsis

2.3 Competitive Summary

3. Research Methodology

3.1 Top-Down Approach

3.2 Bottom-up Approach

3.3. Data Validation

3.4 Primary Interviews

4. Market Dynamics Impact Analysis

4.1 Market Driving Factors Analysis

4.1.1 Drivers

4.1.2 Restraints

4.1.3 Opportunities

4.1.4 Challenges

4.2 PESTLE Analysis

4.3 Porter’s Five Forces Model

5. Statistical Insights and Trends Reporting

5.1 Blood Pressure Cuffs Incidence and Prevalence (2023)

     5.2 Blood Pressure Cuffs Prescription Trends, (2023), by Region

     5.3 Blood Pressure Cuffs Device Volume, by Region (2020-2032)

     5.4 Healthcare Spending, by region, (Government, Commercial, Private, Out-of-Pocket), 2023

6. Competitive Landscape

6.1 List of Major Companies, By Region

6.2 Market Share Analysis, By Region

6.3 Product Benchmarking

6.3.1 Product specifications and features

6.3.2 Pricing

6.4 Strategic Initiatives

6.4.1 Marketing and promotional activities

6.4.2 Distribution and supply chain strategies

6.4.3 Expansion plans and new product launches

6.4.4 Strategic partnerships and collaborations

6.5 Technological Advancements

6.6 Market Positioning and Branding

7. Blood Pressure Cuffs Market Segmentation, by Type

7.1 Chapter Overview

7.2 Manual

7.2.1 Manual Market Trends Analysis (2020-2032)

7.2.2 Manual Market Size Estimates and Forecasts to 2032 (USD Million)

7.3 Automated

7.3.1 Automated Market Trends Analysis (2020-2032)

7.3.2 Automated Market Size Estimates and Forecasts to 2032 (USD Million)

8. Blood Pressure Cuffs Market Segmentation, by Usage

8.1 Chapter Overview

8.2 Reusable

8.2.1 Reusable Market Trends Analysis (2020-2032)

8.2.2 Reusable Market Size Estimates and Forecasts to 2032 (USD Million)

8.3 Disposable

8.3.1 Disposable Market Trends Analysis (2020-2032)

8.3.2 Disposable Market Size Estimates and Forecasts to 2032 (USD Million)

9. Blood Pressure Cuffs Market Segmentation, by End User

9.1 Chapter Overview

9.2 Hospitals

9.2.1 Hospitals Market Trends Analysis (2020-2032)

9.2.2 Hospitals Market Size Estimates and Forecasts to 2032 (USD Million)

9.3 Clinics

9.3.1 Clinics Market Trends Analysis (2020-2032)

9.3.2 Clinics Market Size Estimates and Forecasts to 2032 (USD Million)

9.4 Others

               9.4.1 Others Market Trends Analysis (2020-2032)

9.4.2 Others Market Size Estimates and Forecasts to 2032 (USD Million)

10. Regional Analysis

10.1 Chapter Overview

10.2 North America

10.2.1 Trends Analysis

10.2.2 North America Blood Pressure Cuffs Market Estimates and Forecasts, by Country (2020-2032) (USD Million)

10.2.3 North America Blood Pressure Cuffs Market Estimates and Forecasts, by Type (2020-2032) (USD Million) 

10.2.4 North America Blood Pressure Cuffs Market Estimates and Forecasts, by Usage (2020-2032) (USD Million)

10.2.5 North America Blood Pressure Cuffs Market Estimates and Forecasts, by End User (2020-2032) (USD Million)

10.2.6 USA

10.2.6.1 USA Blood Pressure Cuffs Market Estimates and Forecasts, by Type (2020-2032) (USD Million)

10.2.6.2 USA Blood Pressure Cuffs Market Estimates and Forecasts, by Usage (2020-2032) (USD Million)

10.2.6.3 USA Blood Pressure Cuffs Market Estimates and Forecasts, by End User (2020-2032) (USD Million)

10.2.7 Canada

10.2.7.1 Canada Blood Pressure Cuffs Market Estimates and Forecasts, by Type (2020-2032) (USD Million)

10.2.7.2 Canada Blood Pressure Cuffs Market Estimates and Forecasts, by Usage (2020-2032) (USD Million)

10.2.7.3 Canada Blood Pressure Cuffs Market Estimates and Forecasts, by End User (2020-2032) (USD Million)

10.2.8 Mexico

10.2.8.1 Mexico Blood Pressure Cuffs Market Estimates and Forecasts, by Type (2020-2032) (USD Million)

10.2.8.2 Mexico Blood Pressure Cuffs Market Estimates and Forecasts, by Usage (2020-2032) (USD Million)

10.2.8.3 Mexico Blood Pressure Cuffs Market Estimates and Forecasts, by End User (2020-2032) (USD Million)

10.3 Europe

10.3.1 Eastern Europe

10.3.1.1 Trends Analysis

10.3.1.2 Eastern Europe Blood Pressure Cuffs Market Estimates and Forecasts, by Country (2020-2032) (USD Million)

10.3.1.3 Eastern Europe Blood Pressure Cuffs Market Estimates and Forecasts, by Type (2020-2032) (USD Million) 

10.3.1.4 Eastern Europe Blood Pressure Cuffs Market Estimates and Forecasts, by Usage (2020-2032) (USD Million)

10.3.1.5 Eastern Europe Blood Pressure Cuffs Market Estimates and Forecasts, by End User (2020-2032) (USD Million)

10.3.1.6 Poland

10.3.1.6.1 Poland Blood Pressure Cuffs Market Estimates and Forecasts, by Type (2020-2032) (USD Million)

10.3.1.6.2 Poland Blood Pressure Cuffs Market Estimates and Forecasts, by Usage (2020-2032) (USD Million)

10.3.1.6.3 Poland Blood Pressure Cuffs Market Estimates and Forecasts, by End User (2020-2032) (USD Million)

10.3.1.7 Romania

10.3.1.7.1 Romania Blood Pressure Cuffs Market Estimates and Forecasts, by Type (2020-2032) (USD Million)

10.3.1.7.2 Romania Blood Pressure Cuffs Market Estimates and Forecasts, by Usage (2020-2032) (USD Million)

10.3.1.7.3 Romania Blood Pressure Cuffs Market Estimates and Forecasts, by End User (2020-2032) (USD Million)

10.3.1.8 Hungary

10.3.1.8.1 Hungary Blood Pressure Cuffs Market Estimates and Forecasts, by Type (2020-2032) (USD Million)

10.3.1.8.2 Hungary Blood Pressure Cuffs Market Estimates and Forecasts, by Usage (2020-2032) (USD Million)

10.3.1.8.3 Hungary Blood Pressure Cuffs Market Estimates and Forecasts, by End User (2020-2032) (USD Million)

10.3.1.9 Turkey

10.3.1.9.1 Turkey Blood Pressure Cuffs Market Estimates and Forecasts, by Type (2020-2032) (USD Million)

10.3.1.9.2 Turkey Blood Pressure Cuffs Market Estimates and Forecasts, by Usage (2020-2032) (USD Million)

10.3.1.9.3 Turkey Blood Pressure Cuffs Market Estimates and Forecasts, by End User (2020-2032) (USD Million)

10.3.1.10 Rest of Eastern Europe

10.3.1.10.1 Rest of Eastern Europe Blood Pressure Cuffs Market Estimates and Forecasts, by Type (2020-2032) (USD Million)

10.3.1.10.2 Rest of Eastern Europe Blood Pressure Cuffs Market Estimates and Forecasts, by Usage (2020-2032) (USD Million)

10.3.1.10.3 Rest of Eastern Europe Blood Pressure Cuffs Market Estimates and Forecasts, by End User (2020-2032) (USD Million)

10.3.2 Western Europe

10.3.2.1 Trends Analysis

10.3.2.2 Western Europe Blood Pressure Cuffs Market Estimates and Forecasts, by Country (2020-2032) (USD Million)

10.3.2.3 Western Europe Blood Pressure Cuffs Market Estimates and Forecasts, by Type (2020-2032) (USD Million) 

10.3.2.4 Western Europe Blood Pressure Cuffs Market Estimates and Forecasts, by Usage (2020-2032) (USD Million)

10.3.2.5 Western Europe Blood Pressure Cuffs Market Estimates and Forecasts, by End User (2020-2032) (USD Million)

10.3.2.6 Germany

10.3.2.6.1 Germany Blood Pressure Cuffs Market Estimates and Forecasts, by Type (2020-2032) (USD Million)

10.3.2.6.2 Germany Blood Pressure Cuffs Market Estimates and Forecasts, by Usage (2020-2032) (USD Million)

10.3.2.6.3 Germany Blood Pressure Cuffs Market Estimates and Forecasts, by End User (2020-2032) (USD Million)

10.3.2.7 France

10.3.2.7.1 France Blood Pressure Cuffs Market Estimates and Forecasts, by Type (2020-2032) (USD Million)

10.3.2.7.2 France Blood Pressure Cuffs Market Estimates and Forecasts, by Usage (2020-2032) (USD Million)

10.3.2.7.3 France Blood Pressure Cuffs Market Estimates and Forecasts, by End User (2020-2032) (USD Million)

10.3.2.8 UK

10.3.2.8.1 UK Blood Pressure Cuffs Market Estimates and Forecasts, by Type (2020-2032) (USD Million)

10.3.2.8.2 UK Blood Pressure Cuffs Market Estimates and Forecasts, by Usage (2020-2032) (USD Million)

10.3.2.8.3 UK Blood Pressure Cuffs Market Estimates and Forecasts, by End User (2020-2032) (USD Million)

10.3.2.9 Italy

10.3.2.9.1 Italy Blood Pressure Cuffs Market Estimates and Forecasts, by Type (2020-2032) (USD Million)

10.3.2.9.2 Italy Blood Pressure Cuffs Market Estimates and Forecasts, by Usage (2020-2032) (USD Million)

10.3.2.9.3 Italy Blood Pressure Cuffs Market Estimates and Forecasts, by End User (2020-2032) (USD Million)

10.3.2.10 Spain

10.3.2.10.1 Spain Blood Pressure Cuffs Market Estimates and Forecasts, by Type (2020-2032) (USD Million)

10.3.2.10.2 Spain Blood Pressure Cuffs Market Estimates and Forecasts, by Usage (2020-2032) (USD Million)

10.3.2.10.3 Spain Blood Pressure Cuffs Market Estimates and Forecasts, by End User (2020-2032) (USD Million)

10.3.2.11 Netherlands

10.3.2.11.1 Netherlands Blood Pressure Cuffs Market Estimates and Forecasts, by Type (2020-2032) (USD Million)

10.3.2.11.2 Netherlands Blood Pressure Cuffs Market Estimates and Forecasts, by Usage (2020-2032) (USD Million)

10.3.2.11.3 Netherlands Blood Pressure Cuffs Market Estimates and Forecasts, by End User (2020-2032) (USD Million)

10.3.2.12 Switzerland

10.3.2.12.1 Switzerland Blood Pressure Cuffs Market Estimates and Forecasts, by Type (2020-2032) (USD Million)

10.3.2.12.2 Switzerland Blood Pressure Cuffs Market Estimates and Forecasts, by Usage (2020-2032) (USD Million)

10.3.2.12.3 Switzerland Blood Pressure Cuffs Market Estimates and Forecasts, by End User (2020-2032) (USD Million)

10.3.2.13 Austria

10.3.2.13.1 Austria Blood Pressure Cuffs Market Estimates and Forecasts, by Type (2020-2032) (USD Million)

10.3.2.13.2 Austria Blood Pressure Cuffs Market Estimates and Forecasts, by Usage (2020-2032) (USD Million)

10.3.2.13.3 Austria Blood Pressure Cuffs Market Estimates and Forecasts, by End User (2020-2032) (USD Million)

10.3.2.14 Rest of Western Europe

10.3.2.14.1 Rest of Western Europe Blood Pressure Cuffs Market Estimates and Forecasts, by Type (2020-2032) (USD Million)

10.3.2.14.2 Rest of Western Europe Blood Pressure Cuffs Market Estimates and Forecasts, by Usage (2020-2032) (USD Million)

10.3.2.14.3 Rest of Western Europe Blood Pressure Cuffs Market Estimates and Forecasts, by End User (2020-2032) (USD Million)

10.4 Asia Pacific

10.4.1 Trends Analysis

10.4.2 Asia Pacific Blood Pressure Cuffs Market Estimates and Forecasts, by Country (2020-2032) (USD Million)

10.4.3 Asia Pacific Blood Pressure Cuffs Market Estimates and Forecasts, by Type (2020-2032) (USD Million) 

10.4.4 Asia Pacific Blood Pressure Cuffs Market Estimates and Forecasts, by Usage (2020-2032) (USD Million)

10.4.5 Asia Pacific Blood Pressure Cuffs Market Estimates and Forecasts, by End User (2020-2032) (USD Million)

10.4.6 China

10.4.6.1 China Blood Pressure Cuffs Market Estimates and Forecasts, by Type (2020-2032) (USD Million)

10.4.6.2 China Blood Pressure Cuffs Market Estimates and Forecasts, by Usage (2020-2032) (USD Million)

10.4.6.3 China Blood Pressure Cuffs Market Estimates and Forecasts, by End User (2020-2032) (USD Million)

10.4.7 India

10.4.7.1 India Blood Pressure Cuffs Market Estimates and Forecasts, by Type (2020-2032) (USD Million)

10.4.7.2 India Blood Pressure Cuffs Market Estimates and Forecasts, by Usage (2020-2032) (USD Million)

10.4.7.3 India Blood Pressure Cuffs Market Estimates and Forecasts, by End User (2020-2032) (USD Million)

10.4.8 Japan

10.4.8.1 Japan Blood Pressure Cuffs Market Estimates and Forecasts, by Type (2020-2032) (USD Million)

10.4.8.2 Japan Blood Pressure Cuffs Market Estimates and Forecasts, by Usage (2020-2032) (USD Million)

10.4.8.3 Japan Blood Pressure Cuffs Market Estimates and Forecasts, by End User (2020-2032) (USD Million)

10.4.9 South Korea

10.4.9.1 South Korea Blood Pressure Cuffs Market Estimates and Forecasts, by Type (2020-2032) (USD Million)

10.4.9.2 South Korea Blood Pressure Cuffs Market Estimates and Forecasts, by Usage (2020-2032) (USD Million)

10.4.9.3 South Korea Blood Pressure Cuffs Market Estimates and Forecasts, by End User (2020-2032) (USD Million)

10.4.10 Vietnam

10.4.10.1 Vietnam Blood Pressure Cuffs Market Estimates and Forecasts, by Type (2020-2032) (USD Million)

10.4.10.2 Vietnam Blood Pressure Cuffs Market Estimates and Forecasts, by Usage (2020-2032) (USD Million)

10.4.10.3 Vietnam Blood Pressure Cuffs Market Estimates and Forecasts, by End User (2020-2032) (USD Million)

10.4.11 Singapore

10.4.11.1 Singapore Blood Pressure Cuffs Market Estimates and Forecasts, by Type (2020-2032) (USD Million)

10.4.11.2 Singapore Blood Pressure Cuffs Market Estimates and Forecasts, by Usage (2020-2032) (USD Million)

10.4.11.3 Singapore Blood Pressure Cuffs Market Estimates and Forecasts, by End User (2020-2032) (USD Million)

10.4.12 Australia

10.4.12.1 Australia Blood Pressure Cuffs Market Estimates and Forecasts, by Type (2020-2032) (USD Million)

10.4.12.2 Australia Blood Pressure Cuffs Market Estimates and Forecasts, by Usage (2020-2032) (USD Million)

10.4.12.3 Australia Blood Pressure Cuffs Market Estimates and Forecasts, by End User (2020-2032) (USD Million)

10.4.13 Rest of Asia Pacific

10.4.13.1 Rest of Asia Pacific Blood Pressure Cuffs Market Estimates and Forecasts, by Type (2020-2032) (USD Million)

10.4.13.2 Rest of Asia Pacific Blood Pressure Cuffs Market Estimates and Forecasts, by Usage (2020-2032) (USD Million)

10.4.13.3 Rest of Asia Pacific Blood Pressure Cuffs Market Estimates and Forecasts, by End User (2020-2032) (USD Million)

10.5 Middle East and Africa

10.5.1 Middle East

10.5.1.1 Trends Analysis

10.5.1.2 Middle East Blood Pressure Cuffs Market Estimates and Forecasts, by Country (2020-2032) (USD Million)

10.5.1.3 Middle East Blood Pressure Cuffs Market Estimates and Forecasts, by Type (2020-2032) (USD Million) 

10.5.1.4 Middle East Blood Pressure Cuffs Market Estimates and Forecasts, by Usage (2020-2032) (USD Million)

10.5.1.5 Middle East Blood Pressure Cuffs Market Estimates and Forecasts, by End User (2020-2032) (USD Million)

10.5.1.6 UAE

10.5.1.6.1 UAE Blood Pressure Cuffs Market Estimates and Forecasts, by Type (2020-2032) (USD Million)

10.5.1.6.2 UAE Blood Pressure Cuffs Market Estimates and Forecasts, by Usage (2020-2032) (USD Million)

10.5.1.6.3 UAE Blood Pressure Cuffs Market Estimates and Forecasts, by End User (2020-2032) (USD Million)

10.5.1.7 Egypt

10.5.1.7.1 Egypt Blood Pressure Cuffs Market Estimates and Forecasts, by Type (2020-2032) (USD Million)

10.5.1.7.2 Egypt Blood Pressure Cuffs Market Estimates and Forecasts, by Usage (2020-2032) (USD Million)

10.5.1.7.3 Egypt Blood Pressure Cuffs Market Estimates and Forecasts, by End User (2020-2032) (USD Million)

10.5.1.8 Saudi Arabia

10.5.1.8.1 Saudi Arabia Blood Pressure Cuffs Market Estimates and Forecasts, by Type (2020-2032) (USD Million)

10.5.1.8.2 Saudi Arabia Blood Pressure Cuffs Market Estimates and Forecasts, by Usage (2020-2032) (USD Million)

10.5.1.8.3 Saudi Arabia Blood Pressure Cuffs Market Estimates and Forecasts, by End User (2020-2032) (USD Million)

10.5.1.9 Qatar

10.5.1.9.1 Qatar Blood Pressure Cuffs Market Estimates and Forecasts, by Type (2020-2032) (USD Million)

10.5.1.9.2 Qatar Blood Pressure Cuffs Market Estimates and Forecasts, by Usage (2020-2032) (USD Million)

10.5.1.9.3 Qatar Blood Pressure Cuffs Market Estimates and Forecasts, by End User (2020-2032) (USD Million)

10.5.1.10 Rest of Middle East

10.5.1.10.1 Rest of Middle East Blood Pressure Cuffs Market Estimates and Forecasts, by Type (2020-2032) (USD Million)

10.5.1.10.2 Rest of Middle East Blood Pressure Cuffs Market Estimates and Forecasts, by Usage (2020-2032) (USD Million)

10.5.1.10.3 Rest of Middle East Blood Pressure Cuffs Market Estimates and Forecasts, by End User (2020-2032) (USD Million)

10.5.2 Africa

10.5.2.1 Trends Analysis

10.5.2.2 Africa Blood Pressure Cuffs Market Estimates and Forecasts, by Country (2020-2032) (USD Million)

10.5.2.3 Africa Blood Pressure Cuffs Market Estimates and Forecasts, by Type (2020-2032) (USD Million) 

10.5.2.4 Africa Blood Pressure Cuffs Market Estimates and Forecasts, by Usage (2020-2032) (USD Million)

10.5.2.5 Africa Blood Pressure Cuffs Market Estimates and Forecasts, by End User (2020-2032) (USD Million)

10.5.2.6 South Africa

10.5.2.6.1 South Africa Blood Pressure Cuffs Market Estimates and Forecasts, by Type (2020-2032) (USD Million)

10.5.2.6.2 South Africa Blood Pressure Cuffs Market Estimates and Forecasts, by Usage (2020-2032) (USD Million)

10.5.2.6.3 South Africa Blood Pressure Cuffs Market Estimates and Forecasts, by End User (2020-2032) (USD Million)

10.5.2.7 Nigeria

10.5.2.7.1 Nigeria Blood Pressure Cuffs Market Estimates and Forecasts, by Type (2020-2032) (USD Million)

10.5.2.7.2 Nigeria Blood Pressure Cuffs Market Estimates and Forecasts, by Usage (2020-2032) (USD Million)

10.5.2.7.3 Nigeria Blood Pressure Cuffs Market Estimates and Forecasts, by End User (2020-2032) (USD Million)

10.5.2.8 Rest of Africa

10.5.2.8.1 Rest of Africa Blood Pressure Cuffs Market Estimates and Forecasts, by Type (2020-2032) (USD Million)

10.5.2.8.2 Rest of Africa Blood Pressure Cuffs Market Estimates and Forecasts, by Usage (2020-2032) (USD Million)

10.5.2.8.3 Rest of Africa Blood Pressure Cuffs Market Estimates and Forecasts, by End User (2020-2032) (USD Million)

10.6 Latin America

10.6.1 Trends Analysis

10.6.2 Latin America Blood Pressure Cuffs Market Estimates and Forecasts, by Country (2020-2032) (USD Million)

10.6.3 Latin America Blood Pressure Cuffs Market Estimates and Forecasts, by Type (2020-2032) (USD Million) 

10.6.4 Latin America Blood Pressure Cuffs Market Estimates and Forecasts, by Usage (2020-2032) (USD Million)

10.6.5 Latin America Blood Pressure Cuffs Market Estimates and Forecasts, by End User (2020-2032) (USD Million)

10.6.6 Brazil

10.6.6.1 Brazil Blood Pressure Cuffs Market Estimates and Forecasts, by Type (2020-2032) (USD Million)

10.6.6.2 Brazil Blood Pressure Cuffs Market Estimates and Forecasts, by Usage (2020-2032) (USD Million)

10.6.6.3 Brazil Blood Pressure Cuffs Market Estimates and Forecasts, by End User (2020-2032) (USD Million)

10.6.7 Argentina

10.6.7.1 Argentina Blood Pressure Cuffs Market Estimates and Forecasts, by Type (2020-2032) (USD Million)

10.6.7.2 Argentina Blood Pressure Cuffs Market Estimates and Forecasts, by Usage (2020-2032) (USD Million)

10.6.7.3 Argentina Blood Pressure Cuffs Market Estimates and Forecasts, by End User (2020-2032) (USD Million)

10.6.8 Colombia

10.6.8.1 Colombia Blood Pressure Cuffs Market Estimates and Forecasts, by Type (2020-2032) (USD Million)

10.6.8.2 Colombia Blood Pressure Cuffs Market Estimates and Forecasts, by Usage (2020-2032) (USD Million)

10.6.8.3 Colombia Blood Pressure Cuffs Market Estimates and Forecasts, by End User (2020-2032) (USD Million)

10.6.9 Rest of Latin America

10.6.9.1 Rest of Latin America Blood Pressure Cuffs Market Estimates and Forecasts, by Type (2020-2032) (USD Million)

10.6.9.2 Rest of Latin America Blood Pressure Cuffs Market Estimates and Forecasts, by Usage (2020-2032) (USD Million)

10.6.9.3 Rest of Latin America Blood Pressure Cuffs Market Estimates and Forecasts, by End User (2020-2032) (USD Million)

11. Company Profiles

11.1 Omron Healthcare

11.1.1 Company Overview

11.1.2 Financial

11.1.3 Products/ Services Offered

11.1.4 SWOT Analysis

11.2 Withings

11.2.1 Company Overview

11.2.2 Financial

11.2.3 Products/ Services Offered

11.2.4 SWOT Analysis

11.3 Philips Healthcare

11.3.1 Company Overview

11.3.2 Financial

11.3.3 Products/ Services Offered

11.3.4 SWOT Analysis

11.4 A&D Medical

11.4.1 Company Overview

11.4.2 Financial

11.4.3 Products/ Services Offered

11.4.4 SWOT Analysis

11.5 Welch Allyn

11.5.1 Company Overview

11.5.2 Financial

11.5.3 Products/ Services Offered

11.5.4 SWOT Analysis

11.6 Beurer

11.6.1 Company Overview

11.6.2 Financial

11.6.3 Products/ Services Offered

11.6.4 SWOT Analysis

11.7 Microlife

11.7.1 Company Overview

11.7.2 Financial

11.7.3 Products/ Services Offered

11.7.4 SWOT Analysis

11.8 iHealth Labs

             11.8.1 Company Overview

11.8.2 Financial

11.8.3 Products/ Services Offered

11.8.4 SWOT Analysis

11.9 CardioCom

11.9.1 Company Overview

11.9.2 Financial

11.9.3 Products/ Services Offered

11.9.4 SWOT Analysis

11.10 SunTech Medical

11.10.1 Company Overview

11.10.2 Financial

11.10.3 Products/ Services Offered

11.10.4 SWOT Analysis

12. Use Cases and Best Practices

13. Conclusion

An accurate research report requires proper strategizing as well as implementation. There are multiple factors involved in the completion of good and accurate research report and selecting the best methodology to compete the research is the toughest part. Since the research reports we provide play a crucial role in any company’s decision-making process, therefore we at SNS Insider always believe that we should choose the best method which gives us results closer to reality. This allows us to reach at a stage wherein we can provide our clients best and accurate investment to output ratio.

Each report that we prepare takes a timeframe of 350-400 business hours for production. Starting from the selection of titles through a couple of in-depth brain storming session to the final QC process before uploading our titles on our website we dedicate around 350 working hours. The titles are selected based on their current market cap and the foreseen CAGR and growth.


The 5 steps process:

Step 1: Secondary Research:

Secondary Research or Desk Research is as the name suggests is a research process wherein, we collect data through the readily available information. In this process we use various paid and unpaid databases which our team has access to and gather data through the same. This includes examining of listed companies’ annual reports, Journals, SEC filling etc. Apart from this our team has access to various associations across the globe across different industries. Lastly, we have exchange relationships with various university as well as individual libraries.

Secondary Research

Step 2: Primary Research

When we talk about primary research, it is a type of study in which the researchers collect relevant data samples directly, rather than relying on previously collected data.  This type of research is focused on gaining content specific facts that can be sued to solve specific problems. Since the collected data is fresh and first hand therefore it makes the study more accurate and genuine.

We at SNS Insider have divided Primary Research into 2 parts.

Part 1 wherein we interview the KOLs of major players as well as the upcoming ones across various geographic regions. This allows us to have their view over the market scenario and acts as an important tool to come closer to the accurate market numbers. As many as 45 paid and unpaid primary interviews are taken from both the demand and supply side of the industry to make sure we land at an accurate judgement and analysis of the market.

This step involves the triangulation of data wherein our team analyses the interview transcripts, online survey responses and observation of on filed participants. The below mentioned chart should give a better understanding of the part 1 of the primary interview.

Primary Research

Part 2: In this part of primary research the data collected via secondary research and the part 1 of the primary research is validated with the interviews from individual consultants and subject matter experts.

Consultants are those set of people who have at least 12 years of experience and expertise within the industry whereas Subject Matter Experts are those with at least 15 years of experience behind their back within the same space. The data with the help of two main processes i.e., FGDs (Focused Group Discussions) and IDs (Individual Discussions). This gives us a 3rd party nonbiased primary view of the market scenario making it a more dependable one while collation of the data pointers.

Step 3: Data Bank Validation

Once all the information is collected via primary and secondary sources, we run that information for data validation. At our intelligence centre our research heads track a lot of information related to the market which includes the quarterly reports, the daily stock prices, and other relevant information. Our data bank server gets updated every fortnight and that is how the information which we collected using our primary and secondary information is revalidated in real time.

Data Bank Validation

Step 4: QA/QC Process

After all the data collection and validation our team does a final level of quality check and quality assurance to get rid of any unwanted or undesired mistakes. This might include but not limited to getting rid of the any typos, duplication of numbers or missing of any important information. The people involved in this process include technical content writers, research heads and graphics people. Once this process is completed the title gets uploader on our platform for our clients to read it.

Step 5: Final QC/QA Process:

This is the last process and comes when the client has ordered the study. In this process a final QA/QC is done before the study is emailed to the client. Since we believe in giving our clients a good experience of our research studies, therefore, to make sure that we do not lack at our end in any way humanly possible we do a final round of quality check and then dispatch the study to the client.

Key Market Segmentation:

By Type

  • Manual
  • Automated

By Usage

  • Reusable
  • Disposable

By End User

  • Hospitals
  • Clinics
  • Others

Request for Segment Customization as per your Business Requirement: Segment Customization Request

REGIONAL COVERAGE:

North America

  • US
  • Canada
  • Mexico

Europe

  • Eastern Europe
    • Poland
    • Romania
    • Hungary
    • Turkey
    • Rest of Eastern Europe
  • Western Europe
    • Germany
    • France
    • UK
    • Italy
    • Spain
    • Netherlands
    • Switzerland
    • Austria
    • Rest of Western Europe

Asia Pacific

  • China
  • India
  • Japan
  • South Korea
  • Vietnam
  • Singapore
  • Australia
  • Rest of Asia Pacific

Middle East & Africa

  • Middle East
    • UAE
    • Egypt
    • Saudi Arabia
    • Qatar
    • Rest of the Middle East
  • Africa
    • Nigeria
    • South Africa
    • Rest of Africa

Latin America

  • Brazil
  • Argentina
  • Colombia

Request for Country Level Research Report: Country Level Customization Request

Available Customization

With the given market data, SNS Insider offers customization as per the company’s specific needs. The following customization options are available for the report:

  • Product Analysis
  • Criss-Cross segment analysis (e.g. Product X Application)
  • Product Matrix which gives a detailed comparison of the product portfolio of each company
  • Geographic Analysis
  • Additional countries in any of the regions
  • Company Information
  • Detailed analysis and profiling of additional market players (Up to five)

  •            5000 (33% Discount)


  •            8950 (40% Discount)


  •            3050 (23% Discount)

Start a Conversation

Hi! Click one of our member below to chat on Phone