Blood Collection Market Size & Report Overview:
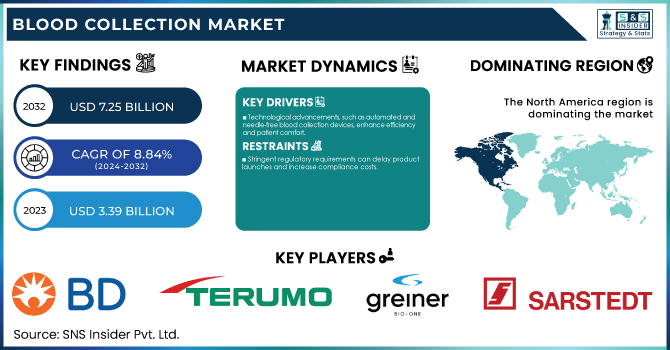
The Blood Collection Market Size valued at USD 3.39 billion in 2023, projected to reach USD 7.25 billion by 2032, with an 8.84% CAGR over the forecast period 2024-2032.
To Get more information on Blood Collection Market- Request Free Sample Report
Blood Collection Market report presents key statistics on the market status of the manufacturers and is a valuable source of guidance and direction for companies and individuals interested in the industry. It presents information on the prevalence and incidence of blood-related ailments, emphasizing the high demand for blood collection processes. It also examines the blood collection device market and its volume formation and market trends at the regional level. It also examines blood collection spending in the health sector, covering spending by the public sector, private sector. The study examines blood donation and collection trends, comparing voluntary vs. paid donations and seasonal variations. The report evaluates new blood collection technologies and microfluidics as well as changing regulatory compliance landscapes across major markets. This report offers comprehensive data-driven insights for industry players, healthcare providers, and policymakers. The blood collection market is experiencing a steady growth due to the rising prevalence of chronic diseases and increasing demand for diagnostic testing.
Blood Collection Market Dynamics
Drivers
-
Technological advancements, such as automated and needle-free blood collection devices, enhance efficiency and patient comfort.
The blood collection market is primarily driven by technological advancements that are bolstering greater efficiency, safety, and patient comfort. Automation and digital technologies have transformed conventional blood collection practices. Lab-assisted systems, revolutionized by automated blood collection systems, have made the process faster and efficient, but they have diminished some errors caused by human intervention. For example, the introduction of automated devices has significantly reduced collection time, enhancing throughput within high-volume environments. Additionally, the development of portable blood collection devices has expanded access to phlebotomy services, particularly in remote or underserved areas, ensuring timely diagnostics and treatment. Single-use, sterile equipment and an array of new safety protocols have greatly decreased the chance of contamination and infection when taking a blood sample. Through electronic health records and real-time monitoring systems that allow for the collection of precise patient information, the incorporation of digital technology has enhanced the way data is processed and simplified the work of healthcare professionals. These technological innovations collectively contribute to the market's growth by addressing critical challenges in blood collection and meeting the evolving needs of healthcare systems.
Restraints:
-
Stringent regulatory requirements can delay product launches and increase compliance costs.
The Blood Collection market has strict regulatory standards, making it difficult for companies to introduce new products. These new regulations require significant investments in the evaluation and testing of products, which can have implications for profitability and competitiveness. The U.S. Food and Drug Administration (FDA) imposes strict regulatory frameworks on blood collection devices with successive clinical trials, quality assurance, and measures before approval. Likewise, the European Medicines Agency (EMA) requires compliance with the In Vitro Diagnostic Regulation (IVDR), which imposes stringent validation and performance standards for devices. It takes a significant amount of time and money to navigate these regulatory hurdles, which can delay product launches and limit market access among smaller companies. Moreover, compliance is an ongoing process; companies must continually update their products and practices to align with evolving regulations, further straining resources. Despite such challenges, compliance with such standards becomes necessary to maintain the safety and efficacy of blood collection devices, thereby safeguarding patient health.
Opportunities:
• Significant growth potential through expansion in emerging markets with growing healthcare infrastructure
Emerging markets, particularly in the Asia Pacific, is expected to offer significant growth opportunities for the blood collection industry. The demand for the global diagnostic imaging market is projected to grow significantly due to the improved healthcare infrastructure and growing emphasis on diagnostic services. China is expected to hold the highest CAGR in the Asia Pacific region over the forecast period as its healthcare details are in the phase of evolution. Technological innovations are also propelling market expansion. For instance, in September 2024, Husky Technologies and Kriya Medical Technologies Pvt. Ltd. introduced India's first ICHOR medical system for blood collection tubes. In response to the increasing demand for streamlined blood collection solutions, this system can manufacture up to 250 million tubes per year, with a cycle time of less than 5.5 seconds. In addition, the rising number of chronic diseases is leading to increased use of blood diagnostics, further boosting the demand for blood collection devices. According to the World Health Organization, 118.5 million blood donations are collected globally each year, indicating the essential role of blood collection in the healthcare.
Challenges:
-
Supply chain disruptions, such as raw material shortages and shipping delays, can impact product availability and pricing.
There are huge supply chain challenges in the blood collection market, affecting product availability and pricing. A recent survey indicates that nearly 80% of healthcare providers and 84% of suppliers expect these challenges to worsen or remain the same in the coming year. Over half of all suppliers report operational impacts due to these issues, with contributing factors such as geopolitical instability, severe weather events, regulatory policy changes, and more. Additionally, product back orders and shortages have become prevalent, leading to increased operational burdens and disruptions in patient care. For example, 67% of providers spend more than 10 hours each week mitigating supply chain issues, and nearly 40% had to cancel or reschedule cases quarterly (or more often) in response to product shortages. The challenges were amplified by recent events like a cyberattack on OneBlood, a large blood distributor with over 250 hospitals in the U.S. Southeast, which has left the organization struggling to implement a plan to recycle blood and platelets following its operational disruption. These compound challenges highlight the urgency for strategic actions to strengthen supply chain resilience in the blood collection industry.
Blood Collection Market Segmentation Analysis
By Collection Site
The venous segment held the highest share of revenue, 81% of the blood collection market in 2023. This growth is driven by the reliability and efficiency of venous blood collection used for diagnostic tests. Venous blood sample provides a greater volume of blood, which is highly valuable for extensive examination and analyses. Venous blood collection is the method of choice for the majority of laboratory tests due to the higher accuracy and the capability to perform multiple tests from a single sample, according to the American Society for Clinical Laboratory Science. In 2023, the US conducted more than 14 billion laboratory tests, many of which required venous blood work, according to the CDC. This large number of tests further adds to the importance of blood testing in clinical diagnostics that is primarily performed with venous blood. In addition, the National Institutes of Health (NIH) has made significant investments using studies utilizing venous blood samples genetic, biomarker discovery, etc., which will further propel the demand for venous blood collection devices. In addition to the previous advantages, venous blood collection is favored by the fact that the risk of hemolysis in blood samples is lower than in other methods, thus contributing to the reliability of the tests. Driven by the increasing emphasis by healthcare systems across the globe on preventive care and early disease detection, the demand for venous blood collection is expected to remain strong, maintaining its dominant position in the market.
By Application
The largest blood collection segment was diagnostics, which accounted for a 67% market share in 2023, underpinning the vital importance of blood tests in disease diagnosis and management. The rising burden of chronic diseases and increased focus on preventive care are responsible for such a sizable market share. According to the National Center for Health Statistics, in 2023, there were over 1 billion visits to physician offices, hospital outpatient departments, and emergency departments in the United States, many of which involved diagnostic blood tests. Laboratory tests contribute to an estimated 70% of medical decisions, according to the Centers for Disease Control and Prevention (CDC), making blood collection critical for diagnostic applications. Moreover, the growing application of precision medicine has stimulated demand for genetic testing and biomarker analysis that are usually based on blood specimens. The National Cancer Institute states that in 2023, over 1.9 million new cancer cases were diagnosed in the U.S., many of which were detected or monitored through blood tests.
The dominance of the diagnostics segment in the global diagnostics is further bolstered by advances in diagnostics technologies in blood, such as the use of liquid biopsies for cancer diagnosis and monitoring. Various blood-based diagnostic tests have gained approval from the U.S. Food and Drug Administration (FDA) in the past years, which in turn augments the demand for blood collection devices in the diagnostics sector. The increase in the diagnostics segment as the largest segment in the blood collection market is primarily because of the growing focus of healthcare systems all over the world on early disease detection and personalized treatment approach.
By Method
Manual blood collection held the largest market share of 74% in 2023 due to its extensive use, cost-effectiveness, and reliability. Blood sample collection by hand is still the primary technique used to obtain blood samples from patients in clinical settings where resources are scarce. According to the World Health Organization (WHO), manual blood collection is still the primary method used in over 80% of blood donations worldwide. In the U.S., the American Red Cross, which processes 40% of the country’s blood supply, predominantly uses manual collection methods. According to the National Blood Collection and Utilization Survey, more than 13 million units of whole blood and red blood cells were collected in the United States in 2023, most of which were procured manually. This high volume evidences the ever-dependence on manual blood collection techniques. The preference for manual blood collection is also supported by its versatility and the skill of phlebotomists. The Bureau of Labor Statistics projects a 10% growth in phlebotomist jobs from 2024 to 2034, faster than the average for all occupations, indicating the ongoing importance of manual blood collection skills. Additionally, manual methods are often preferred in pediatric care and for patients with difficult venous access, contributing to their dominant market share. As automated systems become more popular, manual blood collection is likely to remain the most widely used method in the market due to its simple, cost-effective, and reliable nature.
By End Use
The hospitals segment accounted for the largest share of 37% in 2023, driven by the critical role hospitals play in healthcare delivery and the wide range of diagnostic services they provide. Hospitals account for a large number of patients, various medical procedures, and complete diagnostics, which are some of the key reasons for the dominance of the hospitals. In the United States, approximately 36 million hospital admissions occurred in 2023, according to the American Hospital Association, with most admissions needing multiple blood tests. According to the Centers for Disease Control and Prevention, there were more than 130 million emergency department visits in the U.S. in 2023, hundreds of millions of them involving blood collection for clinical testing. Moreover, the National Center for Health Statistics reported that hospitals conducted more than 48 million inpatient procedures in 2023, bolstering the demand for blood collection devices in hospitals.
Hospitals are also at the forefront of adopting advanced blood collection technologies and practices. The Joint Commission accredits more than 22,000 health care organizations and programs in the United States. The hospital's Joint Commission accreditation for strict standards on blood collection procedures. This emphasis on quality and safety helps further entrench hospitals in the blood collection landscape. According to the National Blood Collection and Utilization Survey, hospitals transfused over 11 million blood components in 2023, evidence of the important role that hospitals play in blood utilization and, therefore, blood collection.
Blood Collection Market Regional Insights
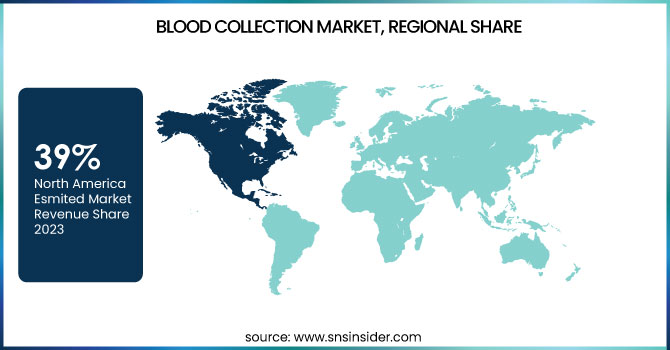
In 2023, North America held the largest share of the blood collection market, accounting for 39% of the market share. North America accounted for the largest revenue share due to the advanced healthcare infrastructure in the region, high healthcare spending, and increasing burden of chronic diseases. U.S. healthcare expenditure amounted to USD 4.3 trillion (18.3% of GDP, 2023), according to the Centers for Medicare & Medicaid Services. In addition to that, major players in the market and the continuous development of technology also help in bolstering the leadership in the region. In the year 2023, various novel devices used for blood collection received approval from the U.S. Food and Drug Administration (FDA), improving the efficiency and safety of blood collection processes. Another major factor affecting the market growth is the National Institutes of Health (NIH) has invested significant funding in research on blood-based diagnostics.
The rapid growth of the Asia Pacific region can be attributed to improving healthcare infrastructure, increasing healthcare expenditure, and large patient population. Countries from China to India are rapidly building their healthcare capabilities, according to the World Health Organization. China's spending on healthcare rose 12% in 2023, to $1.1 trillion. The high growth of the regional economies and government efforts to strengthen healthcare services have fueled the growth of the blood collection devices market in the region. The rising prevalence of chronic diseases in the Asia Pacific region also requires more routine blood testing. The International Diabetes Federation, which estimates that diabetes will affect 153 million adults in the region in 2025, up from 88 million in 2023, is working with the pharmaceutical company on an awareness program. This growing disease burden is anticipated to considerably increase the adoption of blood collection market over the years.
Get Customized Report as per Your Business Requirement - Enquiry Now
List of Key Players in Blood Collection Market
-
Becton, Dickinson and Company (BD) (Vacutainer Blood Collection Tubes, BD Vacutainer Safety-Lok Blood Collection Set)
-
Terumo Corporation (VENOJECT Blood Collection Tube, Surshield Safety Winged Blood Collection Set)
-
Greiner Bio-One International GmbH (VACUETTE Blood Collection Tubes, VACUETTE Safety Blood Collection Set)
-
Sarstedt AG & Co. KG (S-Monovette Blood Collection System, Safety-Multifly Winged Needle Set)
-
Nipro Medical Corporation (VACUETTE Blood Collection Tubes, Nipro SafeTouch Blood Collection Needle)
-
F.L. Medical S.r.l. (Blood Collection Tubes, Blood Collection Needles)
-
Improve Medical Instruments Co., Ltd. (Vacuum Blood Collection Tubes, Safety Blood Collection Needles)
-
Sekisui Medical Co., Ltd. (Venous Blood Collection Tubes, Blood Collection Needles)
-
Medtronic plc (Minimed 770G Insulin Pump System, Guardian Sensor 3)
-
Haemonetics Corporation (NexSys PCS Plasma Collection System, MCS+ 9000 Blood Collection System)
-
Fresenius Kabi AG (CompoGuard Blood Component Separator, CompoMat G5 Automated Blood Component Separator)
-
Macopharma SA (Blood Collection Bags, Leucolab LCG2 Leukocyte Reduction Filters)
-
B. Braun Melsungen AG (Vasofix Safety IV Catheters, Introcan Safety IV Catheters)
-
Smiths Medical (Jelco Safety IV Catheters, ViaValve Safety IV Catheters)
-
Retractable Technologies, Inc. (VanishPoint Blood Collection Set, VanishPoint Blood Collection Tube Holder)
-
Cardinal Health (Monoject Blood Collection Tubes, Monoject Blood Collection Needles)
-
Thermo Fisher Scientific Inc. (Nunc Serum Vials, Samco Blood Collection Tubes)
-
Abbott Laboratories (Cell-Dyn Hematology Analyzers, i-STAT Handheld Blood Analyzer)
-
Roche Diagnostics (Accu-Chek Blood Glucose Monitoring Systems, Cobas Blood Gas Analyzers)
-
Masimo Corporation (Rad-97 Pulse CO-Oximeter, Pronto Noninvasive Hemoglobin Monitor)
Recent Developments
-
In Jan 2025, Becton, Dickinson and Company (BD) launched a new blood collection tube line to improve sample quality and minimize the need for redraws. The company said this tube had improved sample stability by 15% over earlier models.
-
In April 2024, Streck introduced Protein Plus BCT, a whole blood collection tube that stabilizes plasma proteins over a range of concentrations without refrigeration. Intended for research use only and not for diagnostics.
| Report Attributes | Details |
|---|---|
| Market Size in 2023 | USD 3.39 Billion |
| Market Size by 2032 | USD 7.25 Billion |
| CAGR | CAGR of 8.84% From 2024 to 2032 |
| Base Year | 2023 |
| Forecast Period | 2024-2032 |
| Historical Data | 2020-2022 |
| Report Scope & Coverage | Market Size, Segments Analysis, Competitive Landscape, Regional Analysis, DROC & SWOT Analysis, Forecast Outlook |
| Key Segments | • By Collection Site (Venous, Capillary) • By Method (Manual Blood Collection, Automated Blood Collection) • By Application (Diagnostics, Treatment) • By End Use (Hospitals, Emergency Departments, Diagnostics Centers, Blood Banks, Others) |
| Regional Analysis/Coverage | North America (US, Canada, Mexico), Europe (Eastern Europe [Poland, Romania, Hungary, Turkey, Rest of Eastern Europe] Western Europe] Germany, France, UK, Italy, Spain, Netherlands, Switzerland, Austria, Rest of Western Europe]), Asia Pacific (China, India, Japan, South Korea, Vietnam, Singapore, Australia, Rest of Asia Pacific), Middle East & Africa (Middle East [UAE, Egypt, Saudi Arabia, Qatar, Rest of Middle East], Africa [Nigeria, South Africa, Rest of Africa], Latin America (Brazil, Argentina, Colombia, Rest of Latin America) |
| Company Profiles | Becton, Dickinson and Company (BD), Terumo Corporation, Greiner Bio-One International GmbH, Sarstedt AG & Co. KG, Nipro Medical Corporation, F.L. Medical S.r.l., Improve Medical Instruments Co., Ltd., Sekisui Medical Co., Ltd., Medtronic plc, Haemonetics Corporation, Fresenius Kabi AG, Macopharma SA, B. Braun Melsungen AG, Smiths Medical, Retractable Technologies, Inc., Cardinal Health, Thermo Fisher Scientific Inc., Abbott Laboratories, Roche Diagnostics, Masimo Corporation. |
