Get E-PDF Sample Report on Biosurfactants Market - Request Sample Report
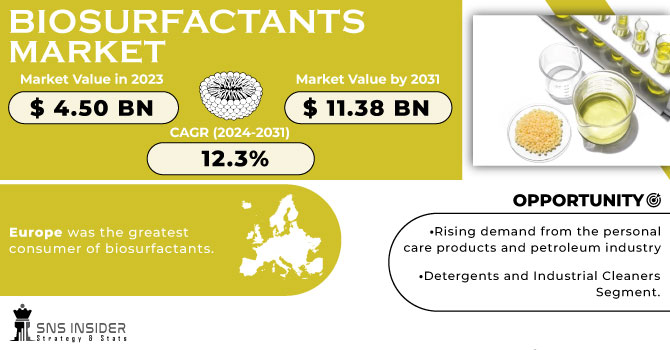
The Biosurfactants Market Size was valued at USD 3.85 Billion in 2023 and is expected to reach USD 6.82 Billion by 2032, growing at a CAGR of 6.57% over the forecast period of 2024-2032.
The biosurfactants market is expanding rapidly as industries seek sustainable and biodegradable alternatives to conventional surfactants. Our report explores raw material analysis, assessing key feedstocks like vegetable oils and microbial sources, along with their availability and cost trends. A detailed cost structure analysis highlights production expenses, including fermentation and energy consumption, shaping market pricing. Investment and funding trends showcase venture capital inflows and government initiatives accelerating innovation. With a strong focus on sustainability and environmental impact, the report evaluates biodegradability, carbon footprint, and regulatory incentives driving adoption. Additionally, an in-depth demand-supply gap analysis identifies production constraints and emerging opportunities, offering a strategic outlook on market potential. This comprehensive study provides key insights into biosurfactant industry dynamics.
Drivers
Increasing Utilization of Biosurfactants in Oil Spill Remediation Enhances Market Growth
The growing frequency of oil spills and industrial waste discharge has intensified the demand for effective and eco-friendly cleanup solutions, boosting the adoption of biosurfactants in oil spill remediation. These naturally derived surfactants possess superior emulsification and dispersion properties, making them highly efficient in breaking down hydrocarbons and enhancing microbial degradation. Unlike synthetic surfactants, biosurfactants are biodegradable and non-toxic, aligning with stringent environmental regulations imposed by governments and global agencies. The oil and gas industry is actively seeking sustainable alternatives for spill management, further driving the market demand. Additionally, biosurfactants exhibit high surface activity even at low concentrations, reducing the amount required for effective remediation. Advancements in biotechnology are improving production efficiency, making biosurfactants more commercially viable for large-scale environmental applications. As awareness regarding their effectiveness increases, biosurfactants are expected to become an integral part of oil spill mitigation strategies. With ongoing research and collaborations between environmental organizations and biosurfactant manufacturers, the market is poised for substantial growth, offering long-term sustainability benefits.
Restraints
High Production Costs and Complex Fermentation Processes Limit Commercial Viability
Despite their environmental benefits, biosurfactants face significant challenges in terms of high production costs and complex fermentation processes. The microbial fermentation required for biosurfactant synthesis is resource-intensive, requiring precise control of parameters such as pH, temperature, and nutrient supply. Additionally, the downstream purification process is costly, adding to the overall expense of production. Unlike synthetic surfactants, which can be mass-produced using cost-effective chemical synthesis, biosurfactants require specialized bioreactors and fermentation facilities, increasing capital investments. The use of expensive raw materials, such as refined oils and sugars, further contributes to high production costs. Although research efforts are focused on optimizing biosurfactant production through genetic engineering and process modifications, scalability remains a key limitation. The market adoption of biosurfactants is significantly hindered in price-sensitive industries such as household cleaning and industrial detergents, where cost competitiveness is a primary factor. Until production technologies advance further to achieve cost parity with synthetic surfactants, the high expenses associated with biosurfactant manufacturing will continue to restrain market growth.
Opportunities
Rising Demand for Biosurfactants in Sustainable Nanotechnology Applications Expands Market Scope
The integration of biosurfactants into nanotechnology applications is creating new opportunities across various industries, including pharmaceuticals, cosmetics, and environmental remediation. Biosurfactants are being explored as natural stabilizing agents in nanoparticle synthesis, enhancing the dispersion, solubility, and bioavailability of active ingredients. Their ability to self-assemble into nanostructures makes them valuable in drug delivery systems, allowing for targeted and controlled release of therapeutic compounds. In the cosmetics industry, biosurfactant-stabilized nanocarriers are being used to improve the delivery of active ingredients in skincare and haircare formulations. Additionally, biosurfactants are gaining attention in green nanotechnology by facilitating environmentally friendly nanoparticle synthesis, reducing the use of toxic chemicals. Researchers are also investigating their potential in wastewater treatment and soil remediation, where biosurfactant-functionalized nanomaterials can enhance contaminant removal efficiency. As nanotechnology continues to revolutionize multiple sectors, the demand for biosurfactants in these innovative applications is expected to rise, offering lucrative growth opportunities for manufacturers and research institutions.
Challenge
Regulatory and Certification Complexities Pose Barriers to Biosurfactant Commercialization
The commercialization of biosurfactants is hindered by stringent regulatory requirements and complex certification processes. Regulatory agencies impose strict guidelines on microbial strains used in biosurfactant production, necessitating extensive safety and efficacy testing. Additionally, the certification process for labeling biosurfactants as “biodegradable,” “organic,” or “eco-friendly” varies across regions, leading to inconsistencies in market regulations. Compliance with diverse regulatory frameworks increases both the time and cost required for product approvals, limiting new entrants in the market. The lack of globally harmonized standards further complicates international trade, making it challenging for manufacturers to expand their market reach. Until clearer regulatory pathways are established and certification processes are streamlined, biosurfactant commercialization will face delays and additional costs.
By Product
Glycolipids dominated the Biosurfactant Market in 2023 with a market share of 38.9%. Within this category, Sophorolipids emerged as the leading subsegment, accounting for approximately 22.5% of the Glycolipids market. Sophorolipids have gained prominence due to their superior emulsification properties, biodegradability, and lower toxicity, making them a preferred choice in industries such as detergents, personal care, and bioremediation. Companies like Evonik and Saraya Co., Ltd. have been actively investing in the large-scale production of sophorolipids due to their increasing application in eco-friendly cleaning products. Additionally, the European Chemicals Agency (ECHA) has been promoting biosurfactants, encouraging manufacturers to replace synthetic surfactants with sustainable alternatives like sophorolipids. With rising environmental concerns and stringent regulations by organizations like the Environmental Protection Agency (EPA) on petroleum-based surfactants, sophorolipids continue to gain traction in various industrial applications.
By Application
Household Detergents & Cleaning Products dominated the Biosurfactant Market in 2023 with a market share of 28.5%. This segment’s growth is fueled by the increasing consumer demand for sustainable and non-toxic cleaning products, driven by regulatory policies and environmental concerns. Governments across Europe and North America are promoting green chemistry initiatives, compelling detergent manufacturers like Ecover and Unilever to adopt biosurfactants in their formulations. The European Union’s ban on phosphates in detergents has further accelerated the shift toward biosurfactants, as they provide comparable or superior cleaning efficacy while being environmentally friendly. Additionally, organizations such as the Roundtable on Sustainable Palm Oil (RSPO) are advocating for bio-based surfactants, further boosting the demand for biosurfactants in household cleaning applications.
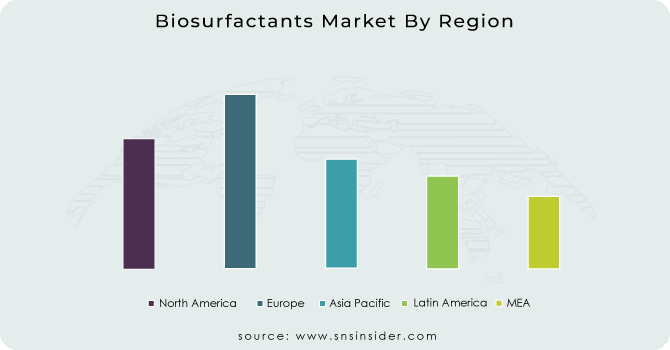
Europe dominated the Biosurfactant Market in 2023 with a market share of 42.3%. This dominance is driven by stringent environmental regulations, increasing consumer awareness, and strong industrial adoption of biosurfactants in personal care, household cleaning, and food industries. The European Chemicals Agency (ECHA) and REACH (Registration, Evaluation, Authorisation, and Restriction of Chemicals) regulations have significantly reduced the use of synthetic surfactants, encouraging manufacturers to shift toward bio-based alternatives. Germany is the leading country in the region due to its well-established chemical industry and strong investment in sustainable surfactant production, with companies like Evonik Industries and BASF SE leading biosurfactant innovation. France and the Netherlands are also key players, with heavy investment in sustainable consumer goods and partnerships with biosurfactant manufacturers. The European Union’s push for carbon neutrality by 2050 and incentives for bio-based products have further accelerated biosurfactant adoption, ensuring Europe’s continued dominance in the market.
On the other hand, North America emerged as the fastest-growing region in the Biosurfactant Market, projected to grow at a significant growth rate during the forecast period. The increasing demand for eco-friendly detergents, personal care products, and bioremediation solutions is fueling market growth, driven by the rising awareness of sustainable alternatives and regulatory support. The United States is the leading country in this growth, with companies like Locus Bio-Energy, Stepan Company, and Logos Technologies heavily investing in biosurfactant production. The Environmental Protection Agency (EPA) and U.S. Department of Agriculture (USDA) are promoting bio-based chemicals, providing tax incentives for sustainable surfactants. Additionally, the Canadian government has launched green chemistry initiatives to encourage industries to adopt biosurfactants in cleaning and industrial applications. The rising trend of green consumerism, coupled with stringent regulations on synthetic surfactants, is accelerating the market expansion in North America, positioning it as the fastest-growing region in the industry.
Get Customized Report as Per Your Business Requirement - Request For Customized Report
Key Players
AGAE Technologies LLC (Rhamnolipids)
Allied Carbon Solutions Co., Ltd. (Sophorolipids, Mannosylerythritol Lipids)
Biotensidon GmbH (Rhamnolipids, Lipopeptides)
Conagen Inc. (Sophorolipids, Custom Fermentation-Based Biosurfactants)
EcoSynthetix (Bio-based Emulsifiers, Starch-based Surfactants)
GlycoSurf LLC (Glycolipid Biosurfactants, Green Surfactants)
Holiferm Limited (Sophorolipids, Fermentation-Based Biosurfactants)
Jeneil Biotech, Inc. (Sophorolipids, Rhamnolipids)
Kaneka Corporation (Sophorolipids, Biodegradable Surfactants)
Locus Bio-Energy Solutions (Glycolipid Biosurfactants, Microbial Surfactants)
Logos Technologies (Stepan Company) (Glycolipids, Fermentation-Derived Surfactants)
Mango Materials (Biopolymer-based Surfactants, Fermentation-Derived Biosurfactants)
Rhamnolipid Inc. (Rhamnolipids, Glycolipid-Based Surfactants)
Saraya Co., Ltd. (Sophorolipids, Glycolipid Biosurfactants)
Synthezyme LLC (Custom Biosurfactants, Fermentation-Based Surfactants)
TeeGene Biotech (Glycolipids, Rhamnolipids)
TensioGreen (Rhamnolipids, Sophorolipids)
Terranol (Sophorolipids, Biodegradable Surfactants)
WHEATOLEO (Sugar-Based Biosurfactants, Green Surfactants)
Wheatoleo (Alkyl Polyglucosides, Sugar-Based Surfactants)
Recent Developments
October 2024: Belgian startup AmphiStar launched AmphiCare and AmphiClean, the first biosurfactants made entirely from organic waste and side streams. These products offer biodegradable alternatives for personal and home care markets, aligning with circular economy principles.
September 2024: Evonik introduced TEGO Wet 570 Terra and TEGO Wet 580 Terra, biosurfactants derived from natural resources for coatings and inks. These products provide excellent pigment wetting and are compliant with EU Ecolabel standards.
July 2024: Holiferm partnered with Green Pyramid to conduct formulation trials using Holiferm's biosurfactants. This collaboration aimed to develop sustainable products for the personal care and household cleaning sectors.
March 2024: McDermott achieved mechanical completion of a pioneering biosurfactants project, marking a significant milestone in sustainable chemical production. This project underscores McDermott's commitment to advancing environmentally friendly technologies.
Report Attributes | Details |
---|---|
Market Size in 2023 | USD 3.85 Billion |
Market Size by 2032 | USD 6.82 Billion |
CAGR | CAGR of 6.57% From 2024 to 2032 |
Base Year | 2023 |
Forecast Period | 2024-2032 |
Historical Data | 2020-2022 |
Report Scope & Coverage | Market Size, Segments Analysis, Competitive Landscape, Regional Analysis, DROC & SWOT Analysis, Forecast Outlook |
Key Segments | •By Product (Glycolipids [Rhamnolipids, Trehalolipids, Sophorolipids], Lipopeptides & Lipoproteins [Surfactin, Lechenysin], Phospholipids & Fatty Acids, Polymeric Biosurfactants, Particulate Biosurfactants, Others) •By Application (Household Detergents & Cleaning Products, Industrial & Institutional Cleaners, Personal Care & Cosmetics, Agriculture & Agrochemicals, Oilfield Chemicals & Petroleum Industry, Food Processing & Beverages, Pharmaceuticals & Healthcare, Textiles & Leather Processing, Environmental Bioremediation & Waste Treatment, Others) |
Regional Analysis/Coverage | North America (US, Canada, Mexico), Europe (Eastern Europe [Poland, Romania, Hungary, Turkey, Rest of Eastern Europe] Western Europe] Germany, France, UK, Italy, Spain, Netherlands, Switzerland, Austria, Rest of Western Europe]), Asia Pacific (China, India, Japan, South Korea, Vietnam, Singapore, Australia, Rest of Asia Pacific), Middle East & Africa (Middle East [UAE, Egypt, Saudi Arabia, Qatar, Rest of Middle East], Africa [Nigeria, South Africa, Rest of Africa], Latin America (Brazil, Argentina, Colombia, Rest of Latin America) |
Company Profiles | Jeneil Biotech, Inc., Saraya Co., Ltd., Allied Carbon Solutions Co., Ltd., Holiferm Limited, Biotensidon GmbH, AGAE Technologies LLC, GlycoSurf LLC, Logos Technologies (Stepan Company), Synthezyme LLC, TeeGene Biotech and other key players |
Ans: The Biosurfactants Market was valued at USD 3.85 billion in 2023.
Ans: The Biosurfactants Market is projected to reach USD 6.82 billion by 2032, growing at a CAGR of 6.57%.
Ans: The increasing use of biosurfactants in oil spill remediation is boosting the Biosurfactants Market.
Ans: The rising demand for biosurfactants in sustainable nanotechnology applications is expanding the Biosurfactants Market.
Ans: North America is the fastest-growing region in the Biosurfactants Market due to rising demand for eco-friendly products.
Table of Content
1. Introduction
1.1 Market Definition
1.2 Scope (Inclusion and Exclusions)
1.3 Research Assumptions
2. Executive Summary
2.1 Market Overview
2.2 Regional Synopsis
2.3 Competitive Summary
3. Research Methodology
3.1 Top-Down Approach
3.2 Bottom-up Approach
3.3. Data Validation
3.4 Primary Interviews
4. Market Dynamics Impact Analysis
4.1 Market Driving Factors Analysis
4.1.2 Drivers
4.1.2 Restraints
4.1.3 Opportunities
4.1.4 Challenges
4.2 PESTLE Analysis
4.3 Porter’s Five Forces Model
5. Statistical Insights and Trends Reporting
5.1 Raw Material Analysis
5.2 Cost Structure Analysis
5.3 Investment and Funding Trends
5.4 Sustainability and Environmental Impact Analysis
5.5 Demand-Supply Gap Analysis
6. Competitive Landscape
6.1 List of Major Companies, By Region
6.2 Market Share Analysis, By Region
6.3 Product Benchmarking
6.3.1 Product specifications and features
6.3.2 Pricing
6.4 Strategic Initiatives
6.4.1 Marketing and promotional activities
6.4.2 Distribution and supply chain strategies
6.4.3 Expansion plans and new product launches
6.4.4 Strategic partnerships and collaborations
6.5 Technological Advancements
6.6 Market Positioning and Branding
7. Epoxy Adhesives Market Segmentation, by Product
7.1 Chapter Overview
7.2 Glycolipids
7.2.1 Glycolipids Market Trends Analysis (2020-2032)
7.2.2 Glycolipids Market Size Estimates and Forecasts to 2032 (USD Billion)
7.2.3 Rhamnolipids
7.2.3.1 Rhamnolipids Market Trends Analysis (2020-2032)
7.2.3.2 Rhamnolipids Market Size Estimates and Forecasts to 2032 (USD Billion)
7.2.4 Trehalolipids
7.2.4.1 Trehalolipids Market Trends Analysis (2020-2032)
7.2.4.2 Trehalolipids Market Size Estimates and Forecasts to 2032 (USD Billion)
7.2.5 Sophorolipids
7.2.5.1 Sophorolipids Market Trends Analysis (2020-2032)
7.2.5.2 Sophorolipids Market Size Estimates and Forecasts to 2032 (USD Billion)
7.3 Lipopeptides & Lipoproteins
7.3.1 Lipopeptides & Lipoproteins Market Trends Analysis (2020-2032)
7.3.2 Lipopeptides & Lipoproteins Market Size Estimates and Forecasts to 2032 (USD Billion)
7.3.3 Surfactin
7.3.3.1 Surfactin Market Trends Analysis (2020-2032)
7.3.3.2 Surfactin Market Size Estimates and Forecasts to 2032 (USD Billion)
7.3.4 Lechenysin
7.3.4.1 Lechenysin Market Trends Analysis (2020-2032)
7.3.4.2 Lechenysin Market Size Estimates and Forecasts to 2032 (USD Billion)
7.4 Phospholipids & Fatty Acids
7.4.1 Phospholipids & Fatty Acids Market Trends Analysis (2020-2032)
7.4.2 Phospholipids & Fatty Acids Market Size Estimates and Forecasts to 2032 (USD Billion)
7.5 Polymeric Biosurfactants
7.5.1 Polymeric Biosurfactants Market Trends Analysis (2020-2032)
7.5.2 Polymeric Biosurfactants Market Size Estimates and Forecasts to 2032 (USD Billion)
7.6 Particulate Biosurfactants
7.6.1 Particulate Biosurfactants Market Trends Analysis (2020-2032)
7.6.2 Particulate Biosurfactants Market Size Estimates and Forecasts to 2032 (USD Billion)
7.7 Others
7.7.1 Others Market Trends Analysis (2020-2032)
7.7.2 Others Market Size Estimates and Forecasts to 2032 (USD Billion)
8. Epoxy Adhesives Market Segmentation, by Application
8.1 Chapter Overview
8.2 Household Detergents & Cleaning Products
8.2.1 Household Detergents & Cleaning Products Market Trends Analysis (2020-2032)
8.2.2 Household Detergents & Cleaning Products Market Size Estimates and Forecasts to 2032 (USD Billion)
8.3 Industrial & Institutional Cleaners
8.3.1 Industrial & Institutional Cleaners Market Trends Analysis (2020-2032)
8.3.2 Industrial & Institutional Cleaners Market Size Estimates and Forecasts to 2032 (USD Billion)
8.4 Personal Care & Cosmetics
8.4.1 Personal Care & Cosmetics Market Trends Analysis (2020-2032)
8.4.2 Personal Care & Cosmetics Market Size Estimates and Forecasts to 2032 (USD Billion)
8.5 Agriculture & Agrochemicals
8.5.1 Agriculture & Agrochemicals Market Trends Analysis (2020-2032)
8.5.2 Agriculture & Agrochemicals Market Size Estimates and Forecasts to 2032 (USD Billion)
8.6 Oilfield Chemicals & Petroleum Industry
8.6.1 Oilfield Chemicals & Petroleum Industry Market Trends Analysis (2020-2032)
8.6.2 Oilfield Chemicals & Petroleum Industry Market Size Estimates and Forecasts to 2032 (USD Billion)
8.7 Food Processing & Beverages
8.7.1 Food Processing & Beverages Market Trends Analysis (2020-2032)
8.7.2 Food Processing & Beverages Market Size Estimates and Forecasts to 2032 (USD Billion)
8.8 Pharmaceuticals & Healthcare
8.8.1 Pharmaceuticals & Healthcare Market Trends Analysis (2020-2032)
8.8.2 Pharmaceuticals & Healthcare Market Size Estimates and Forecasts to 2032 (USD Billion)
8.9 Textiles & Leather Processing
8.9.1 Textiles & Leather Processing Market Trends Analysis (2020-2032)
8.9.2 Textiles & Leather Processing Market Size Estimates and Forecasts to 2032 (USD Billion)
8.10 Environmental Bioremediation & Waste Treatment
8.10.1 Environmental Bioremediation & Waste Treatment Market Trends Analysis (2020-2032)
8.10.2 Environmental Bioremediation & Waste Treatment Market Size Estimates and Forecasts to 2032 (USD Billion)
8.11 Others
8.11.1 Others Market Trends Analysis (2020-2032)
8.11.2 Others Market Size Estimates and Forecasts to 2032 (USD Billion)
9. Regional Analysis
9.1 Chapter Overview
9.2 North America
9.2.1 Trends Analysis
9.2.2 North America Epoxy Adhesives Market Estimates and Forecasts, by Country (2020-2032) (USD Billion)
9.2.3 North America Epoxy Adhesives Market Estimates and Forecasts, by Product (2020-2032) (USD Billion)
9.2.4 North America Epoxy Adhesives Market Estimates and Forecasts, by Application (2020-2032) (USD Billion)
9.2.5 USA
9.2.5.1 USA Epoxy Adhesives Market Estimates and Forecasts, by Product (2020-2032) (USD Billion)
9.2.5.2 USA Epoxy Adhesives Market Estimates and Forecasts, by Application (2020-2032) (USD Billion)
9.2.6 Canada
9.2.6.1 Canada Epoxy Adhesives Market Estimates and Forecasts, by Product (2020-2032) (USD Billion)
9.2.6.2 Canada Epoxy Adhesives Market Estimates and Forecasts, by Application (2020-2032) (USD Billion)
9.2.7 Mexico
9.2.7.1 Mexico Epoxy Adhesives Market Estimates and Forecasts, by Product (2020-2032) (USD Billion)
9.2.7.2 Mexico Epoxy Adhesives Market Estimates and Forecasts, by Application (2020-2032) (USD Billion)
9.3 Europe
9.3.1 Eastern Europe
9.3.1.1 Trends Analysis
9.3.1.2 Eastern Europe Epoxy Adhesives Market Estimates and Forecasts, by Country (2020-2032) (USD Billion)
9.3.1.3 Eastern Europe Epoxy Adhesives Market Estimates and Forecasts, by Product (2020-2032) (USD Billion)
9.3.1.4 Eastern Europe Epoxy Adhesives Market Estimates and Forecasts, by Application (2020-2032) (USD Billion)
9.3.1.5 Poland
9.3.1.5.1 Poland Epoxy Adhesives Market Estimates and Forecasts, by Product (2020-2032) (USD Billion)
9.3.1.5.2 Poland Epoxy Adhesives Market Estimates and Forecasts, by Application (2020-2032) (USD Billion)
9.3.1.6 Romania
9.3.1.6.1 Romania Epoxy Adhesives Market Estimates and Forecasts, by Product (2020-2032) (USD Billion)
9.3.1.6.2 Romania Epoxy Adhesives Market Estimates and Forecasts, by Application (2020-2032) (USD Billion)
9.3.1.7 Hungary
9.3.1.7.1 Hungary Epoxy Adhesives Market Estimates and Forecasts, by Product (2020-2032) (USD Billion)
9.3.1.7.2 Hungary Epoxy Adhesives Market Estimates and Forecasts, by Application (2020-2032) (USD Billion)
9.3.1.8 Turkey
9.3.1.8.1 Turkey Epoxy Adhesives Market Estimates and Forecasts, by Product (2020-2032) (USD Billion)
9.3.1.8.2 Turkey Epoxy Adhesives Market Estimates and Forecasts, by Application (2020-2032) (USD Billion)
9.3.1.9 Rest of Eastern Europe
9.3.1.9.1 Rest of Eastern Europe Epoxy Adhesives Market Estimates and Forecasts, by Product (2020-2032) (USD Billion)
9.3.1.9.2 Rest of Eastern Europe Epoxy Adhesives Market Estimates and Forecasts, by Application (2020-2032) (USD Billion)
9.3.2 Western Europe
9.3.2.1 Trends Analysis
9.3.2.2 Western Europe Epoxy Adhesives Market Estimates and Forecasts, by Country (2020-2032) (USD Billion)
9.3.2.3 Western Europe Epoxy Adhesives Market Estimates and Forecasts, by Product (2020-2032) (USD Billion)
9.3.2.4 Western Europe Epoxy Adhesives Market Estimates and Forecasts, by Application (2020-2032) (USD Billion)
9.3.2.5 Germany
9.3.2.5.1 Germany Epoxy Adhesives Market Estimates and Forecasts, by Product (2020-2032) (USD Billion)
9.3.2.5.2 Germany Epoxy Adhesives Market Estimates and Forecasts, by Application (2020-2032) (USD Billion)
9.3.2.6 France
9.3.2.6.1 France Epoxy Adhesives Market Estimates and Forecasts, by Product (2020-2032) (USD Billion)
9.3.2.6.2 France Epoxy Adhesives Market Estimates and Forecasts, by Application (2020-2032) (USD Billion)
9.3.2.7 UK
9.3.2.7.1 UK Epoxy Adhesives Market Estimates and Forecasts, by Product (2020-2032) (USD Billion)
9.3.2.7.2 UK Epoxy Adhesives Market Estimates and Forecasts, by Application (2020-2032) (USD Billion)
9.3.2.8 Italy
9.3.2.8.1 Italy Epoxy Adhesives Market Estimates and Forecasts, by Product (2020-2032) (USD Billion)
9.3.2.8.2 Italy Epoxy Adhesives Market Estimates and Forecasts, by Application (2020-2032) (USD Billion)
9.3.2.9 Spain
9.3.2.9.1 Spain Epoxy Adhesives Market Estimates and Forecasts, by Product (2020-2032) (USD Billion)
9.3.2.9.2 Spain Epoxy Adhesives Market Estimates and Forecasts, by Application (2020-2032) (USD Billion)
9.3.2.10 Netherlands
9.3.2.10.1 Netherlands Epoxy Adhesives Market Estimates and Forecasts, by Product (2020-2032) (USD Billion)
9.3.2.10.2 Netherlands Epoxy Adhesives Market Estimates and Forecasts, by Application (2020-2032) (USD Billion)
9.3.2.11 Switzerland
9.3.2.11.1 Switzerland Epoxy Adhesives Market Estimates and Forecasts, by Product (2020-2032) (USD Billion)
9.3.2.11.2 Switzerland Epoxy Adhesives Market Estimates and Forecasts, by Application (2020-2032) (USD Billion)
9.3.2.12 Austria
9.3.2.12.1 Austria Epoxy Adhesives Market Estimates and Forecasts, by Product (2020-2032) (USD Billion)
9.3.2.12.2 Austria Epoxy Adhesives Market Estimates and Forecasts, by Application (2020-2032) (USD Billion)
9.3.2.13 Rest of Western Europe
9.3.2.13.1 Rest of Western Europe Epoxy Adhesives Market Estimates and Forecasts, by Product (2020-2032) (USD Billion)
9.3.2.13.2 Rest of Western Europe Epoxy Adhesives Market Estimates and Forecasts, by Application (2020-2032) (USD Billion)
9.4 Asia Pacific
9.4.1 Trends Analysis
9.4.2 Asia Pacific Epoxy Adhesives Market Estimates and Forecasts, by Country (2020-2032) (USD Billion)
9.4.3 Asia Pacific Epoxy Adhesives Market Estimates and Forecasts, by Product (2020-2032) (USD Billion)
9.4.4 Asia Pacific Epoxy Adhesives Market Estimates and Forecasts, by Application (2020-2032) (USD Billion)
9.4.5 China
9.4.5.1 China Epoxy Adhesives Market Estimates and Forecasts, by Product (2020-2032) (USD Billion)
9.4.5.2 China Epoxy Adhesives Market Estimates and Forecasts, by Application (2020-2032) (USD Billion)
9.4.6 India
9.4.5.1 India Epoxy Adhesives Market Estimates and Forecasts, by Product (2020-2032) (USD Billion)
9.4.5.2 India Epoxy Adhesives Market Estimates and Forecasts, by Application (2020-2032) (USD Billion)
9.4.5 Japan
9.4.5.1 Japan Epoxy Adhesives Market Estimates and Forecasts, by Product (2020-2032) (USD Billion)
9.4.5.2 Japan Epoxy Adhesives Market Estimates and Forecasts, by Application (2020-2032) (USD Billion)
9.4.6 South Korea
9.4.6.1 South Korea Epoxy Adhesives Market Estimates and Forecasts, by Product (2020-2032) (USD Billion)
9.4.6.2 South Korea Epoxy Adhesives Market Estimates and Forecasts, by Application (2020-2032) (USD Billion)
9.4.7 Vietnam
9.4.7.1 Vietnam Epoxy Adhesives Market Estimates and Forecasts, by Product (2020-2032) (USD Billion)
9.2.7.2 Vietnam Epoxy Adhesives Market Estimates and Forecasts, by Application (2020-2032) (USD Billion)
9.4.8 Singapore
9.4.8.1 Singapore Epoxy Adhesives Market Estimates and Forecasts, by Product (2020-2032) (USD Billion)
9.4.8.2 Singapore Epoxy Adhesives Market Estimates and Forecasts, by Application (2020-2032) (USD Billion)
9.4.9 Australia
9.4.9.1 Australia Epoxy Adhesives Market Estimates and Forecasts, by Product (2020-2032) (USD Billion)
9.4.9.2 Australia Epoxy Adhesives Market Estimates and Forecasts, by Application (2020-2032) (USD Billion)
9.4.10 Rest of Asia Pacific
9.4.10.1 Rest of Asia Pacific Epoxy Adhesives Market Estimates and Forecasts, by Product (2020-2032) (USD Billion)
9.4.10.2 Rest of Asia Pacific Epoxy Adhesives Market Estimates and Forecasts, by Application (2020-2032) (USD Billion)
9.5 Middle East and Africa
9.5.1 Middle East
9.5.1.1 Trends Analysis
9.5.1.2 Middle East Epoxy Adhesives Market Estimates and Forecasts, by Country (2020-2032) (USD Billion)
9.5.1.3 Middle East Epoxy Adhesives Market Estimates and Forecasts, by Product (2020-2032) (USD Billion)
9.5.1.4 Middle East Epoxy Adhesives Market Estimates and Forecasts, by Application (2020-2032) (USD Billion)
9.5.1.5 UAE
9.5.1.5.1 UAE Epoxy Adhesives Market Estimates and Forecasts, by Product (2020-2032) (USD Billion)
9.5.1.5.2 UAE Epoxy Adhesives Market Estimates and Forecasts, by Application (2020-2032) (USD Billion)
9.5.1.6 Egypt
9.5.1.6.1 Egypt Epoxy Adhesives Market Estimates and Forecasts, by Product (2020-2032) (USD Billion)
9.5.1.6.2 Egypt Epoxy Adhesives Market Estimates and Forecasts, by Application (2020-2032) (USD Billion)
9.5.1.7 Saudi Arabia
9.5.1.7.1 Saudi Arabia Epoxy Adhesives Market Estimates and Forecasts, by Product (2020-2032) (USD Billion)
9.5.1.7.2 Saudi Arabia Epoxy Adhesives Market Estimates and Forecasts, by Application (2020-2032) (USD Billion)
9.5.1.8 Qatar
9.5.1.8.1 Qatar Epoxy Adhesives Market Estimates and Forecasts, by Product (2020-2032) (USD Billion)
9.5.1.8.2 Qatar Epoxy Adhesives Market Estimates and Forecasts, by Application (2020-2032) (USD Billion)
9.5.1.9 Rest of Middle East
9.5.1.9.1 Rest of Middle East Epoxy Adhesives Market Estimates and Forecasts, by Product (2020-2032) (USD Billion)
9.5.1.9.2 Rest of Middle East Epoxy Adhesives Market Estimates and Forecasts, by Application (2020-2032) (USD Billion)
9.5.2 Africa
9.5.2.1 Trends Analysis
9.5.2.2 Africa Epoxy Adhesives Market Estimates and Forecasts, by Country (2020-2032) (USD Billion)
9.5.2.3 Africa Epoxy Adhesives Market Estimates and Forecasts, by Product (2020-2032) (USD Billion)
9.5.2.4 Africa Epoxy Adhesives Market Estimates and Forecasts, by Application (2020-2032) (USD Billion)
9.5.2.5 South Africa
9.5.2.5.1 South Africa Epoxy Adhesives Market Estimates and Forecasts, by Product (2020-2032) (USD Billion)
9.5.2.5.2 South Africa Epoxy Adhesives Market Estimates and Forecasts, by Application (2020-2032) (USD Billion)
9.5.2.6 Nigeria
9.5.2.6.1 Nigeria Epoxy Adhesives Market Estimates and Forecasts, by Product (2020-2032) (USD Billion)
9.5.2.6.2 Nigeria Epoxy Adhesives Market Estimates and Forecasts, by Application (2020-2032) (USD Billion)
9.5.2.7 Rest of Africa
9.5.2.7.1 Rest of Africa Epoxy Adhesives Market Estimates and Forecasts, by Product (2020-2032) (USD Billion)
9.5.2.7.2 Rest of Africa Epoxy Adhesives Market Estimates and Forecasts, by Application (2020-2032) (USD Billion)
9.6 Latin America
9.6.1 Trends Analysis
9.6.2 Latin America Epoxy Adhesives Market Estimates and Forecasts, by Country (2020-2032) (USD Billion)
9.6.3 Latin America Epoxy Adhesives Market Estimates and Forecasts, by Product (2020-2032) (USD Billion)
9.6.4 Latin America Epoxy Adhesives Market Estimates and Forecasts, by Application (2020-2032) (USD Billion)
9.6.5 Brazil
9.6.5.1 Brazil Epoxy Adhesives Market Estimates and Forecasts, by Product (2020-2032) (USD Billion)
9.6.5.2 Brazil Epoxy Adhesives Market Estimates and Forecasts, by Application (2020-2032) (USD Billion)
9.6.6 Argentina
9.6.6.1 Argentina Epoxy Adhesives Market Estimates and Forecasts, by Product (2020-2032) (USD Billion)
9.6.6.2 Argentina Epoxy Adhesives Market Estimates and Forecasts, by Application (2020-2032) (USD Billion)
9.6.7 Colombia
9.6.7.1 Colombia Epoxy Adhesives Market Estimates and Forecasts, by Product (2020-2032) (USD Billion)
9.6.7.2 Colombia Epoxy Adhesives Market Estimates and Forecasts, by Application (2020-2032) (USD Billion)
9.6.8 Rest of Latin America
9.6.8.1 Rest of Latin America Epoxy Adhesives Market Estimates and Forecasts, by Product (2020-2032) (USD Billion)
9.6.8.2 Rest of Latin America Epoxy Adhesives Market Estimates and Forecasts, by Application (2020-2032) (USD Billion)
10. Company Profiles
10.1 Jeneil Biotech, Inc.
10.1.1 Company Overview
10.1.2 Financial
10.1.3 Products/ Services Offered
110.1.4 SWOT Analysis
10.2 Saraya Co., Ltd.
10.2.1 Company Overview
10.2.2 Financial
10.2.3 Products/ Services Offered
10.2.4 SWOT Analysis
10.3 Allied Carbon Solutions Co., Ltd.
10.3.1 Company Overview
10.3.2 Financial
10.3.3 Products/ Services Offered
10.3.4 SWOT Analysis
10.4 Holiferm Limited
10.4.1 Company Overview
10.4.2 Financial
10.4.3 Products/ Services Offered
10.4.4 SWOT Analysis
10.5 Biotensidon GmbH
10.5.1 Company Overview
10.5.2 Financial
10.5.3 Products/ Services Offered
10.5.4 SWOT Analysis
10.6 AGAE Technologies LLC
10.6.1 Company Overview
10.6.2 Financial
10.6.3 Products/ Services Offered
10.6.4 SWOT Analysis
10.7 GlycoSurf LLC
10.7.1 Company Overview
10.7.2 Financial
10.7.3 Products/ Services Offered
10.7.4 SWOT Analysis
10.8 Logos Technologies (Stepan Company)
10.8.1 Company Overview
10.8.2 Financial
10.8.3 Products/ Services Offered
10.8.4 SWOT Analysis
10.9 Synthezyme LLC
10.9.1 Company Overview
10.9.2 Financial
10.9.3 Products/ Services Offered
10.9.4 SWOT Analysis
10.10 TeeGene Biotech
10.9.1 Company Overview
10.9.2 Financial
10.9.3 Products/ Services Offered
10.9.4 SWOT Analysis
11. Use Cases and Best Practices
12. Conclusion
An accurate research report requires proper strategizing as well as implementation. There are multiple factors involved in the completion of good and accurate research report and selecting the best methodology to compete the research is the toughest part. Since the research reports we provide play a crucial role in any company’s decision-making process, therefore we at SNS Insider always believe that we should choose the best method which gives us results closer to reality. This allows us to reach at a stage wherein we can provide our clients best and accurate investment to output ratio.
Each report that we prepare takes a timeframe of 350-400 business hours for production. Starting from the selection of titles through a couple of in-depth brain storming session to the final QC process before uploading our titles on our website we dedicate around 350 working hours. The titles are selected based on their current market cap and the foreseen CAGR and growth.
The 5 steps process:
Step 1: Secondary Research:
Secondary Research or Desk Research is as the name suggests is a research process wherein, we collect data through the readily available information. In this process we use various paid and unpaid databases which our team has access to and gather data through the same. This includes examining of listed companies’ annual reports, Journals, SEC filling etc. Apart from this our team has access to various associations across the globe across different industries. Lastly, we have exchange relationships with various university as well as individual libraries.
Step 2: Primary Research
When we talk about primary research, it is a type of study in which the researchers collect relevant data samples directly, rather than relying on previously collected data. This type of research is focused on gaining content specific facts that can be sued to solve specific problems. Since the collected data is fresh and first hand therefore it makes the study more accurate and genuine.
We at SNS Insider have divided Primary Research into 2 parts.
Part 1 wherein we interview the KOLs of major players as well as the upcoming ones across various geographic regions. This allows us to have their view over the market scenario and acts as an important tool to come closer to the accurate market numbers. As many as 45 paid and unpaid primary interviews are taken from both the demand and supply side of the industry to make sure we land at an accurate judgement and analysis of the market.
This step involves the triangulation of data wherein our team analyses the interview transcripts, online survey responses and observation of on filed participants. The below mentioned chart should give a better understanding of the part 1 of the primary interview.
Part 2: In this part of primary research the data collected via secondary research and the part 1 of the primary research is validated with the interviews from individual consultants and subject matter experts.
Consultants are those set of people who have at least 12 years of experience and expertise within the industry whereas Subject Matter Experts are those with at least 15 years of experience behind their back within the same space. The data with the help of two main processes i.e., FGDs (Focused Group Discussions) and IDs (Individual Discussions). This gives us a 3rd party nonbiased primary view of the market scenario making it a more dependable one while collation of the data pointers.
Step 3: Data Bank Validation
Once all the information is collected via primary and secondary sources, we run that information for data validation. At our intelligence centre our research heads track a lot of information related to the market which includes the quarterly reports, the daily stock prices, and other relevant information. Our data bank server gets updated every fortnight and that is how the information which we collected using our primary and secondary information is revalidated in real time.
Step 4: QA/QC Process
After all the data collection and validation our team does a final level of quality check and quality assurance to get rid of any unwanted or undesired mistakes. This might include but not limited to getting rid of the any typos, duplication of numbers or missing of any important information. The people involved in this process include technical content writers, research heads and graphics people. Once this process is completed the title gets uploader on our platform for our clients to read it.
Step 5: Final QC/QA Process:
This is the last process and comes when the client has ordered the study. In this process a final QA/QC is done before the study is emailed to the client. Since we believe in giving our clients a good experience of our research studies, therefore, to make sure that we do not lack at our end in any way humanly possible we do a final round of quality check and then dispatch the study to the client.
Key Segments:
By Product
Glycolipids
Rhamnolipids
Trehalolipids
Sophorolipids
Lipopeptides & Lipoproteins
Surfactin
Lechenysin
Phospholipids & Fatty Acids
Polymeric Biosurfactants
Particulate Biosurfactants
Others
By Application
Household Detergents & Cleaning Products
Industrial & Institutional Cleaners
Personal Care & Cosmetics
Agriculture & Agrochemicals
Oilfield Chemicals & Petroleum Industry
Food Processing & Beverages
Pharmaceuticals & Healthcare
Textiles & Leather Processing
Environmental Bioremediation & Waste Treatment
Others
Request for Segment Customization as per your Business Requirement: Segment Customization Request
Regional Coverage:
North America
US
Canada
Mexico
Europe
Eastern Europe
Poland
Romania
Hungary
Turkey
Rest of Eastern Europe
Western Europe
Germany
France
UK
Italy
Spain
Netherlands
Switzerland
Austria
Rest of Western Europe
Asia Pacific
China
India
Japan
South Korea
Vietnam
Singapore
Australia
Rest of Asia Pacific
Middle East & Africa
Middle East
UAE
Egypt
Saudi Arabia
Qatar
Rest of Middle East
Africa
Nigeria
South Africa
Rest of Africa
Latin America
Brazil
Argentina
Colombia
Rest of Latin America
Request for Country Level Research Report: Country Level Customization Request
Available Customization
With the given market data, SNS Insider offers customization as per the company’s specific needs. The following customization options are available for the report:
Detailed Volume Analysis
Criss-Cross segment analysis (e.g. Product X Application)
Competitive Product Benchmarking
Geographic Analysis
Additional countries in any of the regions
Customized Data Representation
Detailed analysis and profiling of additional market players
The Powder Coatings Market Size was valued at USD 15.6 billion in 2023, and is expected to reach USD 24.5 billion by 2032, and grow at a CAGR of 5.1% over the forecast period 2024-2032.
Nanofiltration Membranes Market size was valued at USD 1.1 billion in 2023 and is expected to reach USD 2.6 billion by 2032, at a CAGR of 10.1% from 2024-2032.
The Conformal Coatings Market size was valued at USD 1.02 billion in 2023. It is expected to grow to USD 1.68 billion by 2032 and grow at a CAGR of 5.70% over the forecast period of 2024-2032.
The Lithium Mining Market size was valued at USD 11 billion in 2023 and is expected to reach USD 17.9 by 2032 at a CAGR of 5.56% during the forecast period of 2024-2032.
The Cyclopentane Market Size was valued at USD 360 million in 2023, and is expected to reach USD 573 million by 2032, and grow at a CAGR of 5.3% by 2024-2032.
The Advanced Glass Market was valued at USD 64.29 Billion in 2023 and is expected to reach USD 127.10 Billion by 2032, growing at a CAGR of 7.89% by 2024-2032.
Hi! Click one of our member below to chat on Phone