Get more information on Bioresorbable Polymers Market - Request Sample Report
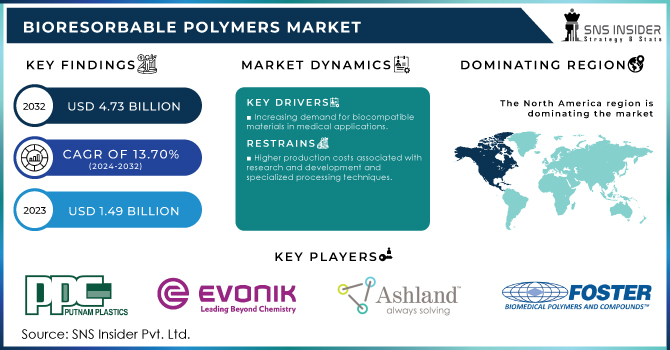
The Bioresorbable Polymers Market Size was valued at USD 1.49 billion in 2023 and is expected to reach USD 4.73 billion by 2032 and grow at a CAGR of 13.70% over the forecast period 2024-2032.
The bioresorbable polymers market is experiencing significant growth, driven by advancements in medical technology and an increasing preference for materials that naturally decompose within the body, eliminating the need for surgical removal. These polymers are extensively utilized in orthopedic devices and drug delivery systems, offering benefits such as reduced post-surgical complications and enhanced patient compliance. Key factors propelling market dynamics include technological innovations, rising healthcare expenditures, and growing demand for minimally invasive procedures. Strategic investments and developments from leading companies further support the industry's expansion.
In August 2024, Ashland completed the second expansion of its pharmaceutical injectables manufacturing and R&D lab at the National Science Park in Mullingar, Ireland. This enhancement significantly increased Ashland's capabilities in delivering innovative bioresorbable polymer chemistry to meet rising market demand. The project, supported by the Irish Government through IDA Ireland, underscores Ashland's commitment to advancing bioresorbable polymers for improved pharmaceuticals, medical devices, and tissue engineering solutions. In February 2020, Evonik announced the development of the world's first bioresorbable polymer in powder form suitable for high-resolution 3D printing of implantable medical devices using Selective Laser Sintering (SLS) technology. This innovation enabled the production of customized, patient-specific implants with enhanced precision and functionality. Such developments by industry leaders highlight the dynamic nature of the bioresorbable polymers market and its pivotal role in the evolution of medical treatments and devices.
Drivers:
Increasing Applications of Bioresorbable Polymers in Medical Devices Propel Market Expansion
Bioresorbable polymers are gaining traction in the medical device sector due to their unique properties, including biocompatibility and biodegradability. These materials are widely used in sutures, stents, drug delivery systems, and scaffolds for tissue engineering. As healthcare professionals seek alternatives to traditional materials, which can lead to complications and the need for additional surgeries, the adoption of bioresorbable polymers is becoming more prominent. The growing aging population and the rise in chronic diseases are also contributing to this trend, as there is an increasing demand for minimally invasive surgical techniques and materials that do not require removal after their intended purpose is fulfilled. This expansion in medical applications is expected to drive significant growth in the bioresorbable polymers market over the coming years.
Growing Awareness of Environmental Sustainability Fuels Interest in Bioresorbable Polymers
Rising Investment in Research and Development for Bioresorbable Polymers Sparks Market Opportunities
Increased investment in research and development (R&D) is playing a crucial role in advancing the bioresorbable polymers market. Governments, private investors, and academic institutions are allocating significant resources to explore new applications, improve existing materials, and develop novel formulations that enhance performance characteristics. This influx of funding is facilitating collaborations among various stakeholders, including researchers, manufacturers, and healthcare professionals, to accelerate the development of innovative bioresorbable products. The focus on R&D not only leads to the discovery of new applications across different sectors but also strengthens the overall market by addressing challenges related to material properties, such as strength, degradation rates, and compatibility with biological tissues. As a result, the bioresorbable polymers market is likely to experience substantial growth fueled by ongoing advancements and innovation.
Restraint:
Limited Awareness and Understanding of Bioresorbable Polymers Among End-Users Hinders Market Growth
Despite the numerous advantages of bioresorbable polymers, a significant barrier to their widespread adoption is the limited awareness and understanding among potential end-users. Many manufacturers and healthcare professionals may not be fully informed about the benefits and applications of these materials, which can lead to reluctance to transition from conventional options. This lack of knowledge can result in slower acceptance rates and the perpetuation of traditional materials that may not offer the same environmental and health benefits. Additionally, misunderstandings regarding the performance, safety, and regulatory compliance of bioresorbable polymers can deter potential users from integrating them into their products or practices. As education and awareness initiatives are essential for promoting the benefits of bioresorbable polymers, the industry must address this restraint to unlock the market's full potential.
Opportunity:
Growing Demand for Targeted Drug Delivery Systems Opens New Avenues for Bioresorbable Polymers
The healthcare sector's shift toward personalized medicine and targeted drug delivery systems is creating new avenues for bioresorbable polymers. These materials are particularly well-suited for applications in controlled drug release, where they can provide sustained therapeutic effects while minimizing side effects. By enabling precise delivery of medications to specific sites within the body, bioresorbable polymers can enhance the efficacy of treatments and improve patient outcomes. As researchers and pharmaceutical companies explore innovative drug delivery methods, the demand for bioresorbable polymers is expected to rise, leading to new product development and market expansion opportunities in this area.
Increased Focus on Biodegradable Packaging Solutions Drives Interest in Bioresorbable Polymers
The global movement toward sustainability has intensified interest in biodegradable packaging solutions, with bioresorbable polymers emerging as a promising alternative to traditional plastic packaging. As consumers demand environmentally friendly packaging options, manufacturers are exploring the potential of bioresorbable materials to meet this need. This trend is particularly pronounced in sectors such as food and pharmaceuticals, where the focus on reducing plastic waste is paramount. Companies that invest in developing bioresorbable packaging solutions can capitalize on this growing market demand, fostering innovation and sustainability while addressing environmental concerns. The bioresorbable polymers market is likely to benefit significantly from this focus on biodegradable packaging, opening new growth opportunities for manufacturers.
Supply Chain and Raw Material Sourcing for Bioresorbable Polymers Market
Aspect |
Description |
---|---|
Raw Material Sources |
Bioresorbable polymers are primarily sourced from natural, renewable materials such as polylactic acid (PLA), polyglycolic acid (PGA), and polycaprolactone (PCL). |
Supplier Network |
The supply chain includes suppliers of biopolymer raw materials, such as agricultural producers for PLA and PCL, and petrochemical companies for monomers. |
Sustainability in Sourcing |
Emphasis on sourcing materials from sustainable, renewable sources is increasing to meet environmental standards and reduce carbon footprints. |
Regional Supply Chain Differences |
Regions like North America and Europe are leading in biopolymer production, with strong supply chains in place, while emerging markets face raw material shortages. |
Logistical Challenges |
The bioresorbable polymer supply chain faces challenges such as transportation delays, high costs of raw material imports, and fluctuating prices of feedstocks. |
The supply chain for bioresorbable polymers is intricate, with raw materials primarily sourced from renewable resources such as plant-based sugars and polyesters. Key raw materials include PLA, PCL, and PGA, which are produced by both agricultural and petrochemical suppliers. Sustainability is a growing focus in the industry, as manufacturers aim to reduce their environmental impact by sourcing materials responsibly. However, supply chains can vary by region, with North America and Europe having well-established networks, while emerging markets often experience shortages and logistical challenges. Issues such as raw material price volatility and transportation disruptions further complicate the smooth flow of bioresorbable polymer production.
By Type
In 2023, Polylactic Acid (PLA) dominated the bioresorbable polymers market with a market share of approximately 45%. Among the subsegments, Poly (L-lactic) acid (PLLA) dominated with a market share of around 25%. PLA's widespread application in the medical field, particularly for sutures, drug delivery devices, and scaffolds, contributes significantly to its dominance. Its excellent biocompatibility and biodegradability make it a preferred choice for various medical applications. For instance, PLLA is often used in the development of biodegradable sutures and implants that gradually dissolve in the body, thus eliminating the need for surgical removal. The increasing demand for minimally invasive procedures and the focus on sustainability further bolster the PLA segment's growth, highlighting its importance in the evolving landscape of bioresorbable polymers.
By Application
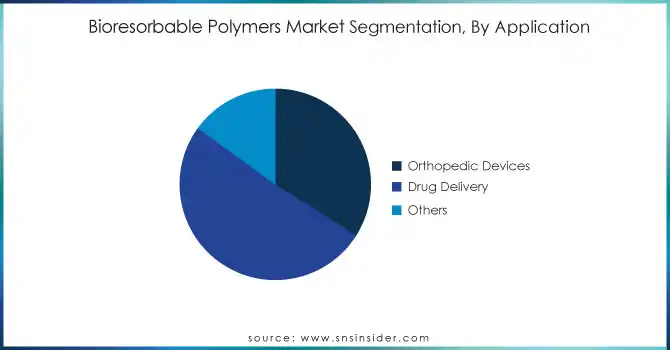
In 2023, the Drug Delivery application segment dominated the bioresorbable polymers market with a market share of around 50%. Within this segment, the parenteral drug delivery subsegment dominated with a market share of approximately 30%. The growing focus on targeted and controlled drug delivery systems is driving the demand for bioresorbable polymers, as they can provide sustained release of medications while minimizing side effects. For example, bioresorbable polymer-based nanoparticles are increasingly utilized for delivering chemotherapeutic agents directly to tumors, enhancing therapeutic efficacy and reducing systemic toxicity. The rise in chronic diseases and the need for effective drug delivery methods are expected to propel the growth of the drug delivery segment, further solidifying its position in the bioresorbable polymers market.
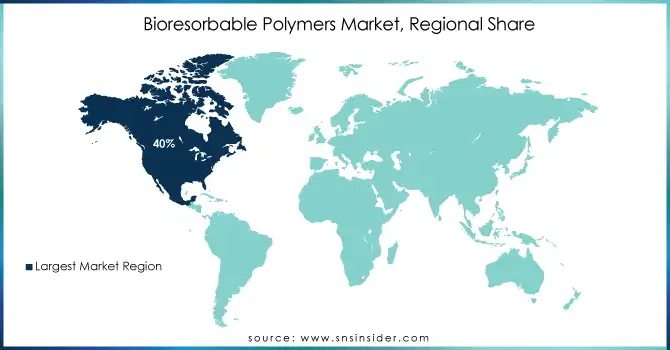
In 2023, North America dominated the bioresorbable polymers market with a market share of approximately 40%. The region's leadership can be attributed to advanced healthcare infrastructure, strong research and development activities, and increasing healthcare spending. The United States, in particular, accounted for the largest share due to its leading position in medical device manufacturing and the increasing demand for minimally invasive surgeries. For example, the widespread adoption of bioresorbable sutures and drug delivery systems in the U.S. has driven market growth. Companies like Medtronic and Baxter International are investing heavily in R&D to develop innovative products using bioresorbable polymers. The increasing preference for eco-friendly, biodegradable medical devices and the growing elderly population in North America further contribute to the dominance of this region. Additionally, the region benefits from a supportive regulatory environment, particularly through the FDA, which accelerates the approval process for new bioresorbable polymer-based products, making it a favorable market for innovation.
Moreover, In 2023, the Asia-Pacific (APAC) region emerged as the fastest-growing region in the bioresorbable polymers market with a CAGR of 8.5%. This rapid growth can be attributed to several factors, including the increasing healthcare needs in developing countries, the rising demand for sustainable medical solutions, and the growing trend of medical tourism. Countries like China and India are driving market expansion due to the increasing healthcare investments and their large populations, which present a significant demand for affordable medical solutions. For instance, China is one of the largest markets for bioresorbable polymers due to the increasing use of biodegradable sutures in surgeries. India, with its expanding healthcare sector and rising awareness about eco-friendly medical devices, is also contributing to the growth of this market. The government's initiatives to promote medical device manufacturing, combined with the growing middle-class population and increasing healthcare expenditures, are expected to sustain this growth. Moreover, advancements in the medical technology sector and increasing access to high-quality healthcare services are further bolstering the adoption of bioresorbable polymers in the region, making it a key market for future investments.
Get Customized Report as per your Business Requirement - Request For Customized Report
Recent Developments
August 2024: Ashland expanded its Viatel bioresorbable polymers lab in Mullingar, Ireland, with support from IDA Ireland. This facility will enhance the production of bioresorbable polymers for medical devices and pharmaceuticals, meeting the growing demand for sustainable medical solutions.
April 2024: Evonik expanded its RESOMER powder biomaterial facility in Germany, incorporating solvent-free micronization technology. This upgrade allows the production of customized medical powders, catering to implants and esthetic applications.
Key Players:
Ashland (Viatel bioresorbable polymers, RESOMER)
Corbion NV (PURASORB PL, PURASORB PDL)
DURECT Corporation (RESOMER PDLG, DURAVEC)
Evonik Industries AG (RESOMER polymers, VESTAKEEP PEEK)
Foster Corporation (BioFLEX, BioDUR)
Groupe PCAS (PCAS Bioresorbable Polymers, PCAS Biomaterials)
KLS Martin (BioResorb scaffold material, Biodegradable plates and screws)
Koninklijke DSM N.V (Synova, DSM Resomer)
Merck KGaA (Millipore Biofilter, BioResorb)
Poly-Med Inc. (PGA-based sutures, BioSYN)
Putnam Plastics (PGA-based tubing, Resilon polymers)
REVA Medical, Inc. (RevaBio, RevaCore)
Teijin Limited (Teijin Pharma bioresorbable polymer, Resilon)
Zhejiang Hisun Biomaterials Co., Ltd. (PLGA polymers, PGA resins)
Medtronic (Absorb bioresorbable scaffold, MEDSORB)
Abbott Laboratories (Absorb bioresorbable vascular scaffold, Bioresorb)
Biotronik (Bioabsorbable scaffold, PROBIO polymer)
Integra LifeSciences (Integra biocompatible tissue scaffolds, Integra dermal regeneration template)
Jinan Daigang Biomaterials Co., Ltd. (PCL biomaterials, PLGA polymers)
Solvay (Solef bioresorbable polymers, Solvay Biopolymer)
Report Attributes | Details |
---|---|
Market Size in 2023 | US$ 1.49 Billion |
Market Size by 2032 | US$ 4.73 Billion |
CAGR | CAGR of 13.70% From 2024 to 2032 |
Base Year | 2023 |
Forecast Period | 2024-2032 |
Historical Data | 2020-2022 |
Report Scope & Coverage | Market Size, Segments Analysis, Competitive Landscape, Regional Analysis, DROC & SWOT Analysis, Forecast Outlook |
Key Segments | •By Type (Polylactic Acid (PLA), [Poly (l-lactic) acid (PLLA), Poly-d,l-lactic acid (PDLLA)], Polysaccharides, Proteins, Polyglycolic Acid (PGA), Poly (Lactic-Co-Glycolic Acid) (PLGA), Polycaprolactone (PCL), Others) •By Application (Orthopedic Devices [Trauma, Knee, Sports injury, Hip, Spine, Others], Drug Delivery [Oral, Parenteral, Others], Others) |
Regional Analysis/Coverage | North America (US, Canada, Mexico), Europe (Eastern Europe [Poland, Romania, Hungary, Turkey, Rest of Eastern Europe] Western Europe] Germany, France, UK, Italy, Spain, Netherlands, Switzerland, Austria, Rest of Western Europe]), Asia Pacific (China, India, Japan, South Korea, Vietnam, Singapore, Australia, Rest of Asia Pacific), Middle East & Africa (Middle East [UAE, Egypt, Saudi Arabia, Qatar, Rest of Middle East], Africa [Nigeria, South Africa, Rest of Africa], Latin America (Brazil, Argentina, Colombia, Rest of Latin America) |
Company Profiles | Putnam Plastics, Evonik Industries AG, Ashland, DURECT CORPORATION, REVA Medical, Inc., Poly-Med Inc., Merck KGaA, KLS Martin, Corbion NV, Koninklijke DSM N.V, Foster Corporation., Groupe PCAS and other key players |
Key Drivers | •Growing Awareness of Environmental Sustainability Fuels Interest in Bioresorbable Polymers •Rising Investment in Research and Development for Bioresorbable Polymers Sparks Market Opportunities |
Restraints | •Limited Awareness and Understanding of Bioresorbable Polymers Among End-Users Hinders Market Growth |
Ans. The Bioresorbable Polymers Market is expected to grow at a CAGR of 13.70%
Ans: The Bioresorbable Polymers Market Size was valued at USD 1.49 billion in 2023 and is expected to reach USD 4.73 billion by 2032
Ans: North America dominates the bioresorbable polymers market with a 40% share, supported by advanced healthcare, strong R&D, and high demand for minimally invasive surgeries, while regulatory support and eco-friendly trends further contribute to its market leadership.
Ans: In emerging markets, improving healthcare, rising incomes, and sustainability concerns are driving demand for bioresorbable polymers, with increased interest in targeted drug delivery and biodegradable packaging creating growth opportunities for businesses.
Ans: Regulatory complexities and evolving approval processes for bioresorbable polymers can delay product development, deter investment, and slow market growth, as manufacturers must meet stringent safety and efficacy standards.
Table of Contents:
1. Introduction
1.1 Market Definition
1.2 Scope (Inclusion and Exclusions)
1.3 Research Assumptions
2. Executive Summary
2.1 Market Overview
2.2 Regional Synopsis
2.3 Competitive Summary
3. Research Methodology
3.1 Top-Down Approach
3.2 Bottom-up Approach
3.3. Data Validation
3.4 Primary Interviews
4. Market Dynamics Impact Analysis
4.1 Market Driving Factors Analysis
4.1.2 Drivers
4.1.2 Restraints
4.1.3 Opportunities
4.1.4 Challenges
4.2 PESTLE Analysis
4.3 Porter’s Five Forces Model
5. Statistical Insights and Trends Reporting
5.1 Production Capacity and Utilization, 2023
5.2 Sustainability and Environmental Impact, 2023
5.3 Regulatory Impact, by Country, by Region, 2023
5.4 Supply Chain and Raw Material Sourcing, 2023
5.5 Innovation and R&D, 2023
6. Competitive Landscape
6.1 List of Major Companies, By Region
6.2 Market Share Analysis, By Region
6.3 Product Benchmarking
6.3.1 Product specifications and features
6.3.2 Pricing
6.4 Strategic Initiatives
6.4.1 Marketing and promotional activities
6.4.2 Distribution and supply chain strategies
6.4.3 Expansion plans and new product launches
6.4.4 Strategic partnerships and collaborations
6.5 Technological Advancements
6.6 Market Positioning and Branding
7. Epoxy Adhesives Market Segmentation, by Type
7.1 Chapter Overview
7.2 Polylactic Acid (PLA)
7.2.1 Polylactic Acid (PLA) Market Trends Analysis (2020-2032)
7.2.2 Polylactic Acid (PLA) Market Size Estimates and Forecasts to 2032 (USD Billion)
7.2.Poly (l-lactic) acid (PLLA)
7.2.3.1 Poly (l-lactic) acid (PLLA) Market Trends Analysis (2020-2032)
7.2.3.2 Poly (l-lactic) acid (PLLA) Market Size Estimates and Forecasts to 2032 (USD Billion)
7.2.Poly-d,l-lactic acid (PDLLA)
7.2.4.1 Poly-d,l-lactic acid (PDLLA)Market Trends Analysis (2020-2032)
7.2.4.2 Poly-d,l-lactic acid (PDLLA) Market Size Estimates and Forecasts to 2032 (USD Billion)
7.3 Polysaccharides
7.3.1 Polysaccharides Market Trends Analysis (2020-2032)
7.3.2 Polysaccharides Market Size Estimates and Forecasts to 2032 (USD Billion)
7.4 Proteins
7.4.1 Proteins Market Trends Analysis (2020-2032)
7.4.2 Proteins Market Size Estimates and Forecasts to 2032 (USD Billion)
7.5 Polyglycolic Acid (PGA)
7.5.1 Polyglycolic Acid (PGA) Market Trends Analysis (2020-2032)
7.5.2 Polyglycolic Acid (PGA) Market Size Estimates and Forecasts to 2032 (USD Billion)
7.6 Poly (Lactic-Co-Glycolic Acid) (PLGA)
7.6.1 Poly (Lactic-Co-Glycolic Acid) (PLGA) Market Trends Analysis (2020-2032)
7.6.2 Poly (Lactic-Co-Glycolic Acid) (PLGA) Market Size Estimates and Forecasts to 2032 (USD Billion)
7.7 Polycaprolactone (PCL)
7.7.1 Polycaprolactone (PCL) Market Trends Analysis (2020-2032)
7.7.2 Polycaprolactone (PCL) Market Size Estimates and Forecasts to 2032 (USD Billion)
7.8 Others
7.8.1 Others Market Trends Analysis (2020-2032)
7.8.2 Others Market Size Estimates and Forecasts to 2032 (USD Billion)
8. Epoxy Adhesives Market Segmentation, by Application
8.1 Chapter Overview
8.2 Orthopedic Devices
8.2.1 Orthopedic Devices Market Trends Analysis (2020-2032)
8.2.2 Orthopedic Devices Market Size Estimates and Forecasts to 2032 (USD Billion)
8.2.3 Trauma
8.2.3.1 Trauma Market Trends Analysis (2020-2032)
8.2.3.2 Trauma Market Size Estimates and Forecasts to 2032 (USD Billion)
8.2.4 Knee
8.2.4.1 Knee Market Trends Analysis (2020-2032)
8.2.4.2 Knee Market Size Estimates and Forecasts to 2032 (USD Billion)
8.2.5 Sports injury
8.2.5.1 Sports injury Market Trends Analysis (2020-2032)
8.2.5.2 Sports injury Market Size Estimates and Forecasts to 2032 (USD Billion)
8.2.6 Hip
8.2.6.1 Hip Market Trends Analysis (2020-2032)
8.2.6.2 Hip Market Size Estimates and Forecasts to 2032 (USD Billion)
8.2.7 Spine
8.2.7.1 Spine Market Trends Analysis (2020-2032)
8.2.7.2 Spine Market Size Estimates and Forecasts to 2032 (USD Billion)
8.2.8 Others
8.2.8.1 Others Market Trends Analysis (2020-2032)
8.2.8.2 Others Market Size Estimates and Forecasts to 2032 (USD Billion)
8.3 Drug Delivery
8.3.1 Drug Delivery Market Trends Analysis (2020-2032)
8.3.2 Drug Delivery Market Size Estimates and Forecasts to 2032 (USD Billion)
8.3.3 Oral
8.3.3.1 Oral Market Trends Analysis (2020-2032)
8.3.3.2 Oral Market Size Estimates and Forecasts to 2032 (USD Billion)
8.3.4 Parenteral
8.3.4.1 Parenteral Market Trends Analysis (2020-2032)
8.3.4.2 Parenteral Market Size Estimates and Forecasts to 2032 (USD Billion)
8.3.5 Others
8.3.5.1 Others Market Trends Analysis (2020-2032)
8.3.5.2 Others Market Size Estimates and Forecasts to 2032 (USD Billion)
8.4 Others
8.4.1 Others Market Trends Analysis (2020-2032)
8.4.2 Others Market Size Estimates and Forecasts to 2032 (USD Billion)
9. Regional Analysis
9.1 Chapter Overview
9.2 North America
9.2.1 Trends Analysis
9.2.2 North America Epoxy Adhesives Market Estimates and Forecasts, by Country (2020-2032) (USD Billion)
9.2.3 North America Epoxy Adhesives Market Estimates and Forecasts, by Type (2020-2032) (USD Billion)
9.2.4 North America Epoxy Adhesives Market Estimates and Forecasts, by Application (2020-2032) (USD Billion)
9.2.5 USA
9.2.5.1 USA Epoxy Adhesives Market Estimates and Forecasts, by Type (2020-2032) (USD Billion)
9.2.5.2 USA Epoxy Adhesives Market Estimates and Forecasts, by Application (2020-2032) (USD Billion)
9.2.6 Canada
9.2.6.1 Canada Epoxy Adhesives Market Estimates and Forecasts, by Type (2020-2032) (USD Billion)
9.2.6.2 Canada Epoxy Adhesives Market Estimates and Forecasts, by Application (2020-2032) (USD Billion)
9.2.7 Mexico
9.2.7.1 Mexico Epoxy Adhesives Market Estimates and Forecasts, by Type (2020-2032) (USD Billion)
9.2.7.2 Mexico Epoxy Adhesives Market Estimates and Forecasts, by Application (2020-2032) (USD Billion)
9.3 Europe
9.3.1 Eastern Europe
9.3.1.1 Trends Analysis
9.3.1.2 Eastern Europe Epoxy Adhesives Market Estimates and Forecasts, by Country (2020-2032) (USD Billion)
9.3.1.3 Eastern Europe Epoxy Adhesives Market Estimates and Forecasts, by Type (2020-2032) (USD Billion)
9.3.1.4 Eastern Europe Epoxy Adhesives Market Estimates and Forecasts, by Application (2020-2032) (USD Billion)
9.3.1.5 Poland
9.3.1.5.1 Poland Epoxy Adhesives Market Estimates and Forecasts, by Type (2020-2032) (USD Billion)
9.3.1.5.2 Poland Epoxy Adhesives Market Estimates and Forecasts, by Application (2020-2032) (USD Billion)
9.3.1.6 Romania
9.3.1.6.1 Romania Epoxy Adhesives Market Estimates and Forecasts, by Type (2020-2032) (USD Billion)
9.3.1.6.2 Romania Epoxy Adhesives Market Estimates and Forecasts, by Application (2020-2032) (USD Billion)
9.3.1.7 Hungary
9.3.1.7.1 Hungary Epoxy Adhesives Market Estimates and Forecasts, by Type (2020-2032) (USD Billion)
9.3.1.7.2 Hungary Epoxy Adhesives Market Estimates and Forecasts, by Application (2020-2032) (USD Billion)
9.3.1.8 Turkey
9.3.1.8.1 Turkey Epoxy Adhesives Market Estimates and Forecasts, by Type (2020-2032) (USD Billion)
9.3.1.8.2 Turkey Epoxy Adhesives Market Estimates and Forecasts, by Application (2020-2032) (USD Billion)
9.3.1.9 Rest of Eastern Europe
9.3.1.9.1 Rest of Eastern Europe Epoxy Adhesives Market Estimates and Forecasts, by Type (2020-2032) (USD Billion)
9.3.1.9.2 Rest of Eastern Europe Epoxy Adhesives Market Estimates and Forecasts, by Application (2020-2032) (USD Billion)
9.3.2 Western Europe
9.3.2.1 Trends Analysis
9.3.2.2 Western Europe Epoxy Adhesives Market Estimates and Forecasts, by Country (2020-2032) (USD Billion)
9.3.2.3 Western Europe Epoxy Adhesives Market Estimates and Forecasts, by Type (2020-2032) (USD Billion)
9.3.2.4 Western Europe Epoxy Adhesives Market Estimates and Forecasts, by Application (2020-2032) (USD Billion)
9.3.2.5 Germany
9.3.2.5.1 Germany Epoxy Adhesives Market Estimates and Forecasts, by Type (2020-2032) (USD Billion)
9.3.2.5.2 Germany Epoxy Adhesives Market Estimates and Forecasts, by Application (2020-2032) (USD Billion)
9.3.2.6 France
9.3.2.6.1 France Epoxy Adhesives Market Estimates and Forecasts, by Type (2020-2032) (USD Billion)
9.3.2.6.2 France Epoxy Adhesives Market Estimates and Forecasts, by Application (2020-2032) (USD Billion)
9.3.2.7 UK
9.3.2.7.1 UK Epoxy Adhesives Market Estimates and Forecasts, by Type (2020-2032) (USD Billion)
9.3.2.7.2 UK Epoxy Adhesives Market Estimates and Forecasts, by Application (2020-2032) (USD Billion)
9.3.2.8 Italy
9.3.2.8.1 Italy Epoxy Adhesives Market Estimates and Forecasts, by Type (2020-2032) (USD Billion)
9.3.2.8.2 Italy Epoxy Adhesives Market Estimates and Forecasts, by Application (2020-2032) (USD Billion)
9.3.2.9 Spain
9.3.2.9.1 Spain Epoxy Adhesives Market Estimates and Forecasts, by Type (2020-2032) (USD Billion)
9.3.2.9.2 Spain Epoxy Adhesives Market Estimates and Forecasts, by Application (2020-2032) (USD Billion)
9.3.2.10 Netherlands
9.3.2.10.1 Netherlands Epoxy Adhesives Market Estimates and Forecasts, by Type (2020-2032) (USD Billion)
9.3.2.10.2 Netherlands Epoxy Adhesives Market Estimates and Forecasts, by Application (2020-2032) (USD Billion)
9.3.2.11 Switzerland
9.3.2.11.1 Switzerland Epoxy Adhesives Market Estimates and Forecasts, by Type (2020-2032) (USD Billion)
9.3.2.11.2 Switzerland Epoxy Adhesives Market Estimates and Forecasts, by Application (2020-2032) (USD Billion)
9.3.2.12 Austria
9.3.2.12.1 Austria Epoxy Adhesives Market Estimates and Forecasts, by Type (2020-2032) (USD Billion)
9.3.2.12.2 Austria Epoxy Adhesives Market Estimates and Forecasts, by Application (2020-2032) (USD Billion)
9.3.2.13 Rest of Western Europe
9.3.2.13.1 Rest of Western Europe Epoxy Adhesives Market Estimates and Forecasts, by Type (2020-2032) (USD Billion)
9.3.2.13.2 Rest of Western Europe Epoxy Adhesives Market Estimates and Forecasts, by Application (2020-2032) (USD Billion)
9.4 Asia Pacific
9.4.1 Trends Analysis
9.4.2 Asia Pacific Epoxy Adhesives Market Estimates and Forecasts, by Country (2020-2032) (USD Billion)
9.4.3 Asia Pacific Epoxy Adhesives Market Estimates and Forecasts, by Type (2020-2032) (USD Billion)
9.4.4 Asia Pacific Epoxy Adhesives Market Estimates and Forecasts, by Application (2020-2032) (USD Billion)
9.4.5 China
9.4.5.1 China Epoxy Adhesives Market Estimates and Forecasts, by Type (2020-2032) (USD Billion)
9.4.5.2 China Epoxy Adhesives Market Estimates and Forecasts, by Application (2020-2032) (USD Billion)
9.4.6 India
9.4.5.1 India Epoxy Adhesives Market Estimates and Forecasts, by Type (2020-2032) (USD Billion)
9.4.5.2 India Epoxy Adhesives Market Estimates and Forecasts, by Application (2020-2032) (USD Billion)
9.4.5 Japan
9.4.5.1 Japan Epoxy Adhesives Market Estimates and Forecasts, by Type (2020-2032) (USD Billion)
9.4.5.2 Japan Epoxy Adhesives Market Estimates and Forecasts, by Application (2020-2032) (USD Billion)
9.4.6 South Korea
9.4.6.1 South Korea Epoxy Adhesives Market Estimates and Forecasts, by Type (2020-2032) (USD Billion)
9.4.6.2 South Korea Epoxy Adhesives Market Estimates and Forecasts, by Application (2020-2032) (USD Billion)
9.4.7 Vietnam
9.4.7.1 Vietnam Epoxy Adhesives Market Estimates and Forecasts, by Type (2020-2032) (USD Billion)
9.2.7.2 Vietnam Epoxy Adhesives Market Estimates and Forecasts, by Application (2020-2032) (USD Billion)
9.4.8 Singapore
9.4.8.1 Singapore Epoxy Adhesives Market Estimates and Forecasts, by Type (2020-2032) (USD Billion)
9.4.8.2 Singapore Epoxy Adhesives Market Estimates and Forecasts, by Application (2020-2032) (USD Billion)
9.4.9 Australia
9.4.9.1 Australia Epoxy Adhesives Market Estimates and Forecasts, by Type (2020-2032) (USD Billion)
9.4.9.2 Australia Epoxy Adhesives Market Estimates and Forecasts, by Application (2020-2032) (USD Billion)
9.4.10 Rest of Asia Pacific
9.4.10.1 Rest of Asia Pacific Epoxy Adhesives Market Estimates and Forecasts, by Type (2020-2032) (USD Billion)
9.4.10.2 Rest of Asia Pacific Epoxy Adhesives Market Estimates and Forecasts, by Application (2020-2032) (USD Billion)
9.5 Middle East and Africa
9.5.1 Middle East
9.5.1.1 Trends Analysis
9.5.1.2 Middle East Epoxy Adhesives Market Estimates and Forecasts, by Country (2020-2032) (USD Billion)
9.5.1.3 Middle East Epoxy Adhesives Market Estimates and Forecasts, by Type (2020-2032) (USD Billion)
9.5.1.4 Middle East Epoxy Adhesives Market Estimates and Forecasts, by Application (2020-2032) (USD Billion)
9.5.1.5 UAE
9.5.1.5.1 UAE Epoxy Adhesives Market Estimates and Forecasts, by Type (2020-2032) (USD Billion)
9.5.1.5.2 UAE Epoxy Adhesives Market Estimates and Forecasts, by Application (2020-2032) (USD Billion)
9.5.1.6 Egypt
9.5.1.6.1 Egypt Epoxy Adhesives Market Estimates and Forecasts, by Type (2020-2032) (USD Billion)
9.5.1.6.2 Egypt Epoxy Adhesives Market Estimates and Forecasts, by Application (2020-2032) (USD Billion)
9.5.1.7 Saudi Arabia
9.5.1.7.1 Saudi Arabia Epoxy Adhesives Market Estimates and Forecasts, by Type (2020-2032) (USD Billion)
9.5.1.7.2 Saudi Arabia Epoxy Adhesives Market Estimates and Forecasts, by Application (2020-2032) (USD Billion)
9.5.1.8 Qatar
9.5.1.8.1 Qatar Epoxy Adhesives Market Estimates and Forecasts, by Type (2020-2032) (USD Billion)
9.5.1.8.2 Qatar Epoxy Adhesives Market Estimates and Forecasts, by Application (2020-2032) (USD Billion)
9.5.1.9 Rest of Middle East
9.5.1.9.1 Rest of Middle East Epoxy Adhesives Market Estimates and Forecasts, by Type (2020-2032) (USD Billion)
9.5.1.9.2 Rest of Middle East Epoxy Adhesives Market Estimates and Forecasts, by Application (2020-2032) (USD Billion)
9.5.2 Africa
9.5.2.1 Trends Analysis
9.5.2.2 Africa Epoxy Adhesives Market Estimates and Forecasts, by Country (2020-2032) (USD Billion)
9.5.2.3 Africa Epoxy Adhesives Market Estimates and Forecasts, by Type (2020-2032) (USD Billion)
9.5.2.4 Africa Epoxy Adhesives Market Estimates and Forecasts, by Application (2020-2032) (USD Billion)
9.5.2.5 South Africa
9.5.2.5.1 South Africa Epoxy Adhesives Market Estimates and Forecasts, by Type (2020-2032) (USD Billion)
9.5.2.5.2 South Africa Epoxy Adhesives Market Estimates and Forecasts, by Application (2020-2032) (USD Billion)
9.5.2.6 Nigeria
9.5.2.6.1 Nigeria Epoxy Adhesives Market Estimates and Forecasts, by Type (2020-2032) (USD Billion)
9.5.2.6.2 Nigeria Epoxy Adhesives Market Estimates and Forecasts, by Application (2020-2032) (USD Billion)
9.5.2.7 Rest of Africa
9.5.2.7.1 Rest of Africa Epoxy Adhesives Market Estimates and Forecasts, by Type (2020-2032) (USD Billion)
9.5.2.7.2 Rest of Africa Epoxy Adhesives Market Estimates and Forecasts, by Application (2020-2032) (USD Billion)
9.6 Latin America
9.6.1 Trends Analysis
9.6.2 Latin America Epoxy Adhesives Market Estimates and Forecasts, by Country (2020-2032) (USD Billion)
9.6.3 Latin America Epoxy Adhesives Market Estimates and Forecasts, by Type (2020-2032) (USD Billion)
9.6.4 Latin America Epoxy Adhesives Market Estimates and Forecasts, by Application (2020-2032) (USD Billion)
9.6.5 Brazil
9.6.5.1 Brazil Epoxy Adhesives Market Estimates and Forecasts, by Type (2020-2032) (USD Billion)
9.6.5.2 Brazil Epoxy Adhesives Market Estimates and Forecasts, by Application (2020-2032) (USD Billion)
9.6.6 Argentina
9.6.6.1 Argentina Epoxy Adhesives Market Estimates and Forecasts, by Type (2020-2032) (USD Billion)
9.6.6.2 Argentina Epoxy Adhesives Market Estimates and Forecasts, by Application (2020-2032) (USD Billion)
9.6.7 Colombia
9.6.7.1 Colombia Epoxy Adhesives Market Estimates and Forecasts, by Type (2020-2032) (USD Billion)
9.6.7.2 Colombia Epoxy Adhesives Market Estimates and Forecasts, by Application (2020-2032) (USD Billion)
9.6.8 Rest of Latin America
9.6.8.1 Rest of Latin America Epoxy Adhesives Market Estimates and Forecasts, by Type (2020-2032) (USD Billion)
9.6.8.2 Rest of Latin America Epoxy Adhesives Market Estimates and Forecasts, by Application (2020-2032) (USD Billion)
10. Company Profiles
10.1 Putnam Plastics
10.1.1 Company Overview
10.1.2 Financial
10.1.3 Products/ Services Offered
110.1.4 SWOT Analysis
10.2 Evonik Industries AG
10.2.1 Company Overview
10.2.2 Financial
10.2.3 Products/ Services Offered
10.2.4 SWOT Analysis
10.3 Ashland
10.3.1 Company Overview
10.3.2 Financial
10.3.3 Products/ Services Offered
10.3.4 SWOT Analysis
10.4 DURECT CORPORATION
10.4.1 Company Overview
10.4.2 Financial
10.4.3 Products/ Services Offered
10.4.4 SWOT Analysis
10.5 REVA Medical, Inc.
10.5.1 Company Overview
10.5.2 Financial
10.5.3 Products/ Services Offered
10.5.4 SWOT Analysis
10.6 Poly-Med Inc.
10.6.1 Company Overview
10.6.2 Financial
10.6.3 Products/ Services Offered
10.6.4 SWOT Analysis
10.7 Merck KGaA
10.7.1 Company Overview
10.7.2 Financial
10.7.3 Products/ Services Offered
10.7.4 SWOT Analysis
10.8 KLS Martin
10.8.1 Company Overview
10.8.2 Financial
10.8.3 Products/ Services Offered
10.8.4 SWOT Analysis
10.9 Corbion NV
10.9.1 Company Overview
10.9.2 Financial
10.9.3 Products/ Services Offered
10.9.4 SWOT Analysis
10.10 Koninklijke DSM N.V
10.9.1 Company Overview
10.9.2 Financial
10.9.3 Products/ Services Offered
10.9.4 SWOT Analysis
11. Use Cases and Best Practices
12. Conclusion
An accurate research report requires proper strategizing as well as implementation. There are multiple factors involved in the completion of good and accurate research report and selecting the best methodology to compete the research is the toughest part. Since the research reports we provide play a crucial role in any company’s decision-making process, therefore we at SNS Insider always believe that we should choose the best method which gives us results closer to reality. This allows us to reach at a stage wherein we can provide our clients best and accurate investment to output ratio.
Each report that we prepare takes a timeframe of 350-400 business hours for production. Starting from the selection of titles through a couple of in-depth brain storming session to the final QC process before uploading our titles on our website we dedicate around 350 working hours. The titles are selected based on their current market cap and the foreseen CAGR and growth.
The 5 steps process:
Step 1: Secondary Research:
Secondary Research or Desk Research is as the name suggests is a research process wherein, we collect data through the readily available information. In this process we use various paid and unpaid databases which our team has access to and gather data through the same. This includes examining of listed companies’ annual reports, Journals, SEC filling etc. Apart from this our team has access to various associations across the globe across different industries. Lastly, we have exchange relationships with various university as well as individual libraries.
Step 2: Primary Research
When we talk about primary research, it is a type of study in which the researchers collect relevant data samples directly, rather than relying on previously collected data. This type of research is focused on gaining content specific facts that can be sued to solve specific problems. Since the collected data is fresh and first hand therefore it makes the study more accurate and genuine.
We at SNS Insider have divided Primary Research into 2 parts.
Part 1 wherein we interview the KOLs of major players as well as the upcoming ones across various geographic regions. This allows us to have their view over the market scenario and acts as an important tool to come closer to the accurate market numbers. As many as 45 paid and unpaid primary interviews are taken from both the demand and supply side of the industry to make sure we land at an accurate judgement and analysis of the market.
This step involves the triangulation of data wherein our team analyses the interview transcripts, online survey responses and observation of on filed participants. The below mentioned chart should give a better understanding of the part 1 of the primary interview.
Part 2: In this part of primary research the data collected via secondary research and the part 1 of the primary research is validated with the interviews from individual consultants and subject matter experts.
Consultants are those set of people who have at least 12 years of experience and expertise within the industry whereas Subject Matter Experts are those with at least 15 years of experience behind their back within the same space. The data with the help of two main processes i.e., FGDs (Focused Group Discussions) and IDs (Individual Discussions). This gives us a 3rd party nonbiased primary view of the market scenario making it a more dependable one while collation of the data pointers.
Step 3: Data Bank Validation
Once all the information is collected via primary and secondary sources, we run that information for data validation. At our intelligence centre our research heads track a lot of information related to the market which includes the quarterly reports, the daily stock prices, and other relevant information. Our data bank server gets updated every fortnight and that is how the information which we collected using our primary and secondary information is revalidated in real time.
Step 4: QA/QC Process
After all the data collection and validation our team does a final level of quality check and quality assurance to get rid of any unwanted or undesired mistakes. This might include but not limited to getting rid of the any typos, duplication of numbers or missing of any important information. The people involved in this process include technical content writers, research heads and graphics people. Once this process is completed the title gets uploader on our platform for our clients to read it.
Step 5: Final QC/QA Process:
This is the last process and comes when the client has ordered the study. In this process a final QA/QC is done before the study is emailed to the client. Since we believe in giving our clients a good experience of our research studies, therefore, to make sure that we do not lack at our end in any way humanly possible we do a final round of quality check and then dispatch the study to the client.
Key Segments:
By Type
Polylactic Acid (PLA)
Poly (l-lactic) acid (PLLA)
Poly-d,l-lactic acid (PDLLA)
Polysaccharides
Proteins
Polyglycolic Acid (PGA)
Poly (Lactic-Co-Glycolic Acid) (PLGA)
Polycaprolactone (PCL)
Others
By Application
Orthopedic Devices
Trauma
Knee
Sports injury
Hip
Spine
Others
Drug Delivery
Oral
Parenteral
Others
Others
Request for Segment Customization as per your Business Requirement: Segment Customization Request
Regional Coverage:
North America
US
Canada
Mexico
Europe
Eastern Europe
Poland
Romania
Hungary
Turkey
Rest of Eastern Europe
Western Europe
Germany
France
UK
Italy
Spain
Netherlands
Switzerland
Austria
Rest of Western Europe
Asia Pacific
China
India
Japan
South Korea
Vietnam
Singapore
Australia
Rest of Asia Pacific
Middle East & Africa
Middle East
UAE
Egypt
Saudi Arabia
Qatar
Rest of Middle East
Africa
Nigeria
South Africa
Rest of Africa
Latin America
Brazil
Argentina
Colombia
Rest of Latin America
Request for Country Level Research Report: Country Level Customization Request
Available Customization
With the given market data, SNS Insider offers customization as per the company’s specific needs. The following customization options are available for the report:
Product Analysis
Criss-Cross segment analysis (e.g. Product X Application)
Product Matrix which gives a detailed comparison of product portfolio of each company
Geographic Analysis
Additional countries in any of the regions
Company Information
Detailed analysis and profiling of additional market players (Up to five)
The Squalene Market size was valued at USD 150.26 million in 2023 and is expected to grow to USD 341.24 million by 2031 and grow at a CAGR of 10.8% over the forecast period of 2024-2031.
The Isoamyl Acetate Market size was valued at USD 366.8 Million in 2023. It is expected to grow to USD 605.05 Million by 2032 and grow at a CAGR of 5.7% over the forecast period of 2024-2032.
Medical Tubing Market was valued at USD 10.7 billion in 2023 and is expected to reach USD 21.8 billion by 2032 at a CAGR of 8.3% from 2024 to 2032.
The Textile Finishing Agents Market size was valued at USD 2.71 billion in 2023 and is expected to grow to USD 4.03 billion by 2031 and grow at a CAGR of 5.02% over the forecast period of 2024-2031.
The Packaging Barrier Films Market size was USD 18.1 billion in 2023 and is expected to reach USD 28.8 billion by 2032 and grow at a CAGR of 5.3% over the forecast period of 2024-2032.
The Adhesive Tapes Market Size was valued at USD 81.5 billion in 2023 and is expected to reach USD 134.6 billion by 2032 and grow at a CAGR of 5.8% over the forecast period 2024-2032.
Hi! Click one of our member below to chat on Phone