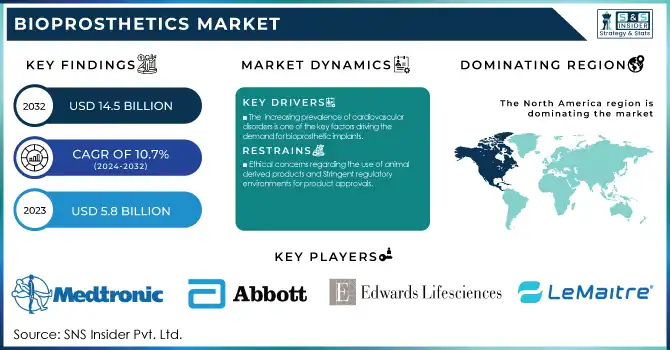
The Bioprosthetics Market Size was valued at USD 5.8 Billion in 2023 and is expected to reach USD 14.5 Billion by 2032, growing at a CAGR of 10.7% over the forecast period 2024-2032. This Report offers key insights into the growing demand for bioprosthetic implants driven by increasing incidences of cardiovascular and orthopedic conditions, as well as an aging population. The report includes regional device volumes, healthcare spending patterns and, regulatory compliance across major markets. It highlights advancements in materials and technology such as biocompatible devices and aimed at improving patient outcomes. Additionally, it examines adoption rates, market demand, and shifts in healthcare providers' preferences, providing a comprehensive overview of the bioprosthetics market and its future trajectory. The increased incidence rate of cardiovascular diseases, along with an aging population, is propelling the demand for bioprosthetic implants.
To get more information on Bioprosthetics Market - Request Free Sample Report
Drivers
The increasing prevalence of cardiovascular disorders is one of the key factors driving the demand for bioprosthetic implants.
The global burden of cardiovascular diseases (CVDs) is expected to increase dramatically during the period from 2025 to 2050. A 90.0% increase in cardiovascular prevalence is expected during this period, accompanied by a 73.4% increase in crude mortality and a 54.7% increase in crude disability-adjusted life years (DALYs). According to predictions, there will be 35.6 million cardiovascular deaths per year by 2050, compared to 20.5 million in 2025. Ischemic heart disease is expected to remain the leading cause of cardiovascular deaths, accounting for approximately 20 million deaths in 2050. It is anticipated that systolic blood pressure will be the leading cardiovascular risk factor responsible for 18.9 million deaths. These shocking statistics reflect the increasing demand for intervention, such as the use of bioprosthetic implants. For example, bioprosthetic valves appear to be effective at enhancing patient quality of life. In a recent study, an increase in quality of life was observed at 6 months and this was maintained at 1 year following bioprosthetic aortic valve replacement. Furthermore, the freedom from all-cause mortality at 1 year was 98.3% for patients under 60 years old receiving bioprosthetic aortic valve replacements.
Restrain
Ethical concerns regarding the use of animal-derived products and Stringent regulatory environments for product approvals.
The expansion of the market has been significantly restrained due to moral concerns regarding the usage of animal-derived products in bioprosthesis. Numerous patients, especially those with religious or moral dietary restrictions, request to know whether animal-derived products were used in their medical treatments. Rigorous regulatory frameworks for product approvals are another hurdle. Regulatory agencies are writing policies to advocate monitoring of potential animal welfare concerns in genetically engineered animals used in bioprosthetics. These laws and regulations seek to remedy ethical problems in the invasive nature of the techniques, high numbers of animals needed, unforeseen welfare issues, and moral bounds to genetic engineering.
Opportunity
Advancements in 3D printing technology for bioprosthetic development.
Advancements in 3D printing technology have revolutionized bioprosthetic development, offering unprecedented opportunities for personalized and efficient medical solutions. This technology enables the creation of intricate, patient-specific implants, prosthetics, and medical devices with high precision and customization. Studies performed in recent years have shown the potential of 3D-printed orthoses to enhance patient outcomes. A comparative study showed that patients have better quality of life while using 3D-printed orthoses when compared with conventional orthoses.
The technology has potential applications across many areas of medicine. For example, 3D-printed microporous scaffolds have been used to build bioprosthetic ovaries, which might one day be a possible option in reproductive medicine. In orthopedics, silver ion-coated 3D-printed implants were within the scale capable of decreasing local infection rates, and hydroxyapatite surface coatings accelerate osseointegration. In addition, this technology enables rapid prototyping and production, thereby shortening the time between a diagnosis and implantation considerably. This efficiency together with the freedom of design capabilities, and even the ability to use new types of biomaterials are driving innovation in prosthetics and orthopedic technology. As the technology continues to evolve, it promises to further enhance patient-specific treatments and improve overall healthcare outcomes.
Challenge
Intense competition from synthetic alternatives in the prosthetics market.
The bioprosthetics market faces significant challenges due to intense competition from synthetic alternatives. Such prosthetics can often be more cost-effective, have predictable quality, and be more durable. Recent technological advancements have further intensified this competition. Innovations in materials science and engineering have led to the development of synthetic prosthetics that aim to match or surpass the biocompatibility of bioprosthetics while offering improved durability and reduced need for replacement surgeries. For example, the incorporation of non-biodegradable scaffolds in hybrid tissue-engineered prostheses has enhanced durability and resistance properties over traditional bioprosthetic materials. In response, the manufacturers of bioprosthetics are seeking improved performance and durability from their offerings. There is ongoing investment into development of bioprosthetic materials to better withstand wear, and improving tissue engineering approaches.
By product
The allograft segment dominated the market and held around 68% share in 2023. The supremacy of allografts can be assigned to the multiple benefits offered by them like long-term stability, convenience of raw material availability, greater survival rate, lower manufacturing cost, and simple implantation process. This has rendered allografts the most popular of available bioprosthetics. The growth of the allograft segment is also boosted due to its application in creating customized 3D-printed implants and tissue repair applications. Also, the development of allograft technologies has heavily been influenced by national readiness for regenerative medicine research funding. The allograft segment has also indirectly benefited from some large research funded in some locations like NIH (National Institutes of Health) in the U.S. for tissue engineering and regenerative medicine. The xenograft segment is growing with the fastest CAGR over the forecast period. Rapid expansion in the particularly porcine-based devices, driven by continuing trials focused on enhancement of effectiveness and minimization of side effects associated with these implants.
By application
In 2023, the cardiovascular segment accounted for the largest revenue share of 81.0% of the market. The large market share is mainly owing to high prevalence of cardiovascular diseases worldwide and rising demand for heart valve replacement. Cardiovascular diseases are the number one cause of death globally, taking an estimated 17.9 million lives every year (World Health Organization (WHO). This shocking statistic demonstrates the urgent need for more cardiovascular treatments, such as bioprosthetic heart valves. This dominance of cardiovascular segment is further augmented by the increasing preference for bioprosthetic heart valves over mechanical valves in older patients owing to their lower thromboembolism risk as well as lesser long-term anticoagulation therapy requirement. Government initiatives to promote heart health awareness have also boosted the segment. Similarly, the U.S. Department of Health and Human Services's Million Hearts initiative, which began in 2012 and aims to prevent 1 million heart attacks and strokes by 2027, has an indirect impact on the bioprosthetics market, as it increases the demand for advanced cardiovascular treatment
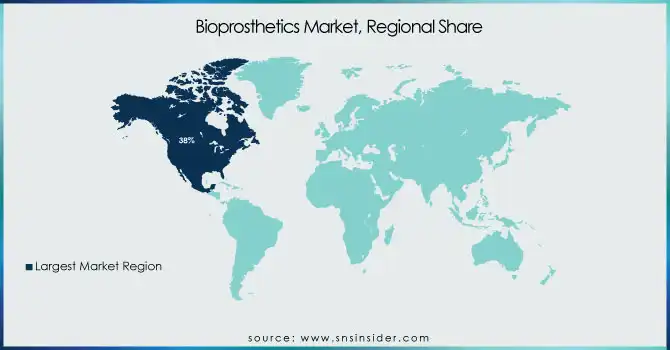
North America region dominated the market and held 38% revenue share in 2023. This growth can be driven by various factors such as the increased incidence of cardiovascular diseases and the well-established healthcare facilities in the region. According to the Centers for Disease Control and Prevention, cardiovascular disease (CVD) remains a significant health concern in the United States, with one person dying from CVD every 33 seconds. This worrying statistic highlights the urgent demand for improved bioprosthetic heart valve options in the cardiovascular space. Specifically, the U.S. market has been one of the major contributors for growth in North America. This is due to the rising heart diseases, growing healthcare expenditure, and key biopharma companies in the country. Moreover, the market growth is expected to accelerate further due to favorable reimbursement policies and significant investments in research and development.
On the other hand, the Asia Pacific region is projected to have the fastest CAGR, over the forecast period. Key drivers behind this rapid growth includes increased awareness about alternate treatments, rapidly developing healthcare infrastructure and elevated engagement in research and development in developing accounts such as India and China. The potential for regional growth is further supported by government initiatives within these countries to enhance healthcare accessibility and quality. As an example, the Healthy China 2030 plan by China indicates that it aims to enhance health so that people live long and healthy lives, which probably will drive the adoption of advance medical technologies in China including bioprosthetic.
Get Customized Report as per Your Business Requirement - Enquiry Now
Key Players
Key Service Providers/Manufacturers
Medtronic Plc (Hancock II Bioprosthetic Valve, Mosaic Bioprosthetic Valve)
Abbott Laboratories (MitraClip, TriClip)
Edwards Lifesciences Corporation (Carpentier-Edwards PERIMOUNT Valve, SAPIEN Transcatheter Heart Valve)
St. Jude Medical (Trifecta Valve, Epic Valve)
Sorin Group (Mitroflow Aortic Pericardial Heart Valve, Freedom SOLO Valve)
LeMaitre Vascular (XenoSure Biologic Patch, Omniflow II Biosynthetic Vascular Graft)
Carmat (Aeson Total Artificial Heart, Bioprosthetic Heart Valve)
Maquet Getinge Group (Vasoview Hemopro 2 Endoscopic Vessel Harvesting System, Cardiohelp System)
LifeCell Corporation (Strattice Reconstructive Tissue Matrix, AlloDerm Regenerative Tissue Matrix)
Humacyte (Human Acellular Vessel, Bioengineered Blood Vessel)
Users
Cleveland Clinic
Mayo Clinic
Johns Hopkins Hospital
Massachusetts General Hospital
Texas Heart Institute
Cedars-Sinai Medical Center
NewYork-Presbyterian Hospital
Brigham and Women's Hospital
Mount Sinai Hospital
Stanford Health Care
Recent Developments
In June 2024, Edwards Lifesciences received FDA approval for its next-generation RESILIA tissue-based bioprosthetic heart valve. This new valve incorporates advanced anti-calcification technology, potentially extending the durability of bioprosthetic heart valves.
| Report Attributes | Details |
|---|---|
| Market Size in 2023 | USD 5.8 Billion |
| Market Size by 2032 | USD 14.5 Billion |
| CAGR | CAGR of 10.7% From 2024 to 2032 |
| Base Year | 2023 |
| Forecast Period | 2024-2032 |
| Historical Data | 2020-2022 |
| Report Scope & Coverage | Market Size, Segments Analysis, Competitive Landscape, Regional Analysis, DROC & SWOT Analysis, Forecast Outlook |
| Key Segments | • By Product (Allograft, Xenograft) • By Application (Cardiovascular, Plastic surgery & wound healing) |
| Regional Analysis/Coverage | North America (US, Canada, Mexico), Europe (Eastern Europe [Poland, Romania, Hungary, Turkey, Rest of Eastern Europe] Western Europe] Germany, France, UK, Italy, Spain, Netherlands, Switzerland, Austria, Rest of Western Europe]), Asia Pacific (China, India, Japan, South Korea, Vietnam, Singapore, Australia, Rest of Asia Pacific), Middle East & Africa (Middle East [UAE, Egypt, Saudi Arabia, Qatar, Rest of Middle East], Africa [Nigeria, South Africa, Rest of Africa], Latin America (Brazil, Argentina, Colombia, Rest of Latin America) |
| Company Profiles | Medtronic Plc, Abbott Laboratories, Edwards Lifesciences Corporation, St. Jude Medical, Sorin Group, LeMaitre Vascular, Carmat, Maquet Getinge Group, LifeCell Corporation, Humacyte |
Ans. The projected market size for the Bioprosthetics Market is USD 14.5 Billion by 2032.
Ans: The North American region dominated the Bioprosthetics Market in 2023.
Ans. The CAGR of the Bioprosthetics Market is 10.7% During the forecast period of 2024-2032.
Ans: The major key players in the market are Medtronic Plc, Abbott Laboratories, Edwards Lifesciences Corporation, St. Jude Medical, Sorin Group, LeMaitre Vascular, Carmat, Maquet Getinge Group, LifeCell Corporation, Humacyte, and others in the final report.
Ans: The Allograft product segment dominated the Bioprosthetics Market in 2023.
Table of Content
1. Introduction
1.1 Market Definition
1.2 Scope (Inclusion and Exclusions)
1.3 Research Assumptions
2. Executive Summary
2.1 Market Overview
2.2 Regional Synopsis
2.3 Competitive Summary
3. Research Methodology
3.1 Top-Down Approach
3.2 Bottom-up Approach
3.3. Data Validation
3.4 Primary Interviews
4. Market Dynamics Impact Analysis
4.1 Market Driving Factors Analysis
4.1.2 Drivers
4.1.2 Restraints
4.1.3 Opportunities
4.1.4 Challenges
4.2 PESTLE Analysis
4.3 Porter’s Five Forces Model
5. Statistical Insights and Trends Reporting
5.1 Incidence and Prevalence of Target Conditions (2023)
5.2 Bioprosthetic Device Volume, by Region (2020-2032)
5.3 Healthcare Spending on Bioprosthetics (2023)
5.4 Regulatory Compliance and Approval Trends, by Region
5.5 Technological Advancements and Material Innovations (2023-2032)
6. Competitive Landscape
6.1 List of Major Companies, By Region
6.2 Market Share Analysis, By Region
6.3 Product Benchmarking
6.3.1 Product specifications and features
6.3.2 Pricing
6.4 Strategic Initiatives
6.4.1 Marketing and promotional activities
6.4.2 Distribution and supply chain strategies
6.4.3 Expansion plans and new product launches
6.4.4 Strategic partnerships and collaborations
6.5 Technological Advancements
6.6 Market Positioning and Branding
7. Bioprosthetics Market Segmentation, By Product
7.1 Chapter Overview
7.2 Allograft
7.2.1 Allograft Market Trends Analysis (2020-2032)
7.2.2 Allograft Market Size Estimates and Forecasts to 2032 (USD Billion)
7.3 Xenograft
7.3.1 Xenograft Market Trends Analysis (2020-2032)
7.3.2 Xenograft Market Size Estimates and Forecasts to 2032 (USD Billion)
8. Bioprosthetics Market Segmentation, By Application
8.1 Chapter Overview
8.2 Cardiovascular
8.2.1 Cardiovascular Market Trends Analysis (2020-2032)
8.2.2 Cardiovascular Market Size Estimates and Forecasts to 2032 (USD Billion)
8.3 Plastic surgery & wound healing
8.3.1 Plastic surgery & wound healing Market Trends Analysis (2020-2032)
8.3.2 Plastic surgery & wound healing Market Size Estimates and Forecasts to 2032 (USD Billion)
9. Regional Analysis
9.1 Chapter Overview
9.2 North America
9.2.1 Trends Analysis
9.2.2 North America Bioprosthetics Market Estimates and Forecasts, by Country (2020-2032) (USD Billion)
9.2.3 North America Bioprosthetics Market Estimates and Forecasts, By Product (2020-2032) (USD Billion)
9.2.4 North America Bioprosthetics Market Estimates and Forecasts, By Application (2020-2032) (USD Billion)
9.2.5 USA
9.2.5.1 USA Bioprosthetics Market Estimates and Forecasts, By Product (2020-2032) (USD Billion)
9.2.5.2 USA Bioprosthetics Market Estimates and Forecasts, By Application (2020-2032) (USD Billion)
9.2.6 Canada
9.2.6.1 Canada Bioprosthetics Market Estimates and Forecasts, By Product (2020-2032) (USD Billion)
9.2.6.2 Canada Bioprosthetics Market Estimates and Forecasts, By Application (2020-2032) (USD Billion)
9.2.7 Mexico
9.2.7.1 Mexico Bioprosthetics Market Estimates and Forecasts, By Product (2020-2032) (USD Billion)
9.2.7.2 Mexico Bioprosthetics Market Estimates and Forecasts, By Application (2020-2032) (USD Billion)
9.3 Europe
9.3.1 Eastern Europe
9.3.1.1 Trends Analysis
9.3.1.2 Eastern Europe Bioprosthetics Market Estimates and Forecasts, by Country (2020-2032) (USD Billion)
9.3.1.3 Eastern Europe Bioprosthetics Market Estimates and Forecasts, By Product (2020-2032) (USD Billion)
9.3.1.4 Eastern Europe Bioprosthetics Market Estimates and Forecasts, By Application (2020-2032) (USD Billion)
9.3.1.5 Poland
9.3.1.5.1 Poland Bioprosthetics Market Estimates and Forecasts, By Product (2020-2032) (USD Billion)
9.3.1.5.2 Poland Bioprosthetics Market Estimates and Forecasts, By Application (2020-2032) (USD Billion)
9.3.1.6 Romania
9.3.1.6.1 Romania Bioprosthetics Market Estimates and Forecasts, By Product (2020-2032) (USD Billion)
9.3.1.6.2 Romania Bioprosthetics Market Estimates and Forecasts, By Application (2020-2032) (USD Billion)
9.3.1.7 Hungary
9.3.1.7.1 Hungary Bioprosthetics Market Estimates and Forecasts, By Product (2020-2032) (USD Billion)
9.3.1.7.2 Hungary Bioprosthetics Market Estimates and Forecasts, By Application (2020-2032) (USD Billion)
9.3.1.8 Turkey
9.3.1.8.1 Turkey Bioprosthetics Market Estimates and Forecasts, By Product (2020-2032) (USD Billion)
9.3.1.8.2 Turkey Bioprosthetics Market Estimates and Forecasts, By Application (2020-2032) (USD Billion)
9.3.1.9 Rest of Eastern Europe
9.3.1.9.1 Rest of Eastern Europe Bioprosthetics Market Estimates and Forecasts, By Product (2020-2032) (USD Billion)
9.3.1.9.2 Rest of Eastern Europe Bioprosthetics Market Estimates and Forecasts, By Application (2020-2032) (USD Billion)
9.3.2 Western Europe
9.3.2.1 Trends Analysis
9.3.2.2 Western Europe Bioprosthetics Market Estimates and Forecasts, by Country (2020-2032) (USD Billion)
9.3.2.3 Western Europe Bioprosthetics Market Estimates and Forecasts, By Product (2020-2032) (USD Billion)
9.3.2.4 Western Europe Bioprosthetics Market Estimates and Forecasts, By Application (2020-2032) (USD Billion)
9.3.2.5 Germany
9.3.2.5.1 Germany Bioprosthetics Market Estimates and Forecasts, By Product (2020-2032) (USD Billion)
9.3.2.5.2 Germany Bioprosthetics Market Estimates and Forecasts, By Application (2020-2032) (USD Billion)
9.3.2.6 France
9.3.2.6.1 France Bioprosthetics Market Estimates and Forecasts, By Product (2020-2032) (USD Billion)
9.3.2.6.2 France Bioprosthetics Market Estimates and Forecasts, By Application (2020-2032) (USD Billion)
9.3.2.7 UK
9.3.2.7.1 UK Bioprosthetics Market Estimates and Forecasts, By Product (2020-2032) (USD Billion)
9.3.2.7.2 UK Bioprosthetics Market Estimates and Forecasts, By Application (2020-2032) (USD Billion)
9.3.2.8 Italy
9.3.2.8.1 Italy Bioprosthetics Market Estimates and Forecasts, By Product (2020-2032) (USD Billion)
9.3.2.8.2 Italy Bioprosthetics Market Estimates and Forecasts, By Application (2020-2032) (USD Billion)
9.3.2.9 Spain
9.3.2.9.1 Spain Bioprosthetics Market Estimates and Forecasts, By Product (2020-2032) (USD Billion)
9.3.2.9.2 Spain Bioprosthetics Market Estimates and Forecasts, By Application (2020-2032) (USD Billion)
9.3.2.10 Netherlands
9.3.2.10.1 Netherlands Bioprosthetics Market Estimates and Forecasts, By Product (2020-2032) (USD Billion)
9.3.2.10.2 Netherlands Bioprosthetics Market Estimates and Forecasts, By Application (2020-2032) (USD Billion)
9.3.2.11 Switzerland
9.3.2.11.1 Switzerland Bioprosthetics Market Estimates and Forecasts, By Product (2020-2032) (USD Billion)
9.3.2.11.2 Switzerland Bioprosthetics Market Estimates and Forecasts, By Application (2020-2032) (USD Billion)
9.3.2.12 Austria
9.3.2.12.1 Austria Bioprosthetics Market Estimates and Forecasts, By Product (2020-2032) (USD Billion)
9.3.2.12.2 Austria Bioprosthetics Market Estimates and Forecasts, By Application (2020-2032) (USD Billion)
9.3.2.13 Rest of Western Europe
9.3.2.13.1 Rest of Western Europe Bioprosthetics Market Estimates and Forecasts, By Product (2020-2032) (USD Billion)
9.3.2.13.2 Rest of Western Europe Bioprosthetics Market Estimates and Forecasts, By Application (2020-2032) (USD Billion)
9.4 Asia Pacific
9.4.1 Trends Analysis
9.4.2 Asia Pacific Bioprosthetics Market Estimates and Forecasts, by Country (2020-2032) (USD Billion)
9.4.3 Asia Pacific Bioprosthetics Market Estimates and Forecasts, By Product (2020-2032) (USD Billion)
9.4.4 Asia Pacific Bioprosthetics Market Estimates and Forecasts, By Application (2020-2032) (USD Billion)
9.4.5 China
9.4.5.1 China Bioprosthetics Market Estimates and Forecasts, By Product (2020-2032) (USD Billion)
9.4.5.2 China Bioprosthetics Market Estimates and Forecasts, By Application (2020-2032) (USD Billion)
9.4.6 India
9.4.5.1 India Bioprosthetics Market Estimates and Forecasts, By Product (2020-2032) (USD Billion)
9.4.5.2 India Bioprosthetics Market Estimates and Forecasts, By Application (2020-2032) (USD Billion)
9.4.5 Japan
9.4.5.1 Japan Bioprosthetics Market Estimates and Forecasts, By Product (2020-2032) (USD Billion)
9.4.5.2 Japan Bioprosthetics Market Estimates and Forecasts, By Application (2020-2032) (USD Billion)
9.4.6 South Korea
9.4.6.1 South Korea Bioprosthetics Market Estimates and Forecasts, By Product (2020-2032) (USD Billion)
9.4.6.2 South Korea Bioprosthetics Market Estimates and Forecasts, By Application (2020-2032) (USD Billion)
9.4.7 Vietnam
9.4.7.1 Vietnam Bioprosthetics Market Estimates and Forecasts, By Product (2020-2032) (USD Billion)
9.2.7.2 Vietnam Bioprosthetics Market Estimates and Forecasts, By Application (2020-2032) (USD Billion)
9.4.8 Singapore
9.4.8.1 Singapore Bioprosthetics Market Estimates and Forecasts, By Product (2020-2032) (USD Billion)
9.4.8.2 Singapore Bioprosthetics Market Estimates and Forecasts, By Application (2020-2032) (USD Billion)
9.4.9 Australia
9.4.9.1 Australia Bioprosthetics Market Estimates and Forecasts, By Product (2020-2032) (USD Billion)
9.4.9.2 Australia Bioprosthetics Market Estimates and Forecasts, By Application (2020-2032) (USD Billion)
9.4.10 Rest of Asia Pacific
9.4.10.1 Rest of Asia Pacific Bioprosthetics Market Estimates and Forecasts, By Product (2020-2032) (USD Billion)
9.4.10.2 Rest of Asia Pacific Bioprosthetics Market Estimates and Forecasts, By Application (2020-2032) (USD Billion)
9.5 Middle East and Africa
9.5.1 Middle East
9.5.1.1 Trends Analysis
9.5.1.2 Middle East Bioprosthetics Market Estimates and Forecasts, by Country (2020-2032) (USD Billion)
9.5.1.3 Middle East Bioprosthetics Market Estimates and Forecasts, By Product (2020-2032) (USD Billion)
9.5.1.4 Middle East Bioprosthetics Market Estimates and Forecasts, By Application (2020-2032) (USD Billion)
9.5.1.5 UAE
9.5.1.5.1 UAE Bioprosthetics Market Estimates and Forecasts, By Product (2020-2032) (USD Billion)
9.5.1.5.2 UAE Bioprosthetics Market Estimates and Forecasts, By Application (2020-2032) (USD Billion)
9.5.1.6 Egypt
9.5.1.6.1 Egypt Bioprosthetics Market Estimates and Forecasts, By Product (2020-2032) (USD Billion)
9.5.1.6.2 Egypt Bioprosthetics Market Estimates and Forecasts, By Application (2020-2032) (USD Billion)
9.5.1.7 Saudi Arabia
9.5.1.7.1 Saudi Arabia Bioprosthetics Market Estimates and Forecasts, By Product (2020-2032) (USD Billion)
9.5.1.7.2 Saudi Arabia Bioprosthetics Market Estimates and Forecasts, By Application (2020-2032) (USD Billion)
9.5.1.8 Qatar
9.5.1.8.1 Qatar Bioprosthetics Market Estimates and Forecasts, By Product (2020-2032) (USD Billion)
9.5.1.8.2 Qatar Bioprosthetics Market Estimates and Forecasts, By Application (2020-2032) (USD Billion)
9.5.1.9 Rest of Middle East
9.5.1.9.1 Rest of Middle East Bioprosthetics Market Estimates and Forecasts, By Product (2020-2032) (USD Billion)
9.5.1.9.2 Rest of Middle East Bioprosthetics Market Estimates and Forecasts, By Application (2020-2032) (USD Billion)
9.5.2 Africa
9.5.2.1 Trends Analysis
9.5.2.2 Africa Bioprosthetics Market Estimates and Forecasts, by Country (2020-2032) (USD Billion)
9.5.2.3 Africa Bioprosthetics Market Estimates and Forecasts, By Product (2020-2032) (USD Billion)
9.5.2.4 Africa Bioprosthetics Market Estimates and Forecasts, By Application (2020-2032) (USD Billion)
9.5.2.5 South Africa
9.5.2.5.1 South Africa Bioprosthetics Market Estimates and Forecasts, By Product (2020-2032) (USD Billion)
9.5.2.5.2 South Africa Bioprosthetics Market Estimates and Forecasts, By Application (2020-2032) (USD Billion)
9.5.2.6 Nigeria
9.5.2.6.1 Nigeria Bioprosthetics Market Estimates and Forecasts, By Product (2020-2032) (USD Billion)
9.5.2.6.2 Nigeria Bioprosthetics Market Estimates and Forecasts, By Application (2020-2032) (USD Billion)
9.5.2.7 Rest of Africa
9.5.2.7.1 Rest of Africa Bioprosthetics Market Estimates and Forecasts, By Product (2020-2032) (USD Billion)
9.5.2.7.2 Rest of Africa Bioprosthetics Market Estimates and Forecasts, By Application (2020-2032) (USD Billion)
9.6 Latin America
9.6.1 Trends Analysis
9.6.2 Latin America Bioprosthetics Market Estimates and Forecasts, by Country (2020-2032) (USD Billion)
9.6.3 Latin America Bioprosthetics Market Estimates and Forecasts, By Product (2020-2032) (USD Billion)
9.6.4 Latin America Bioprosthetics Market Estimates and Forecasts, By Application (2020-2032) (USD Billion)
9.6.5 Brazil
9.6.5.1 Brazil Bioprosthetics Market Estimates and Forecasts, By Product (2020-2032) (USD Billion)
9.6.5.2 Brazil Bioprosthetics Market Estimates and Forecasts, By Application (2020-2032) (USD Billion)
9.6.6 Argentina
9.6.6.1 Argentina Bioprosthetics Market Estimates and Forecasts, By Product (2020-2032) (USD Billion)
9.6.6.2 Argentina Bioprosthetics Market Estimates and Forecasts, By Application (2020-2032) (USD Billion)
9.6.7 Colombia
9.6.7.1 Colombia Bioprosthetics Market Estimates and Forecasts, By Product (2020-2032) (USD Billion)
9.6.7.2 Colombia Bioprosthetics Market Estimates and Forecasts, By Application (2020-2032) (USD Billion)
9.6.8 Rest of Latin America
9.6.8.1 Rest of Latin America Bioprosthetics Market Estimates and Forecasts, By Product (2020-2032) (USD Billion)
9.6.8.2 Rest of Latin America Bioprosthetics Market Estimates and Forecasts, By Application (2020-2032) (USD Billion)
10. Company Profiles
10.1 Medtronic Plc
10.1.1 Company Overview
10.1.2 Financial
10.1.3 Products/ Services Offered
110.1.4 SWOT Analysis
10.2 Abbott Laboratories
10.2.1 Company Overview
10.2.2 Financial
10.2.3 Products/ Services Offered
10.2.4 SWOT Analysis
10.3 Edwards Lifesciences Corporation
10.3.1 Company Overview
10.3.2 Financial
10.3.3 Products/ Services Offered
10.3.4 SWOT Analysis
10.4 St. Jude Medical
10.4.1 Company Overview
10.4.2 Financial
10.4.3 Products/ Services Offered
10.4.4 SWOT Analysis
10.5 Sorin Group
10.5.1 Company Overview
10.5.2 Financial
10.5.3 Products/ Services Offered
10.5.4 SWOT Analysis
10.6 LeMaitre Vascular
10.6.1 Company Overview
10.6.2 Financial
10.6.3 Products/ Services Offered
10.6.4 SWOT Analysis
10.7 Carmat
10.7.1 Company Overview
10.7.2 Financial
10.7.3 Products/ Services Offered
10.7.4 SWOT Analysis
10.8 Maquet Getinge Group
10.8.1 Company Overview
10.8.2 Financial
10.8.3 Products/ Services Offered
10.8.4 SWOT Analysis
10.9 LifeCell Corporation
10.9.1 Company Overview
10.9.2 Financial
10.9.3 Products/ Services Offered
10.9.4 SWOT Analysis
10.10 Humacyte
10.9.1 Company Overview
10.9.2 Financial
10.9.3 Products/ Services Offered
10.9.4 SWOT Analysis
11. Use Cases and Best Practices
12. Conclusion
An accurate research report requires proper strategizing as well as implementation. There are multiple factors involved in the completion of good and accurate research report and selecting the best methodology to compete the research is the toughest part. Since the research reports we provide play a crucial role in any company’s decision-making process, therefore we at SNS Insider always believe that we should choose the best method which gives us results closer to reality. This allows us to reach at a stage wherein we can provide our clients best and accurate investment to output ratio.
Each report that we prepare takes a timeframe of 350-400 business hours for production. Starting from the selection of titles through a couple of in-depth brain storming session to the final QC process before uploading our titles on our website we dedicate around 350 working hours. The titles are selected based on their current market cap and the foreseen CAGR and growth.
The 5 steps process:
Step 1: Secondary Research:
Secondary Research or Desk Research is as the name suggests is a research process wherein, we collect data through the readily available information. In this process we use various paid and unpaid databases which our team has access to and gather data through the same. This includes examining of listed companies’ annual reports, Journals, SEC filling etc. Apart from this our team has access to various associations across the globe across different industries. Lastly, we have exchange relationships with various university as well as individual libraries.

Step 2: Primary Research
When we talk about primary research, it is a type of study in which the researchers collect relevant data samples directly, rather than relying on previously collected data. This type of research is focused on gaining content specific facts that can be sued to solve specific problems. Since the collected data is fresh and first hand therefore it makes the study more accurate and genuine.
We at SNS Insider have divided Primary Research into 2 parts.
Part 1 wherein we interview the KOLs of major players as well as the upcoming ones across various geographic regions. This allows us to have their view over the market scenario and acts as an important tool to come closer to the accurate market numbers. As many as 45 paid and unpaid primary interviews are taken from both the demand and supply side of the industry to make sure we land at an accurate judgement and analysis of the market.
This step involves the triangulation of data wherein our team analyses the interview transcripts, online survey responses and observation of on filed participants. The below mentioned chart should give a better understanding of the part 1 of the primary interview.

Part 2: In this part of primary research the data collected via secondary research and the part 1 of the primary research is validated with the interviews from individual consultants and subject matter experts.
Consultants are those set of people who have at least 12 years of experience and expertise within the industry whereas Subject Matter Experts are those with at least 15 years of experience behind their back within the same space. The data with the help of two main processes i.e., FGDs (Focused Group Discussions) and IDs (Individual Discussions). This gives us a 3rd party nonbiased primary view of the market scenario making it a more dependable one while collation of the data pointers.
Step 3: Data Bank Validation
Once all the information is collected via primary and secondary sources, we run that information for data validation. At our intelligence centre our research heads track a lot of information related to the market which includes the quarterly reports, the daily stock prices, and other relevant information. Our data bank server gets updated every fortnight and that is how the information which we collected using our primary and secondary information is revalidated in real time.

Step 4: QA/QC Process
After all the data collection and validation our team does a final level of quality check and quality assurance to get rid of any unwanted or undesired mistakes. This might include but not limited to getting rid of the any typos, duplication of numbers or missing of any important information. The people involved in this process include technical content writers, research heads and graphics people. Once this process is completed the title gets uploader on our platform for our clients to read it.
Step 5: Final QC/QA Process:
This is the last process and comes when the client has ordered the study. In this process a final QA/QC is done before the study is emailed to the client. Since we believe in giving our clients a good experience of our research studies, therefore, to make sure that we do not lack at our end in any way humanly possible we do a final round of quality check and then dispatch the study to the client.
By Product
Allograft
Xenograft
By Application
Cardiovascular
Plastic surgery & wound healing
Request for Segment Customization as per your Business Requirement: Segment Customization Request
REGIONAL COVERAGE:
North America
US
Canada
Mexico
Europe
Eastern Europe
Poland
Romania
Hungary
Turkey
Rest of Eastern Europe
Western Europe
Germany
France
UK
Italy
Spain
Netherlands
Switzerland
Austria
Rest of Western Europe
Asia Pacific
China
India
Japan
South Korea
Vietnam
Singapore
Australia
Rest of Asia Pacific
Middle East & Africa
Middle East
UAE
Egypt
Saudi Arabia
Qatar
Rest of the Middle East
Africa
Nigeria
South Africa
Rest of Africa
Latin America
Brazil
Argentina
Colombia
Rest of Latin America
Request for Country Level Research Report: Country Level Customization Request
Available Customization
With the given market data, SNS Insider offers customization as per the company’s specific needs. The following customization options are available for the report:
Product Analysis
Criss-Cross segment analysis (e.g. Product X Application)
Product Matrix which gives a detailed comparison of product portfolio of each company
Geographic Analysis
Additional countries in any of the regions
Company Information
Detailed analysis and profiling of additional market players (Up to five)
The Multimodal Imaging Market size was valued at USD 4.43 billion in 2023 and is expected to reach USD 7.43 Billion by 2032, growing at a CAGR of 5.93% during the forecast period of 2024-2032.
Mental Health Market Size was valued at USD 415.7 Billion in 2023 and is expected to reach USD 592.6 Billion by 2032, growing at a CAGR of 4.04% over the forecast period 2024-2032.
Clear Aligners Market size was valued at USD 4.21 billion in 2023 and is projected to reach USD 45.98 billion by 2032, with a CAGR of 29.20% from 2024 to 2032.
The Amniotic Membrane Market size was worth USD 3.65 billion in 2023 and is predicted to be worth USD 10.18 billion by 2032, growing at a CAGR of 12.10%.
The Nucleotide Market Size was valued at USD 702.38 Million in 2023 and is expected to reach USD 1,319.80 Million by 2032, growing at a CAGR of 7.26% over the forecast period of 2024-2032.
The Opioid Use Disorder Market Size was valued at USD 3.7 Billion in 2023 and is expected to reach USD 9.02 Billion by 2032, growing at a CAGR of 10.4%.

Hi! Click one of our member below to chat on Phone
© 2025 All Rights Reserved by SNS Insider Pvt Ltd


