Bioprocess Validation Market Report Scope & Overview:
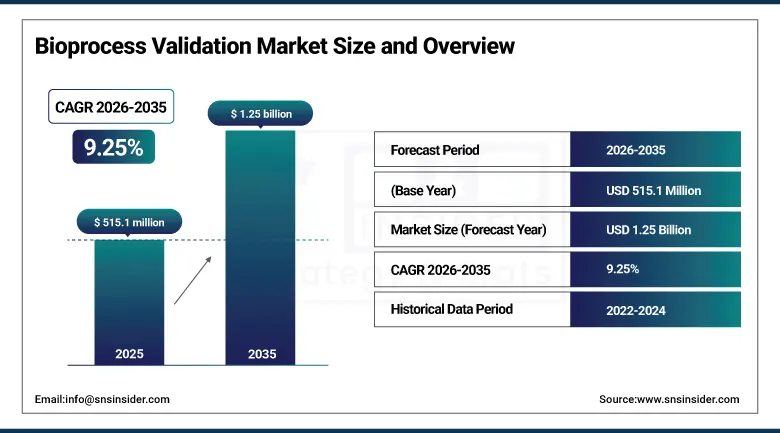
The Bioprocess Validation Market was valued at USD 515.1 Million in 2025 and is expected to reach USD 1.25 Billion by 2035, growing at a CAGR of 9.25% from 2026–2035.
The global bioprocess validation market is advancing as the biopharmaceutical industry’s rapid expansion of biologics, biosimilars, vaccines, and cell and gene therapy manufacturing creates proportional growth in the systematic validation services and analytical testing programmes that regulatory authorities including the FDA, EMA, and PMDA require to demonstrate that manufacturing processes consistently produce drug products meeting predetermined quality, safety, and efficacy specifications. Bioprocess validation encompasses extractable and leachable testing of single-use components whose polymer leachate characterization is required for regulatory submission, viral clearance validation demonstrating pathogen removal capability of purification unit operations, filtration system validation confirming sterilizing filtration performance, process qualification generating documented statistical evidence of process parameter consistency, and continued process verification monitoring production performance against validated ranges.
In 2024, Sartorius Stedim Biotech expanded its extractable and leachable testing service capabilities at its North American and European laboratories, enabling comprehensive E&L characterization of single-use bioprocessing component materials including bags, tubing, filters, and connectors to meet the requirements of the BioPhorum and BPSA industry standard extractable protocols. The expansion addressed the growing biopharmaceutical industry demand for standardized, protocol-compliant E&L testing whose documentation efficiency reduces the data compilation burden for regulatory submissions while maintaining the analytical rigour that regulatory reviewers require for single-use technology qualification packages.
Market Size and Forecast:
-
Market Size in 2026E: USD 562.7 Million
-
Market Size by 2035: USD 1.25 Billion
-
CAGR: 9.25% from 2026 to 2035
-
Fastest Growing Region: Asia Pacific
-
Largest Region: North America
To Get more information on Bioprocess Validation Market - Request Free Sample Report
Bioprocess Validation Market Trends:
-
Single-use bioprocessing technology adoption is creating growing extractable and leachable validation demand for polymer component characterization.
-
mRNA and cell and gene therapy manufacturing platforms are requiring novel viral clearance and process validation approaches beyond established monoclonal antibody frameworks.
-
AI-powered process analytical technology is enabling real-time continued process verification with reduced manual sample analysis burden.
-
Regulatory agency focus on data integrity and electronic batch records is driving investment in validated computerized system validation documentation.
-
Harmonization of ICH Q7, Q8, Q9, Q10, and Q12 guidance through ICH Q13 for continuous manufacturing is creating new process validation frameworks.
U.S. Bioprocess Validation Market Outlook:
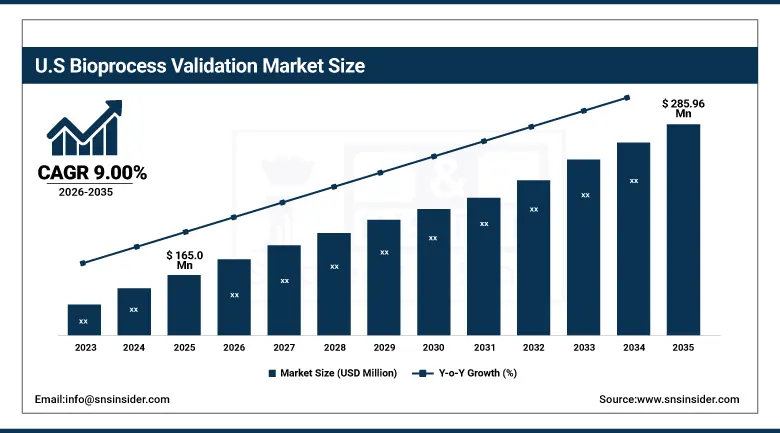
The U.S. Bioprocess Validation Market was valued at approximately USD 165.0 Million in 2025 and is expected to reach approximately USD 285.96 Million by 2032, growing at a CAGR of approximately 9.00%.
The United States leads North American revenues through the world’s largest biopharmaceutical manufacturing base, the FDA’s comprehensive Process Validation Guidance for Industry framework creating structured validation programme requirements, and the concentration of single-use bioprocessing technology adoption creating above-baseline extractable and leachable validation demand. Nelson Laboratories, Pacific BioLabs, and Charles River Laboratories sustain U.S. bioprocess validation service leadership through their FDA-registered analytical facilities, validated test methods, and regulatory submission-ready reporting capabilities.
In 2024, Nelson Laboratories expanded its viral clearance testing service capacity at its Salt Lake City facility, adding dedicated virus inactivation and removal testing suites for monoclonal antibody, plasma-derived product, and cell and gene therapy manufacturing process validation. The expansion addressed the growing backlog in viral clearance testing services, where the simultaneous increase in biologics programme activity across the biopharmaceutical industry had created multi-month wait times for critical viral clearance validation studies whose completion is required on the regulatory approval pathway for each biologic drug candidate.
Bioprocess Validation Market Segment Analysis:
-
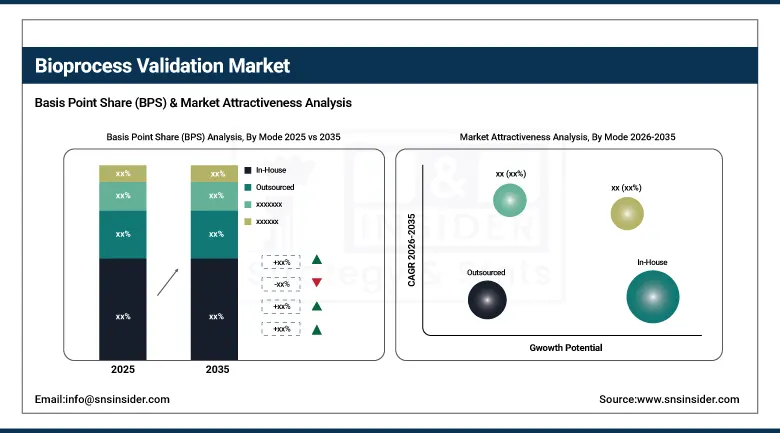
By Mode, in-house segment dominated the bioprocess validation market with approximately 68.42% share in 2025, while the outsourced segment is the fastest growing with a CAGR of approximately 10.2%.
-
By Type, Extractables & Leachables testing segment dominated the bioprocess validation market with the largest share in 2025, while viral clearance testing is growing rapidly driven by cell and gene therapy and mRNA manufacturing programme expansion.
-
By Stage, process qualification segment dominated the bioprocess validation market with the largest share in 2025, while Continued Process Verification is the fastest growing stage driven by real-time monitoring and lifecycle validation framework adoption.
-
By End User, biotechnology & pharmaceutical companies segment dominated the bioprocess validation market with the largest share in 2025, while contract manufacturing organizations are the fastest growing end user through biologics CMO capacity expansion.
By Mode, in-house dominates, outsourcing grows fastest
In-house validation retained the dominant mode position with approximately 68.42% of the bioprocess validation market in 2025. Its commercial primacy reflects the major biopharmaceutical companies’ preference for maintaining proprietary process knowledge and quality system control within their own validated facilities, whose extensive Quality Management System infrastructure, trained validation specialist staff, and validated analytical laboratory networks create the in-house capability to conduct process qualification, continued process verification, and routine analytical testing without external disclosure of manufacturing process parameters whose confidentiality is commercially significant. Large pharmaceutical companies including Roche, Pfizer, AstraZeneca, and Novartis whose biologics manufacturing scale creates validation workloads that sustain dedicated in-house validation teams across multiple manufacturing sites sustain the segment’s dominant market position.
Outsourcing is growing fastest at approximately 10.2% CAGR because small biotechnology companies, emerging biopharmaceutical firms, and startups developing cell therapy, gene therapy, and RNA therapeutics whose manufacturing processes require specialized validation services typically lack the internal laboratory infrastructure, trained validation specialists, and validated regulatory method capabilities to conduct all required validation activities independently. Each new biopharmaceutical company that advances a biological drug candidate to process qualification without in-house extractables testing, viral clearance, or container closure integrity testing capability creates outsourced validation service procurement whose growing frequency with the expanding biopharmaceutical pipeline creates above-market CRO service revenue growth.
By Type, E&L testing dominates, viral clearance grows rapidly
Extractables and leachables testing retained the dominant type position with the largest share of the bioprocess validation market in 2025. E&L testing’s commercial primacy reflects the systematic requirement to characterize chemical compounds that migrate from single-use bioprocessing system contact materials into the drug product or process stream, where regulatory authorities require comprehensive extractables characterization of all polymeric components contacting the product across the manufacturing train. Each single-use bioreactor, storage bag, filter capsule, tubing assembly, and connector component whose extractables profile must be characterized, toxicologically assessed, and qualified creates E&L testing procurement whose scope and analytical depth scales with the complexity of the single-use process train and the regulatory submission geography’s analytical requirements.
Viral clearance testing is growing rapidly because the expansion of cell therapy, gene therapy, and mRNA manufacturing programmes beyond the established monoclonal antibody production frameworks whose viral clearance validation science is well-established creates new validation challenges requiring novel virus inactivation and removal study designs. Each new advanced therapy medicinal product whose manufacturing process incorporates raw materials or process components of biological origin requires viral clearance validation whose regulatory framework is progressively being defined through FDA and EMA guidance development, creating sustained demand for specialized viral clearance testing expertise.
Regional Analysis:
|
Region |
Major Country |
Share within Region, 2025 (%) |
|---|---|---|
|
North America |
United States |
82.5% |
|
Europe |
Germany |
22.4% |
|
Asia Pacific |
China |
44.8% |
|
Middle East & Africa |
Israel |
22.8% |
|
Latin America |
Brazil |
43.8% |
North America Bioprocess Validation Market Insights
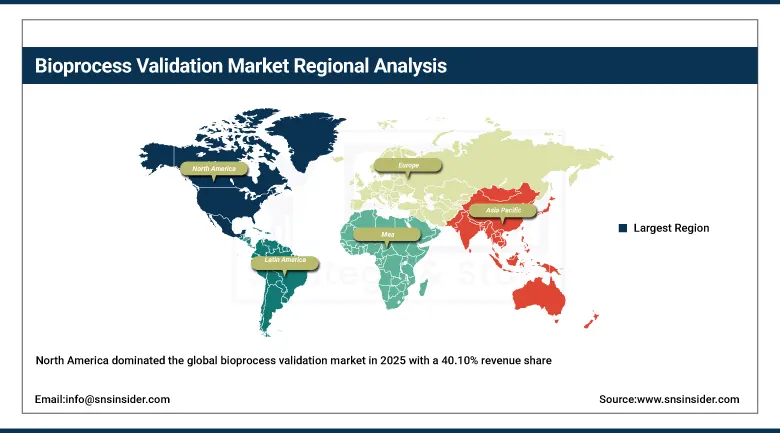
North America dominated the global bioprocess validation market in 2025 with a 40.10% revenue share through its world-leading biopharmaceutical manufacturing base, the FDA’s comprehensive process validation guidance framework, and the concentration of specialized bioprocess validation service providers. The United States accounts for approximately 82.5% of North American revenues through Nelson Laboratories, Pacific BioLabs, and Charles River Laboratories’ bioprocess validation service leadership and the large biopharmaceutical companies’ in-house validation programme investment.
Canada contributes supplementary North American revenues through its growing biopharmaceutical manufacturing sector’s validation service procurement, the National Research Council’s biologics manufacturing investment creating domestic validation capability, and the cell and gene therapy start-up ecosystem’s growing outsourced validation service engagement as clinical-stage programmes advance toward commercial manufacturing scale.
Get Customized Report as per Your Business Requirement - Enquiry Now
Europe Bioprocess Validation Market Insights
Europe is a significant bioprocess validation market where the EMA’s comprehensive biologics manufacturing regulatory framework, the EU GMP Guidelines’ Annex 15 validation and qualification requirements, and the European Medicines Agency’s biosimilar approval pathway’s process comparability requirements create structured validation programme demand. Germany accounts for approximately 22.4% of European revenues through its large pharmaceutical and biotechnology manufacturing sector, Sartorius Stedim Biotech’s European testing service leadership, and the German pharmaceutical regulatory framework’s comprehensive GMP inspection programme.
Switzerland’s Roche and Novartis manufacturing programme’s validation investment, the United Kingdom’s growing cell and gene therapy manufacturing sector’s specialized validation requirement, and Ireland’s large pharmaceutical manufacturing hub’s validation service procurement collectively sustain European market development. Post-Brexit MHRA’s alignment with international ICH guidelines sustains UK market compatibility with European validation standards.
Asia Pacific Bioprocess Validation Market Insights
Asia Pacific is the fastest-growing regional bioprocess validation market, driven by China’s rapidly expanding biologics manufacturing sector, India’s growing biosimilar production creating validation programme investment, and Japan’s advanced pharmaceutical manufacturing sector’s progressive adoption of lifecycle validation approaches. China accounts for approximately 44.8% of Asia Pacific revenues through WuXi Biologics’ CMO platform, the NMPA’s evolving biologics validation requirements, and the rapidly growing domestic biopharmaceutical company pipeline.
India is the most commercially dynamic emerging market within Asia Pacific, where the world’s largest biosimilar manufacturing sector’s growing validation programme investment, the Biologics License Application pathway’s validation documentation requirements for U.S. and European export market access, and the growing domestic CRO sector’s bioprocess validation service expansion create above-regional-average market growth. South Korea’s advanced cell therapy manufacturing and Singapore’s biologics manufacturing hub contribute premium regional demand.
MEA & Latin America Bioprocess Validation Market Insights
Israel leads MEA revenues through its world-class biotechnology industry’s process validation investment, the growing pharmaceutical manufacturing sector’s validation programme compliance requirement, and the advanced scientific infrastructure that supports both in-house and CRO bioprocess validation service capability. Saudi Arabia’s Vision 2030 pharmaceutical manufacturing investment creates growing regional validation demand.
Brazil leads Latin American revenues at approximately 43.8% through ANVISA’s pharmaceutical GMP requirements creating bioprocess validation compliance demand from the large domestic pharmaceutical manufacturing sector, the growing biosimilar manufacturing investment creating validation programme procurement, and the CRO sector’s growing bioprocess validation service capacity development. Mexico and Argentina contribute growing secondary demand through their pharmaceutical manufacturing and regulatory compliance investment.
Market Dynamics:
Growth Drivers: Biologics manufacturing expansion and single-use technology adoption creating growing extractables validation and viral clearance testing demand
The bioprocess validation market’s growth is driven by the biopharmaceutical industry’s systematic expansion of biologics manufacturing capacity whose proportional validation programme investment creates the most structurally certain demand driver in the market. Each new biologics manufacturing facility, whether a greenfield commercial production site, a modular clinical manufacturing unit, or a cell and gene therapy production suite, creates validation programme procurement across process qualification, extractables testing, viral clearance studies, and computerized system validation whose aggregate scope per manufacturing project represents substantial testing service and consulting revenue. The global biosimilar pipeline’s expansion, where each biosimilar programme requires extensive comparability testing and process validation demonstrating analytical and functional equivalence to the reference biologic, creates proportional validation service demand that grows with each new biosimilar regulatory submission.
Single-use bioprocessing technology’s progressive replacement of stainless steel bioreactors and process vessels creates expanding extractables and leachables testing demand as each new single-use system component introduced into a manufacturing process requires comprehensive polymer extractables characterization and drug product leachables risk assessment. The biopharmaceutical industry’s adoption of single-use systems from 2 to 2000 litre bioreactor scales for both clinical and commercial manufacturing creates a validation scope expansion that sustains E&L testing service revenue growth above the baseline biopharmaceutical manufacturing growth rate.
Restraints: Specialized analytical expertise shortage and lengthy validation timelines constraining validation programme throughput and creating regulatory submission delays
Bioprocess validation’s requirement for specialized analytical chemists, validation scientists, and regulatory affairs specialists whose combined expertise in biopharmaceutical manufacturing science, analytical method validation, ICH guideline interpretation, and regulatory submission writing creates a talent pool whose global supply is insufficient to meet the growing biopharmaceutical pipeline’s validation programme demand. Each validation study delayed by laboratory scheduling constraints, method development timelines, or specialist reviewer availability creates a regulatory submission delay whose commercial consequence for the sponsoring biopharmaceutical company is measured in delayed revenue from the drug product’s market introduction.
The length and complexity of comprehensive bioprocess validation programmes, where viral clearance studies require specialized virus-certified laboratory facilities, multi-step process simulations, and extensive analytical work whose typical duration of 6 to 18 months per study creates critical path dependencies in the regulatory submission timeline, constrains the validation service market’s throughput capacity below the biopharmaceutical pipeline’s programme advancement rate.
Opportunities: Cell and gene therapy validation framework development and continuous manufacturing validation creating new bioprocess validation service categories
Cell and gene therapy manufacturing’s commercial-scale expansion creates the bioprocess validation market’s most technically novel near-term growth opportunity, where the viral vector manufacturing process’s unique viral clearance validation challenges, the autologous cell therapy’s patient-specific manufacturing validation requirements, and the lentiviral and AAV vector extraction and purification process’s novel validation analytical framework each require specialized service development that established biologics validation providers are progressively investing in. Each new cell therapy or gene therapy commercial manufacturing facility whose regulatory submission requires novel viral clearance validation strategies creates new service revenue categories whose premium pricing reflects the analytical specialization required.
Continuous biopharmaceutical manufacturing’s commercial adoption, enabled by ICH Q13’s regulatory framework for continuous manufacturing validation, creates a fundamentally new validation paradigm whose real-time release testing, process analytical technology integration, and dynamic control strategy validation differ substantively from traditional batch manufacturing validation. Each continuous manufacturing facility that deploys real-time monitoring-based continued process verification instead of periodic batch sampling creates demand for novel process analytical technology validation and real-time release testing method development whose specialized service requirement sustains premium pricing.
Recent Developments:
-
2024: Sartorius Stedim Biotech expanded extractables and leachables testing service capabilities at North American and European laboratories, providing comprehensive E&L characterisation of single-use bioprocessing components compliant with BioPhorum and BPSA industry standard extractables testing protocols.
-
2024: Nelson Laboratories expanded viral clearance testing capacity at its Salt Lake City facility with dedicated inactivation and removal testing suites for monoclonal antibody, plasma-derived product, and cell and gene therapy manufacturing programme validation studies.
-
2024: Charles River Laboratories expanded its bioprocess validation service portfolio with enhanced ICH Q13 continuous manufacturing validation expertise, providing process analytical technology method validation and real-time release testing strategy development services for continuous biopharmaceutical manufacturing clients.
Bioprocess Validation Market Key Players are:
-
Sartorius Stedim Biotech GmbH
-
Merck KGaA (EMD Millipore)
-
Thermo Fisher Scientific Inc.
-
Pall Corporation (Danaher)
-
Nelson Laboratories LLC
-
Pacific BioLabs Inc.
-
Eurofins Scientific SE
-
Charles River Laboratories International Inc.
-
SGS SA
-
Toxikon Corporation
-
MEISSNER FILTRATION PRODUCTS Inc.
-
BioProcess Technology Consultants Inc.
-
Lonza Group Ltd.
-
Cobetter Filtration Equipment Co. Ltd.
-
Cytovance Biologics Inc.
-
DOC S.r.l.
-
Gibraltar Laboratories Inc.
-
ProBioGen AG
-
WuXi Biologics Co. Ltd.
-
CMIC Holdings Co. Ltd.
Bioprocess Validation Market Report Scope:
| Report Attributes | Details |
|---|---|
| Market Size in 2025 | USD 515.1 Million |
| Market Size by 2035 | USD 1.25 Billion |
| CAGR | CAGR of 9.25% From 2026 to 2035 |
| Base Year | 2025 |
| Forecast Period | 2026-2035 |
| Historical Data | 2022-2024 |
| Report Scope & Coverage | Market Size, Segments Analysis, Competitive Landscape, Regional Analysis, DROC & SWOT Analysis, Forecast Outlook |
| Key Segments | • By Type (Extractables & Leachables Testing, Bioprocess Residuals Testing, Viral Clearance Testing, Filtration & Fermentation Systems Testing, Others) • By Mode (In-House, Outsourced) • By Stage (Process Design, Process Qualification, Continued Process Verification) • By End User (Biotechnology & Pharmaceutical Companies, Contract Research Organizations, Contract Manufacturing Organizations, Others) |
| Regional Analysis/Coverage | North America (US, Canada), Europe (Germany, UK, France, Italy, Spain, Russia, Poland, Rest of Europe), Asia Pacific (China, India, Japan, South Korea, Australia, ASEAN Countries, Rest of Asia Pacific), Middle East & Africa (UAE, Saudi Arabia, Qatar, South Africa, Rest of Middle East & Africa), Latin America (Brazil, Argentina, Mexico, Colombia, Rest of Latin America). |
| Company Profiles | Sartorius Stedim Biotech GmbH, Merck KGaA (EMD Millipore), Thermo Fisher Scientific Inc., Pall Corporation (Danaher), Nelson Laboratories LLC, Pacific BioLabs Inc., Eurofins Scientific SE, Charles River Laboratories International Inc., SGS SA, Toxikon Corporation, MEISSNER FILTRATION PRODUCTS Inc., BioProcess Technology Consultants Inc., Lonza Group Ltd., Cobetter Filtration Equipment Co. Ltd., Cytovance Biologics Inc., DOC S.r.l., Gibraltar Laboratories Inc., ProBioGen AG, WuXi Biologics Co. Ltd., and CMIC Holdings Co. Ltd. |
Frequently Asked Questions
The Bioprocess Validation Market is expected to grow at a CAGR of 9.25% from 2026 to 2035.
The Bioprocess Validation Market was valued at USD 515.1 Million in 2025.
Biologics manufacturing expansion creating proportional process qualification investment, single-use technology adoption requiring extractables and leachables validation, growing cell and gene therapy pipeline creating novel viral clearance validation demand, and biosimilar programme comparability testing are the primary growth factors.
The In-House segment dominated the Bioprocess Validation Market with approximately 68.42% share in 2025.
North America dominated the bioprocess validation market in 2025 with a 40.10% revenue share.
Get in Touch
