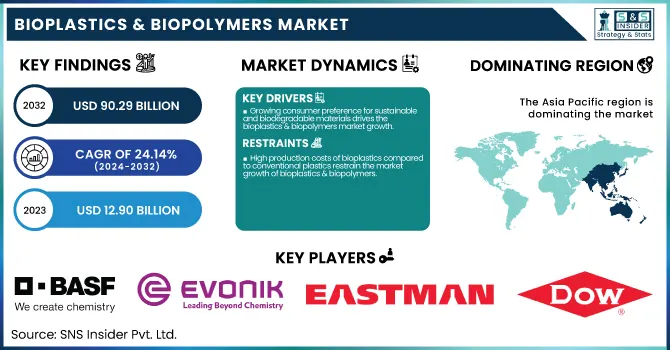
The Bioplastics & Biopolymers Market size was USD 12.90 billion in 2023 and is expected to reach USD 90.29 billion by 2032 and grow at a CAGR of 24.14% over the forecast period of 2024-2032.
To Get more information on Bioplastics & Biopolymers Market - Request Free Sample Report
The report offers detailed statistical insights and trends covering production capacity and utilization rates by country and by type for 2023. It presents feedstock pricing trends segmented by country and type, along with an analysis of regulatory impacts across major regions. The report also highlights environmental metrics, including emissions data, waste management practices, and sustainability initiatives by region. Additionally, it explores innovation and R&D advancements by material type. Insights into software adoption rates by region, key feature analysis, and regulatory adherence trends are also provided. This comprehensive data helps stakeholders assess market dynamics, sustainability efforts, and emerging growth opportunities.
The United States held the largest share in the Bioplastics & Biopolymers market in 2023, with a market size of USD 2.29 billion, projected to reach USD 16.68 billion by 2032, growing at a CAGR of 24.68% during 2024–2032. This is due to its strong emphasis on sustainability, advanced manufacturing capabilities, and substantial investment in research and development. Government initiatives like the U.S. Department of Agriculture's BioPreferred Program have significantly promoted the use of biobased products across various industries. Additionally, major players such as BASF, Eastman Chemical Company, and Dow are actively expanding their bioplastics product lines, further boosting domestic production and innovation. The country's robust consumer awareness regarding eco-friendly materials, combined with strict environmental regulations encouraging the reduction of carbon emissions and plastic waste, has accelerated the adoption of bioplastics in packaging, automotive, textiles, and consumer goods sectors. This well-developed industrial ecosystem, coupled with a growing focus on circular economy principles, has solidified the U.S.'s dominant position in the global market.
Drivers
Growing consumer preference for sustainable and biodegradable materials drives the bioplastics & biopolymers market growth.
The increasing global emphasis on sustainability has significantly boosted consumer preference for eco-friendly products, driving the demand for bioplastics and biopolymers. Companies across packaging, automotive, consumer goods, and textiles are rapidly adopting biobased alternatives to meet changing regulatory standards and consumer expectations. Various government initiatives, such as the U.S. Department of Agriculture's BioPreferred Program and the European Union's Green Deal, are actively promoting the use of biodegradable materials. Moreover, advancements in material performance and cost-competitiveness of bioplastics compared to conventional plastics are making these products more attractive across industries. The rising concern over plastic pollution and the need to reduce carbon footprints further amplify this shift. Consequently, the surging demand for sustainable and biodegradable solutions is creating substantial growth opportunities for the Bioplastics & Biopolymers Market on a global scale.
Restrain
High production costs of bioplastics compared to conventional plastics restrain the market growth of bioplastics & biopolymers.
Despite increasing demand, the high production costs associated with bioplastics and biopolymers act as a major barrier to widespread market adoption. The sourcing of bio-based raw materials, combined with limited economies of scale and expensive processing technologies, results in higher prices compared to traditional petroleum-based plastics. Small and medium-sized enterprises particularly find it challenging to afford these alternatives, limiting their broader usage in cost-sensitive sectors. Additionally, the need for dedicated infrastructure for composting or recycling bioplastics adds to the overall costs for end-users and municipalities. While technological advancements are ongoing to lower these costs, price competitiveness remains a crucial hurdle. Thus, unless production technologies significantly advance or government subsidies increase, the cost disadvantage will continue to restrain the rapid growth of the Bioplastics & Biopolymers Market.
Opportunity
Expansion of compostable packaging solutions across emerging economies offers lucrative opportunities for bioplastics & biopolymers market.
The rapid growth of e-commerce and food delivery services, especially in emerging economies, is creating substantial opportunities for compostable packaging solutions, boosting the Bioplastics & Biopolymers Market. Countries across Asia-Pacific and Latin America are witnessing a surge in demand for sustainable alternatives due to rising urbanization, consumer awareness, and supportive governmental policies promoting green packaging practices. Innovations in flexible packaging, biodegradable containers, and agricultural films are further expanding the potential of bioplastics in these high-growth regions. Additionally, international brands are increasingly partnering with local companies to introduce eco-friendly packaging options, tapping into these emerging markets. The need to align with global sustainability goals and respond to stricter regulatory frameworks also accelerates investments in compostable materials. As a result, the expansion of compostable packaging solutions presents a highly lucrative avenue for market players.
Challenge
Lack of Industrial Composting Facilities and Recycling Infrastructure Challenges the Growth of the Bioplastics & Biopolymers Market.
One of the most critical challenges facing the Bioplastics & Biopolymers Market is the lack of adequate industrial composting facilities and recycling infrastructure worldwide. Although bioplastics are designed to be compostable or biodegradable, they require specific conditions that are not commonly available in most municipal waste management systems. This leads to improper disposal, contamination of recycling streams, and reduced environmental benefits. Emerging economies particularly struggle with the necessary investments needed to develop advanced composting and recycling plants. Moreover, public awareness regarding the correct disposal methods for bioplastics remains low, exacerbating the issue. Without significant improvements in waste management systems and consumer education, the full potential of bioplastics in reducing plastic pollution and environmental harm will remain unrealized, posing a significant challenge to the growth trajectory of the market.
By Product
Bio-Based Plasticizers held the largest market share, around 68%, in 2023. It is due to the increasing global emphasis on sustainable waste management and reducing environmental pollution. Biodegradable plastics, derived from renewable sources like corn starch, sugarcane, and cellulose, offer the critical advantage of breaking down naturally under composting conditions, thus minimizing landfill waste and ocean pollution. Additionally, the strong demand from sectors such as packaging, agriculture, and consumer goods, combined with growing investments in the development of cost-effective biodegradable solutions, has significantly contributed to this segment’s dominance. The rising environmental consciousness among consumers and industries has made biodegradable plastics the preferred choice, driving their leadership in the overall market.
By Application
Agriculture & Horticulture held the largest market share, around 34%, in 2023. It is due to the increasing demand for sustainable farming practices and eco-friendly agricultural inputs. Bioplastics and biopolymers are widely used in applications such as mulch films, plant pots, seed coatings, and greenhouse materials, offering significant benefits like biodegradability and soil health improvement. Farmers and horticulturists are increasingly adopting biodegradable mulch films to eliminate the need for plastic waste removal, thus saving labor costs and supporting environmental sustainability. Moreover, government regulations in regions like Europe and North America promoting biodegradable agricultural products have further fueled the segment’s growth. Advances in material innovation have also enhanced the durability and performance of bioplastics in outdoor conditions, making them a preferred alternative to conventional plastics. The growing global focus on sustainable agriculture and environmental protection strongly positions Agriculture & Horticulture as the leading end-use sector in the market.
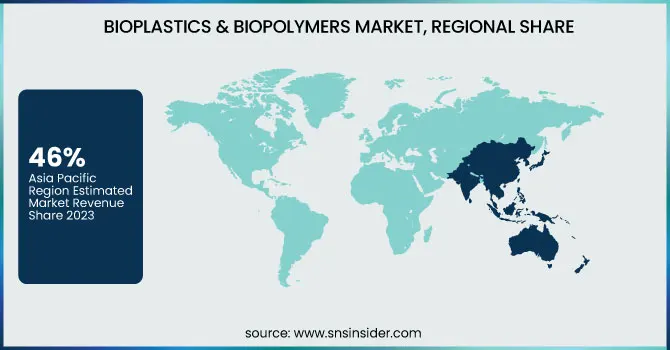
Asia Pacific held the largest market share, around 46%, in 2023. It is due to rapid industrialization, growing consumer awareness about sustainable products, and strong government support for green initiatives. Countries like China, Japan, India, and South Korea are heavily investing in bio-based material technologies to reduce dependence on fossil fuels and address environmental concerns. Additionally, the region’s large agricultural base and expanding packaging, consumer goods, and automotive sectors have created significant demand for eco-friendly materials. Initiatives such as China’s ban on single-use plastics and Japan’s "Bioplastics Roadmap" are driving the adoption of bioplastics across industries. Furthermore, the presence of key manufacturers and lower production costs in the region have strengthened Asia Pacific’s dominance. The combination of supportive policies, industrial growth, and a rising shift toward sustainable consumption patterns has firmly positioned Asia Pacific as the leading market.
North America held a significant market share. It is due to strong environmental regulations, growing demand for sustainable packaging, and increased investments in bio-based product innovations. The United States and Canada have actively promoted the adoption of biodegradable and compostable materials through supportive policies and funding for green technologies. Major players in the region are heavily investing in research and development to create advanced biopolymers that meet industrial performance standards while reducing carbon footprints. Additionally, the rising consumer preference for eco-friendly products across sectors like packaging, agriculture, consumer goods, and automotive has further fueled market expansion. Initiatives such as the U.S. Plastics Pact and Canada's Zero Plastic Waste Strategy are encouraging industries to shift towards sustainable alternatives, solidifying North America’s position as a key contributor to the global bioplastics and biopolymers market.
Get Customized Report as per Your Business Requirement - Enquiry Now
BASF SE (Ecoflex, Ecovio)
Evonik Industries AG (RESOMER, VESTAMID Terra)
Eastman Chemical Company (Tritan Renew, Naia)
Dow Chemical Company (Agility CE, ELVALOY)
Arkema Group (Rilsan Clear, Pebax Rnew)
Perstorp Holding AB (Capa, Akestra)
LG Chem Ltd. (IFB, LUCEL)
LANXESS AG (Durethan ECO, Pocan ECO)
ExxonMobil Chemical (Exxelor, Achieve Advanced PP)
UPC Technology Corporation (Biopolyol, Polymol)
Wacker Chemie AG (VINNEX, VINNAPAS Eco)
Asahi Kasei Corporation (TENAC, Leona)
Hexion Inc. (ECO-LOY, VeoVa)
PolyOne Corporation (OnFlex BIO, Geon BIO)
Shandong Hongxin Chemical Co., Ltd. (HX-BIO, HX-GREEN)
Grupa Azoty ZAK S.A. (BIO-ZAK, OXO-BIO)
Nan Ya Plastics Corporation (BioPET, BioPA)
Meltem Kimya (MELBIO, MELGREEN)
KLJ Group (KLJ 610 Bio, KLJ 810 Bio)
Vertellus Holdings LLC (Citroflex, FlexaTrac-DME)
In February 2024, BASF introduced Ecoflex F Blend, a new biodegradable plastic developed to improve compostability standards in flexible packaging applications.
In January 2024, Evonik broadened its RESOMER portfolio with the launch of medical-grade biodegradable polymers designed for advanced drug delivery systems.
In March 2024, Eastman expanded its Tritan Renew product line by introducing higher bio-content versions, focusing on applications in the consumer goods sector.
| Report Attributes | Details |
|---|---|
| Market Size in 2023 | USD12.90 Billion |
| Market Size by 2032 | USD90.29 Billion |
| CAGR | CAGR of24.14 % From 2024 to 2032 |
| Base Year | 2023 |
| Forecast Period | 2024-2032 |
| Historical Data | 2020-2022 |
| Report Scope & Coverage | Market Size, Segments Analysis, Competitive Landscape, Regional Analysis, DROC & SWOT Analysis, Forecast Outlook |
| Key Segments | • By Product (Biodegradable, Non-Biodegradable) •By Application (Packaging, Consumer Goods, Textiles, Agriculture & Horticulture, Automotive & Transportation, Coatings & Adhesives) |
| Regional Analysis/Coverage | North America (US, Canada, Mexico), Europe (Eastern Europe [Poland, Romania, Hungary, Turkey, Rest of Eastern Europe] Western Europe] Germany, France, UK, Italy, Spain, Netherlands, Switzerland, Austria, Rest of Western Europe]), Asia Pacific (China, India, Japan, South Korea, Vietnam, Singapore, Australia, Rest of Asia Pacific), Middle East & Africa (Middle East [UAE, Egypt, Saudi Arabia, Qatar, Rest of Middle East], Africa [Nigeria, South Africa, Rest of Africa], Latin America (Brazil, Argentina, Colombia, Rest of Latin America) |
| Company Profiles | BASF SE, Evonik Industries AG, Eastman Chemical Company, Dow Chemical Company, Arkema Group, Perstorp Holding AB, LG Chem Ltd., LANXESS AG, ExxonMobil Chemical, UPC Technology Corporation, Wacker Chemie AG, Asahi Kasei Corporation, Hexion Inc., PolyOne Corporation, Shandong Hongxin Chemical Co., Ltd., Grupa Azoty ZAK S.A., Nan Ya Plastics Corporation, Meltem Kimya, KLJ Group, Vertellus Holdings LLC |
Ans: The Bioplastics & Biopolymers Market was valued at USD 12.90 billion in 2023.
Ans: The expected CAGR of the global Bioplastics & Biopolymers Market during the forecast period is 24.14%.
Ans: The Biodegradable segment will grow rapidly in the Bioplastics & Biopolymers Market from 2024 to 2032.
Ans: Growing consumer preference for sustainable and biodegradable materials drives the bioplastics & biopolymers market growth.
Ans: Asia Pacific led the Bioplastics & Biopolymers Market in the region with the highest revenue share in 2023.
1. Introduction
1.1 Market Definition
1.2 Scope (Inclusion and Exclusions)
1.3 Research Assumptions
2. Executive Summary
2.1 Market Overview
2.2 Regional Synopsis
2.3 Competitive Summary
3. Research Methodology
3.1 Top-Down Approach
3.2 Bottom-up Approach
3.3. Data Validation
3.4 Primary Interviews
4. Market Dynamics Impact Analysis
4.1 Market Driving Factors Analysis
4.1.2 Drivers
4.1.2 Restraints
4.1.3 Opportunities
4.1.4 Challenges
4.2 PESTLE Analysis
4.3 Porter’s Five Forces Model
5. Statistical Insights and Trends Reporting
5.1 Production Capacity and Utilization by Country, By Type, 2023
5.2 Feedstock Prices by Country, and Type, 2023
5.3 Regulatory Impact by Country and By Type 2023.
5.4 Environmental Metrics: Emissions Data, Waste Management Practices, and Sustainability Initiatives by Region
5.5 Innovation and R&D, Type, 2023
6. Competitive Landscape
6.1 List of Major Companies By Region
6.2 Market Share Analysis By Region
6.3 Product Benchmarking
6.3.1 Product specifications and features
6.3.2 Pricing
6.4 Strategic Initiatives
6.4.1 Marketing and promotional activities
6.4.2 Distribution and Supply Chain Strategies
6.4.3 Expansion Plans and New Product Launches
6.4.4 Strategic partnerships and collaborations
6.5 Technological Advancements
6.6 Market Positioning and Branding
7. Bioplastics & Biopolymers Market Segmentation By Product
7.1 Chapter Overview
7.2 Biodegradable
7.2.1 Biodegradable Trend Analysis (2020-2032)
7.2.2 Biodegradable Market Size Estimates and Forecasts to 2032 (USD Billion)
7.3 Non-Biodegradable
7.3.1 Non-Biodegradable Market Trends Analysis (2020-2032)
7.3.2 Non-Biodegradable Market Size Estimates and Forecasts to 2032 (USD Billion)
8. Bioplastics & Biopolymers Market Segmentation By Application
8.1 Chapter Overview
8.2 Packaging
8.2.1 Packaging Market Trends Analysis (2020-2032)
8.2.2 Packaging Market Size Estimates and Forecasts to 2032 (USD Billion)
8.3 Consumer Goods
8.3.1 Consumer Goods Market Trends Analysis (2020-2032)
8.3.2 Consumer Goods Market Size Estimates and Forecasts to 2032 (USD Billion)
8.4 Textiles
8.4.1 Textiles Market Trends Analysis (2020-2032)
8.4.2 Textiles Market Size Estimates and Forecasts to 2032 (USD Billion)
8.4 Agriculture & Horticulture
8.4.1 Agriculture & Horticulture Market Trends Analysis (2020-2032)
8.4.2 Agriculture & Horticulture Market Size Estimates and Forecasts to 2032 (USD Billion)
8.5 Automotive & Transportation
8.5.1 Automotive & Transportation Market Trends Analysis (2020-2032)
8.5.2 Automotive & Transportation Market Size Estimates and Forecasts to 2032 (USD Billion)
8.6 Coatings & Adhesives
8.6.1 Coatings & Adhesives Market Trends Analysis (2020-2032)
8.6.2 Coatings & Adhesives Market Size Estimates and Forecasts to 2032 (USD Billion)
9. Regional Analysis
9.1 Chapter Overview
9.2 North America
9.2.1 Trends Analysis
9.2.2 North America Bioplastics & Biopolymers Market Estimates and Forecasts, by Country (2020-2032) (USD Billion)
9.2.3 North America Bioplastics & Biopolymers Market Estimates and Forecasts, By Product (2020-2032) (USD Billion)
9.2.4 North America Bioplastics & Biopolymers Market Estimates and Forecasts, By Application (2020-2032) (USD Billion)
9.2.5 USA
9.2.5.1 USA Bioplastics & Biopolymers Market Estimates and Forecasts, By Product (2020-2032) (USD Billion)
9.2.5.2 USA Bioplastics & Biopolymers Market Estimates and Forecasts, By Application (2020-2032) (USD Billion)
9.2.6 Canada
9.2.6.1 Canada Bioplastics & Biopolymers Market Estimates and Forecasts, By Product (2020-2032) (USD Billion)
9.2.6.2 Canada Bioplastics & Biopolymers Market Estimates and Forecasts, By Application (2020-2032) (USD Billion)
9.2.7 Mexico
9.2.7.1 Mexico Bioplastics & Biopolymers Market Estimates and Forecasts, By Product (2020-2032) (USD Billion)
9.2.7.2 Mexico Bioplastics & Biopolymers Market Estimates and Forecasts, By Application (2020-2032) (USD Billion)
9.3 Europe
9.3.1 Eastern Europe
9.3.1.1 Trends Analysis
9.3.1.2 Eastern Europe Bioplastics & Biopolymers Market Estimates and Forecasts, by Country (2020-2032) (USD Billion)
9.3.1.3 Eastern Europe Bioplastics & Biopolymers Market Estimates and Forecasts, By Product (2020-2032) (USD Billion)
9.3.1.4 Eastern Europe Bioplastics & Biopolymers Market Estimates and Forecasts, By Application (2020-2032) (USD Billion)
9.3.1.5 Poland
9.3.1.5.1 Poland Bioplastics & Biopolymers Market Estimates and Forecasts, By Product (2020-2032) (USD Billion)
9.3.1.5.2 Poland Bioplastics & Biopolymers Market Estimates and Forecasts, By Application (2020-2032) (USD Billion)
9.3.1.6 Romania
9.3.1.6.1 Romania Bioplastics & Biopolymers Market Estimates and Forecasts, By Product (2020-2032) (USD Billion)
9.3.1.6.2 Romania Bioplastics & Biopolymers Market Estimates and Forecasts, By Application (2020-2032) (USD Billion)
9.3.1.7 Hungary
9.3.1.7.1 Hungary Bioplastics & Biopolymers Market Estimates and Forecasts, By Product (2020-2032) (USD Billion)
9.3.1.7.2 Hungary Bioplastics & Biopolymers Market Estimates and Forecasts, By Application (2020-2032) (USD Billion)
9.3.1.8 Turkey
9.3.1.8.1 Turkey Bioplastics & Biopolymers Market Estimates and Forecasts, By Product (2020-2032) (USD Billion)
9.3.1.8.2 Turkey Bioplastics & Biopolymers Market Estimates and Forecasts, By Application (2020-2032) (USD Billion)
9.3.1.9 Rest of Eastern Europe
9.3.1.9.1 Rest of Eastern Europe Bioplastics & Biopolymers Market Estimates and Forecasts, By Product (2020-2032) (USD Billion)
9.3.1.9.2 Rest of Eastern Europe Bioplastics & Biopolymers Market Estimates and Forecasts, By Application (2020-2032) (USD Billion)
9.3.2 Western Europe
9.3.2.1 Trends Analysis
9.3.2.2 Western Europe Bioplastics & Biopolymers Market Estimates and Forecasts, by Country (2020-2032) (USD Billion)
9.3.2.3 Western Europe Bioplastics & Biopolymers Market Estimates and Forecasts, By Product (2020-2032) (USD Billion)
9.3.2.4 Western Europe Bioplastics & Biopolymers Market Estimates and Forecasts, By Application (2020-2032) (USD Billion)
9.3.2.5 Germany
9.3.2.5.1 Germany Bioplastics & Biopolymers Market Estimates and Forecasts, By Product (2020-2032) (USD Billion)
9.3.2.5.2 Germany Bioplastics & Biopolymers Market Estimates and Forecasts, By Application (2020-2032) (USD Billion)
9.3.2.6 France
9.3.2.6.1 France Bioplastics & Biopolymers Market Estimates and Forecasts, By Product (2020-2032) (USD Billion)
9.3.2.6.2 France Bioplastics & Biopolymers Market Estimates and Forecasts, By Application (2020-2032) (USD Billion)
9.3.2.7 UK
9.3.2.7.1 UK Bioplastics & Biopolymers Market Estimates and Forecasts, By Product (2020-2032) (USD Billion)
9.3.2.7.2 UK Bioplastics & Biopolymers Market Estimates and Forecasts, By Application (2020-2032) (USD Billion)
9.3.2.8 Italy
9.3.2.8.1 Italy Bioplastics & Biopolymers Market Estimates and Forecasts, By Product (2020-2032) (USD Billion)
9.3.2.8.2 Italy Bioplastics & Biopolymers Market Estimates and Forecasts, By Application (2020-2032) (USD Billion)
9.3.2.9 Spain
9.3.2.9.1 Spain Bioplastics & Biopolymers Market Estimates and Forecasts, By Product (2020-2032) (USD Billion)
9.3.2.9.2 Spain Bioplastics & Biopolymers Market Estimates and Forecasts, By Application (2020-2032) (USD Billion)
9.3.2.10 Netherlands
9.3.2.10.1 Netherlands Bioplastics & Biopolymers Market Estimates and Forecasts, By Product (2020-2032) (USD Billion)
9.3.2.10.2 Netherlands Bioplastics & Biopolymers Market Estimates and Forecasts, By Application (2020-2032) (USD Billion)
9.3.2.11 Switzerland
9.3.2.11.1 Switzerland Bioplastics & Biopolymers Market Estimates and Forecasts, By Product (2020-2032) (USD Billion)
9.3.2.11.2 Switzerland Bioplastics & Biopolymers Market Estimates and Forecasts, By Application (2020-2032) (USD Billion)
9.3.2.12 Austria
9.3.2.12.1 Austria Bioplastics & Biopolymers Market Estimates and Forecasts, By Product (2020-2032) (USD Billion)
9.3.2.12.2 Austria Bioplastics & Biopolymers Market Estimates and Forecasts, By Application (2020-2032) (USD Billion)
9.3.2.13 Rest of Western Europe
9.3.2.13.1 Rest of Western Europe Bioplastics & Biopolymers Market Estimates and Forecasts, By Product (2020-2032) (USD Billion)
9.3.2.13.2 Rest of Western Europe Bioplastics & Biopolymers Market Estimates and Forecasts, By Application (2020-2032) (USD Billion)
9.4 Asia Pacific
9.4.1 Trends Analysis
9.4.2 Asia Pacific Bioplastics & Biopolymers Market Estimates and Forecasts, by Country (2020-2032) (USD Billion)
9.4.3 Asia Pacific Bioplastics & Biopolymers Market Estimates and Forecasts, By Product (2020-2032) (USD Billion)
9.4.4 Asia Pacific Bioplastics & Biopolymers Market Estimates and Forecasts, By Application (2020-2032) (USD Billion)
9.4.5 China
9.4.5.1 China Bioplastics & Biopolymers Market Estimates and Forecasts, By Product (2020-2032) (USD Billion)
9.4.5.2 China Bioplastics & Biopolymers Market Estimates and Forecasts, By Application (2020-2032) (USD Billion)
9.4.6 India
9.4.5.1 India Bioplastics & Biopolymers Market Estimates and Forecasts, By Product (2020-2032) (USD Billion)
9.4.5.2 India Bioplastics & Biopolymers Market Estimates and Forecasts, By Application (2020-2032) (USD Billion)
9.4.5 Japan
9.4.5.1 Japan Bioplastics & Biopolymers Market Estimates and Forecasts, By Product (2020-2032) (USD Billion)
9.4.5.2 Japan Bioplastics & Biopolymers Market Estimates and Forecasts, By Application (2020-2032) (USD Billion)
9.4.6 South Korea
9.4.6.1 South Korea Bioplastics & Biopolymers Market Estimates and Forecasts, By Product (2020-2032) (USD Billion)
9.4.6.2 South Korea Bioplastics & Biopolymers Market Estimates and Forecasts, By Application (2020-2032) (USD Billion)
9.4.7 Vietnam
9.4.7.1 Vietnam Bioplastics & Biopolymers Market Estimates and Forecasts, By Product (2020-2032) (USD Billion)
9.2.7.2 Vietnam Bioplastics & Biopolymers Market Estimates and Forecasts, By Application (2020-2032) (USD Billion)
9.4.8 Singapore
9.4.8.1 Singapore Bioplastics & Biopolymers Market Estimates and Forecasts, By Product (2020-2032) (USD Billion)
9.4.8.2 Singapore Bioplastics & Biopolymers Market Estimates and Forecasts, By Application (2020-2032) (USD Billion)
9.4.9 Australia
9.4.9.1 Australia Bioplastics & Biopolymers Market Estimates and Forecasts, By Product (2020-2032) (USD Billion)
9.4.9.2 Australia Bioplastics & Biopolymers Market Estimates and Forecasts, By Application (2020-2032) (USD Billion)
9.4.10 Rest of Asia Pacific
9.4.10.1 Rest of Asia Pacific Bioplastics & Biopolymers Market Estimates and Forecasts, By Product (2020-2032) (USD Billion)
9.4.10.2 Rest of Asia Pacific Bioplastics & Biopolymers Market Estimates and Forecasts, By Application (2020-2032) (USD Billion)
9.5 Middle East and Africa
9.5.1 Middle East
9.5.1.1 Trends Analysis
9.5.1.2 Middle East Bioplastics & Biopolymers Market Estimates and Forecasts, by Country (2020-2032) (USD Billion)
9.5.1.3 Middle East Bioplastics & Biopolymers Market Estimates and Forecasts, By Product (2020-2032) (USD Billion)
9.5.1.4 Middle East Bioplastics & Biopolymers Market Estimates and Forecasts, By Application (2020-2032) (USD Billion)
9.5.1.5 UAE
9.5.1.5.1 UAE Bioplastics & Biopolymers Market Estimates and Forecasts, By Product (2020-2032) (USD Billion)
9.5.1.5.2 UAE Bioplastics & Biopolymers Market Estimates and Forecasts, By Application (2020-2032) (USD Billion)
9.5.1.6 Egypt
9.5.1.6.1 Egypt Bioplastics & Biopolymers Market Estimates and Forecasts, By Product (2020-2032) (USD Billion)
9.5.1.6.2 Egypt Bioplastics & Biopolymers Market Estimates and Forecasts, By Application (2020-2032) (USD Billion)
9.5.1.7 Saudi Arabia
9.5.1.7.1 Saudi Arabia Bioplastics & Biopolymers Market Estimates and Forecasts, By Product (2020-2032) (USD Billion)
9.5.1.7.2 Saudi Arabia Bioplastics & Biopolymers Market Estimates and Forecasts, By Application (2020-2032) (USD Billion)
9.5.1.8 Qatar
9.5.1.8.1 Qatar Bioplastics & Biopolymers Market Estimates and Forecasts, By Product (2020-2032) (USD Billion)
9.5.1.8.2 Qatar Bioplastics & Biopolymers Market Estimates and Forecasts, By Application (2020-2032) (USD Billion)
9.5.1.9 Rest of Middle East
9.5.1.9.1 Rest of Middle East Bioplastics & Biopolymers Market Estimates and Forecasts, By Product (2020-2032) (USD Billion)
9.5.1.9.2 Rest of Middle East Bioplastics & Biopolymers Market Estimates and Forecasts, By Application (2020-2032) (USD Billion)
9.5.2 Africa
9.5.2.1 Trends Analysis
9.5.2.2 Africa Bioplastics & Biopolymers Market Estimates and Forecasts, by Country (2020-2032) (USD Billion)
9.5.2.3 Africa Bioplastics & Biopolymers Market Estimates and Forecasts, By Product (2020-2032) (USD Billion)
9.5.2.4 Africa Bioplastics & Biopolymers Market Estimates and Forecasts, By Application (2020-2032) (USD Billion)
9.5.2.5 South Africa
9.5.2.5.1 South Africa Bioplastics & Biopolymers Market Estimates and Forecasts, By Product (2020-2032) (USD Billion)
9.5.2.5.2 South Africa Bioplastics & Biopolymers Market Estimates and Forecasts, By Application (2020-2032) (USD Billion)
9.5.2.6 Nigeria
9.5.2.6.1 Nigeria Bioplastics & Biopolymers Market Estimates and Forecasts, By Product (2020-2032) (USD Billion)
9.5.2.6.2 Nigeria Bioplastics & Biopolymers Market Estimates and Forecasts, By Application (2020-2032) (USD Billion)
9.6 Latin America
9.6.1 Trends Analysis
9.6.2 Latin America Bioplastics & Biopolymers Market Estimates and Forecasts, by Country (2020-2032) (USD Billion)
9.6.3 Latin America Bioplastics & Biopolymers Market Estimates and Forecasts, By Product (2020-2032) (USD Billion)
9.6.4 Latin America Bioplastics & Biopolymers Market Estimates and Forecasts, By Application (2020-2032) (USD Billion)
9.6.5 Brazil
9.6.5.1 Brazil Bioplastics & Biopolymers Market Estimates and Forecasts, By Product (2020-2032) (USD Billion)
9.6.5.2 Brazil Bioplastics & Biopolymers Market Estimates and Forecasts, By Application (2020-2032) (USD Billion)
9.6.6 Argentina
9.6.6.1 Argentina Bioplastics & Biopolymers Market Estimates and Forecasts, By Product (2020-2032) (USD Billion)
9.6.6.2 Argentina Bioplastics & Biopolymers Market Estimates and Forecasts, By Application (2020-2032) (USD Billion)
9.6.7 Colombia
9.6.7.1 Colombia Bioplastics & Biopolymers Market Estimates and Forecasts, By Product (2020-2032) (USD Billion)
9.6.7.2 Colombia Bioplastics & Biopolymers Market Estimates and Forecasts, By Application (2020-2032) (USD Billion)
9.6.8 Rest of Latin America
9.6.8.1 Rest of Latin America Bioplastics & Biopolymers Market Estimates and Forecasts, By Product (2020-2032) (USD Billion)
9.6.8.2 Rest of Latin America Bioplastics & Biopolymers Market Estimates and Forecasts, By Application (2020-2032) (USD Billion)
10. Company Profiles
10.1 BASF SE
10.1.1 Company Overview
10.1.2 Financial
10.1.3 Product / Services Offered
10.1.4 SWOT Analysis
10.2 Evonik Industries AG
10.2.1 Company Overview
10.2.2 Financial
10.2.3 Product/ Services Offered
10.2.4 SWOT Analysis
10.3 Eastman Chemical Company
10.3.1 Company Overview
10.3.2 Financial
10.3.3 Product/ Services Offered
10.3.4 SWOT Analysis
10.4 The Dow Chemical Company
10.4.1 Company Overview
10.4.2 Financial
10.4.3 Product/ Services Offered
10.4.4 SWOT Analysis
10.5 Arkema Group
10.5.1 Company Overview
10.5.2 Financial
10.5.3 Product/ Services Offered
10.5.4 SWOT Analysis
10.6 Perstorp Holding AB
10.6.1 Company Overview
10.6.2 Financial
10.6.3 Product/ Services Offered
10.6.4 SWOT Analysis
10.7 LG Chem Ltd.
10.7.1 Company Overview
10.7.2 Financial
10.7.3 Product/ Services Offered
10.7.4 SWOT Analysis
10.8 LANXESS AG
10.8.1 Company Overview
10.8.2 Financial
10.8.3 Product/ Services Offered
10.8.4 SWOT Analysis
10.9 ExxonMobil Chemical
10.9.1 Company Overview
10.9.2 Financial
10.9.3 Product/ Services Offered
10.9.4 SWOT Analysis
10.10 UPC Technology Corporation
10.10.1 Company Overview
10.10.2 Financial
10.10.3 Product/ Services Offered
10.10.4 SWOT Analysis
11. Use Cases and Best Practices
12. Conclusion
An accurate research report requires proper strategizing as well as implementation. There are multiple factors involved in the completion of good and accurate research report and selecting the best methodology to compete the research is the toughest part. Since the research reports we provide play a crucial role in any company’s decision-making process, therefore we at SNS Insider always believe that we should choose the best method which gives us results closer to reality. This allows us to reach at a stage wherein we can provide our clients best and accurate investment to output ratio.
Each report that we prepare takes a timeframe of 350-400 business hours for production. Starting from the selection of titles through a couple of in-depth brain storming session to the final QC process before uploading our titles on our website we dedicate around 350 working hours. The titles are selected based on their current market cap and the foreseen CAGR and growth.
The 5 steps process:
Step 1: Secondary Research:
Secondary Research or Desk Research is as the name suggests is a research process wherein, we collect data through the readily available information. In this process we use various paid and unpaid databases which our team has access to and gather data through the same. This includes examining of listed companies’ annual reports, Journals, SEC filling etc. Apart from this our team has access to various associations across the globe across different industries. Lastly, we have exchange relationships with various university as well as individual libraries.

Step 2: Primary Research
When we talk about primary research, it is a type of study in which the researchers collect relevant data samples directly, rather than relying on previously collected data. This type of research is focused on gaining content specific facts that can be sued to solve specific problems. Since the collected data is fresh and first hand therefore it makes the study more accurate and genuine.
We at SNS Insider have divided Primary Research into 2 parts.
Part 1 wherein we interview the KOLs of major players as well as the upcoming ones across various geographic regions. This allows us to have their view over the market scenario and acts as an important tool to come closer to the accurate market numbers. As many as 45 paid and unpaid primary interviews are taken from both the demand and supply side of the industry to make sure we land at an accurate judgement and analysis of the market.
This step involves the triangulation of data wherein our team analyses the interview transcripts, online survey responses and observation of on filed participants. The below mentioned chart should give a better understanding of the part 1 of the primary interview.

Part 2: In this part of primary research the data collected via secondary research and the part 1 of the primary research is validated with the interviews from individual consultants and subject matter experts.
Consultants are those set of people who have at least 12 years of experience and expertise within the industry whereas Subject Matter Experts are those with at least 15 years of experience behind their back within the same space. The data with the help of two main processes i.e., FGDs (Focused Group Discussions) and IDs (Individual Discussions). This gives us a 3rd party nonbiased primary view of the market scenario making it a more dependable one while collation of the data pointers.
Step 3: Data Bank Validation
Once all the information is collected via primary and secondary sources, we run that information for data validation. At our intelligence centre our research heads track a lot of information related to the market which includes the quarterly reports, the daily stock prices, and other relevant information. Our data bank server gets updated every fortnight and that is how the information which we collected using our primary and secondary information is revalidated in real time.

Step 4: QA/QC Process
After all the data collection and validation our team does a final level of quality check and quality assurance to get rid of any unwanted or undesired mistakes. This might include but not limited to getting rid of the any typos, duplication of numbers or missing of any important information. The people involved in this process include technical content writers, research heads and graphics people. Once this process is completed the title gets uploader on our platform for our clients to read it.
Step 5: Final QC/QA Process:
This is the last process and comes when the client has ordered the study. In this process a final QA/QC is done before the study is emailed to the client. Since we believe in giving our clients a good experience of our research studies, therefore, to make sure that we do not lack at our end in any way humanly possible we do a final round of quality check and then dispatch the study to the client.
By Product
Biodegradable
Non-Biodegradable
By Application
Packaging
Consumer Goods
Textiles
Agriculture & Horticulture
Automotive & Transportation
Coatings & Adhesives
Request for Segment Customization as per your Business Requirement: Segment Customization Request
North America
US
Canada
Mexico
Europe
Eastern Europe
Poland
Romania
Hungary
Turkey
Rest of Eastern Europe
Western Europe
Germany
France
UK
Italy
Spain
Netherlands
Switzerland
Austria
Rest of Western Europe
Asia Pacific
China
India
Japan
South Korea
Vietnam
Singapore
Australia
Rest of Asia Pacific
Middle East & Africa
Middle East
UAE
Egypt
Saudi Arabia
Qatar
Rest of Middle East
Africa
Nigeria
South Africa
Rest of Africa
Latin America
Brazil
Argentina
Colombia
Rest of Latin America
Request for Country Level Research Report: Country Level Customization Request
Available Customization
With the given market data, SNS Insider offers customization as per the company’s specific needs. The following customization options are available for the report:
Detailed Volume Analysis
Criss-Cross segment analysis (e.g. Product X Application)
Competitive Product Benchmarking
Geographic Analysis
Additional countries in any of the regions
Customized Data Representation
Detailed analysis and profiling of additional market players
The Aluminum Extrusion Market Size was valued at USD 84.26 billion in 2023 and is expected to reach USD 165.32 billion by 2032 and grow at a CAGR of 8.88% over the forecast period 2024-2032.
The Offshore Drilling Fluid Market Size was valued at USD 4.10 Billion in 2023 and is expected to reach USD 6.36 Billion by 2032, growing at a CAGR of 5.01% over the forecast period of 2024-2032.
Magnesium Oxide Board Market size was USD 1.64 billion in 2023 and is expected to Reach USD 2.62 billion by 2032 and grow at a CAGR of 5.35% from 2024-2032.
The Industrial Wastewater Treatment Chemicals Market Size was valued at USD 15.28 billion in 2023, and is expected to reach USD 23.58 billion by 2032, and grow at a CAGR of 5.66% over the forecast period 2024-2032.
The Bookbinding Adhesives Market Size was valued at USD 1.93 Billion in 2023 and is expected to reach USD 2.50 Billion by 2032, growing at a CAGR of 2.95% over the forecast period of 2024-2032.
The Emollients Market size was valued at USD 1.70 Billion in 2023. It is expected to grow to USD 2.61 Billion by 2032 & grow at a CAGR of 4.9% by 2024-2032.

Hi! Click one of our member below to chat on Phone
© 2025 All Rights Reserved by SNS Insider Pvt Ltd


