image

Biometric Sensor Market Size:
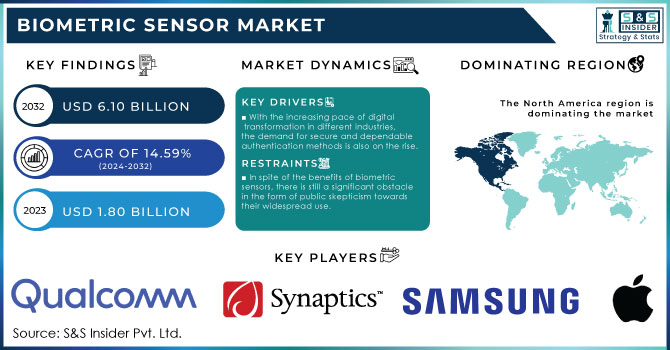
Biometric Sensor Market Revenue Analysis

Get More Information on Biometric Sensor Market - Request Sample Report

The Biometric Sensor Market size was valued at USD 1.80 Billion in 2023. It is estimated to reach USD 6.10 Billion by 2032, growing at a CAGR of 14.59% during 2024-2032.

The biometric sensor market has experienced substantial growth in recent years, fueled by technological advancements, heightened security concerns, and an increasing demand for personalized user experiences. Traditional security measures, such as passwords and PINs, are becoming less effective against the rising tide of cyberattacks and identity theft. In contrast, biometric authentication offers a more secure and reliable method of authentication by leveraging unique physiological traits that are difficult to replicate. The adoption of biometric technology on smartphones is particularly notable, with a remarkable 81% of devices now enabling features like fingerprint sensors and facial recognition technology. This shift is mirrored in the travel sector, where the usage of biometrics at airports has surged significantly; 46% of passengers utilized these systems in 2023, up from 34% in 2022. Additionally, a striking 75% of travelers now prefer biometric solutions over traditional identification methods. In the United States, more than 176 million people engage with facial recognition technology, with 68% using it to unlock their devices. The acceptance of this technology for safety measures is notably high, particularly among travelers, with 55% supporting its use in airports and 54% in banking institutions.

The banking sector is also witnessing a transformation in customer authentication processes through biometric sensors. Financial institutions are increasingly implementing fingerprint and facial recognition systems within mobile banking applications. This innovation not only enhances security but also significantly improves the overall customer experience, making transactions quicker and more user-friendly. Furthermore, biometric authentication helps mitigate the risk of fraudulent activities, a critical concern for financial institutions in today's digital age.

Market Dynamics

Drivers

  • With the increasing pace of digital transformation in different industries, the demand for secure and dependable authentication methods is also on the rise.

Conventional security measures like passwords and PINs are being viewed as insufficient because of their susceptibility to hacking and social engineering tactics. This has caused organizations to investigate biometric authentication as a more secure option. By examining distinct physical or behavioral traits, biometric sensors enhance security by allowing only authorized persons to reach sensitive data or areas. The growing occurrence of cyber threats and data breaches continues to drive the need for innovative security solutions. Biometric technologies like fingerprint, facial recognition, iris scanning, and voice recognition are becoming more popular in diverse areas, such as mobile devices, financial services, and physical access control systems. Organizations are eager to introduce biometric systems to improve security and user convenience by removing the necessity of recalling complicated passwords. Furthermore, with increased regulations on data protection, businesses are facing the demand to implement strong authentication methods, driving the expansion of the biometric sensor industry.

  • Governments across the globe are more and more acknowledging the advantages of biometric technology in improving national security and public safety.

Biometric systems are being used for a range of purposes, such as verifying identity, controlling borders, and conducting criminal investigations. Governments are using biometric sensors in passport control, national identification programs, and law enforcement databases to verify identification and deter identity theft. The use of biometric systems in law enforcement agencies is especially significant because they help with criminal identification and tracking. Facial recognition technology allows law enforcement to compare images captured by surveillance cameras with databases containing information on known criminals. These applications not only increase the efficiency of policing but also enhance public safety, leading to government funding in biometric technology. The rising demand for strong identity management systems in government operations is anticipated to drive the expansion of the biometric sensor market.

Restraints

  • In spite of the benefits of biometric sensors, there is still a significant obstacle in the form of public skepticism towards their widespread use. 

A lot of people are cautious about new technologies, particularly ones that gather personal data. Worries about privacy, security, and the possibility of surveillance may cause a lack of faith in biometric systems. This doubt may result in a reluctance to use biometric technology, even in places where it could improve security and convenience. Organizations need to educate consumers about the advantages of biometric technologies and deal with their worries to promote acceptance. Building trust and promoting adoption could be hindered in the biometric sensor market due to the difficulty of overcoming public skepticism, which may impede its growth.

Market Segmentation

By Product

Optical sensors led with a 42% market share in 2023 in the biometric sensor market because of their broad range of uses and consistent functionality. These sensors use light to identify and secure biometric information like fingerprints, facial characteristics, and iris designs. Optical sensors are preferred for their precision and quickness in identification tasks, making them perfect for security systems, smartphones, and access control applications. Apple and Samsung have incorporated advanced optical fingerprint sensors in their smartphones, offering users secure and convenient authentication options.

The thermal sensor segment is experiencing rapid growth in the biometric sensor market due to the rising need for contactless identification options. These sensors can identify specific thermal patterns related to various biometrics like faces and bodies by detecting the heat given off by people. FLIR Systems and Honeywell are at the forefront with cutting-edge thermal imaging solutions that make quick, hands-free screening possible. Moreover, the incorporation of thermal sensors in security systems and smart devices is gaining popularity, as these sensors provide a reliable way to improve biometric security without the need for physical contact, meeting the rising demand for cleanliness and safety in technology.
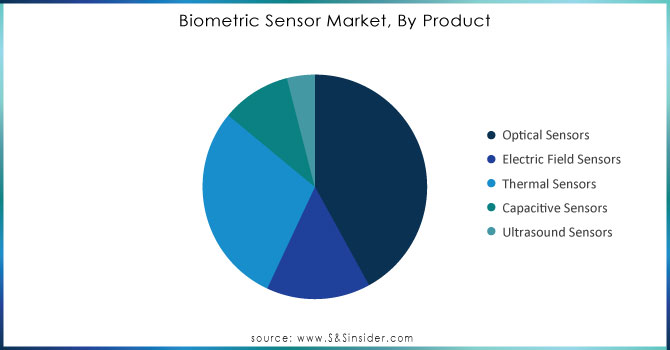
Biometric-Sensor-Market-By-Product.

Need Any Customization Research On Biometric Sensor Market - Inquiry Now

By Application

The finger scan segment dominated with a 35% market share in the biometric sensor market in 2023 due to its widespread adoption and established technology. Fingerprint recognition is user-friendly, cost-effective, and offers high accuracy, making it a preferred choice for various applications such as mobile devices, access control systems, and time attendance solutions. Companies like Apple and Samsung have integrated fingerprint scanners into their smartphones, allowing users to unlock devices and authorize transactions seamlessly.

The facial scan segment is expected to become the fastest-growing during 2024-2032 within the biometric sensor market, fueled by advancements in artificial intelligence and machine learning technologies. Facial recognition systems have gained traction in various sectors, including retail, security, and healthcare, for applications such as customer identification, attendance tracking, and secure access control. Companies like Amazon and Facebook are leveraging facial recognition technology to enhance user experiences, such as automating photo tagging and improving security protocols.

Regional Analysis

North America held a market share of 30% in 2023 in the biometric sensor market, driven by advanced technological infrastructure, a strong emphasis on security, and significant investment in research and development. The increasing need for biometric solutions in the area is driven by different uses in industries like healthcare, banking, and government services. Large corporations like Apple and Microsoft have incorporated biometric technologies, like fingerprint and facial recognition, into their products to improve user authentication and security.

The Asia-Pacific region is anticipated to become the fastest-growing during 2024-2032 largely due to the rapid adoption of biometric technologies across various sectors. Nations such as China, India, and Japan are making significant investments in biometric technology for use in security, financial services, and smart city initiatives. One example is the widespread use of China's facial recognition technology in city surveillance and public safety measures, with firms such as SenseTime at the forefront of AI-based biometric solutions. Moreover, India's efforts to promote digital identification with projects like Aadhaar underscore the increasing significance of biometric verification in the area.
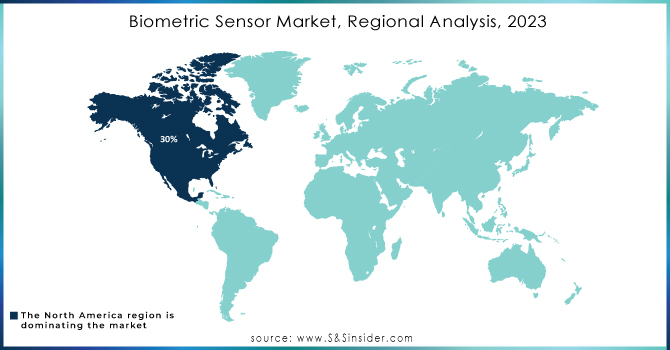
Biometric-Sensor-Market-Regional-Analysis-2023

Key Players

The key players in the Biometric Sensor Market are:

  • Apple Inc. (Touch ID, Face ID)

  • Samsung Electronics (Galaxy S20 Fingerprint Scanner, Galaxy Note 20 Ultra Facial Recognition)

  • Synaptics Incorporated (Natural ID Fingerprint Sensors, Clear ID Fingerprint Sensors)

  • Qualcomm (Snapdragon Sense ID, 3D Sonic Sensor)

  • HID Global (Fargo DTC4500e Card Printer, Biometrics Authentication Solutions)

  • NEC Corporation (NeoFace Facial Recognition, Bio-Idiom Fingerprint Authentication)

  • Thales Group (Gemalto Cogent Automated Biometric Identification System, Fingerprint Sensors)

  • Idemia (Morphowave Compact, MorphoSmart 3D Fingerprint Reader)

  • Crossmatch (Verifinger SDK, Guardian Fingerprint Scanner)

  • Silead Inc. (G+ Fingerprint Sensor, S-Fingerprint Sensor)

  • HoloSens (HoloFace Facial Recognition System, HoloFinger Fingerprint Sensor)

  • Integrated Biometrics (Columbo Fingerprint Scanner, Sherlock Fingerprint Scanner)

  • Hikvision (DS-K1T671TM-3XF Face Recognition Terminal, DS-K1T331W Fingerprint Terminal)

  • Fingerprints AB (T-Shape Fingerprint Sensor, FPC1025 Sensor)

  • Cypress Semiconductor (CapSense Fingerprint Sensors, TrueTouch Fingerprint Solutions)

  • Gemalto (Cinterion M2M Modules, Biometric Passport Readers)

  • ZKTeco (iClock Series Biometric Time Attendance, F18 Fingerprint Reader)

  • Biometric Security Solutions (SecurOS Biometric, Biometric Access Control)

  • M2SYS Technology (M2SYS Hybrid Biometric Platform, Bio-Plugin Fingerprint SDK)

  • AuthenTec (now part of Apple) (AES2810 Fingerprint Sensor, AES1660 Fingerprint Sensor)

Component Suppliers

  • Texas Instruments (Microcontrollers, Signal Processors)

  • NXP Semiconductors (RFID Chips, Secure Elements)

  • STMicroelectronics (MEMS Sensors, Microcontrollers)

  • Infineon Technologies (Security Controllers, Fingerprint Sensors)

  • Analog Devices (Signal Processing Components, ADCs)

  • ON Semiconductor (Thermal Sensors Sensors, Microcontrollers)

  • Microchip Technology (MCUs, ADCs)

  • Vishay Intertechnology (Resistors, Capacitors)

Recent Development

  • Oct 2024: Infineon Technologies launched two freshly-developed fingerprint sensor ICs, named CYFP10020A00 and CYFP10020S00, specifically crafted for biometric verification in automobiles.

  • July 2024: Google plans to release the long-awaited Pixel 9 series on August 13, ahead of its typical launch timeline. Anticipated upgrades in the upcoming series include a revamped look.

  • September 2024: TVS Electronics Limited (TVS-E), a top competitor in the electronics manufacturing industry, has introduced its Biometric Security Solutions, providing comprehensive electronic solutions from design to end-of-life services.

Biometric Sensor Market Report Scope:

Report Attributes Details
Market Size in 2023 USD 1.80 Billion 
Market Size by 2032 USD 6.10 Billion 
CAGR CAGR of 14.59% From 2024 to 2032
Base Year 2023
Forecast Period 2024-2032
Historical Data 2020-2022
Report Scope & Coverage Market Size, Segments Analysis, Competitive  Landscape, Regional Analysis, DROC & SWOT Analysis, Forecast Outlook
Key Segments • By Product (Optical Sensors, Electric Field Sensors, Thermal Sensors, Capacitive Sensors, Ultrasound Sensors)
• By Application (Finger Scan, Facial Scan, Hand Scan, Voice Scan, Vein Scan, Iris Scan)
• By End User (Consumer Electronics, Construction, Defense, Medical, BFSI, Others)
Regional Analysis/Coverage North America (US, Canada, Mexico), Europe (Eastern Europe [Poland, Romania, Hungary, Turkey, Rest of Eastern Europe] Western Europe] Germany, France, UK, Italy, Spain, Netherlands, Switzerland, Austria, Rest of Western Europe]), Asia Pacific (China, India, Japan, South Korea, Vietnam, Singapore, Australia, Rest of Asia Pacific), Middle East & Africa (Middle East [UAE, Egypt, Saudi Arabia, Qatar, Rest of Middle East], Africa [Nigeria, South Africa, Rest of Africa], Latin America (Brazil, Argentina, Colombia, Rest of Latin America)
Company Profiles Apple Inc., Samsung Electronics, Synaptics Incorporated, Qualcomm, HID Global, NEC Corporation, Thales Group, Idemia, Crossmatch, Silead Inc., HoloSens, Integrated Biometrics, Hikvision, Fingerprints AB, Cypress Semiconductor, Gemalto, ZKTeco, Biometric Security Solutions, M2SYS Technology, AuthenTec.
Key Drivers • With the increasing pace of digital transformation in different industries, the demand for secure and dependable authentication methods is also on the rise.
• Governments across the globe are more and more acknowledging the advantages of biometric technology in improving national security and public safety. 
Restraints • In spite of the benefits of biometric sensors, there is still a significant obstacle in the form of public skepticism towards their widespread use.

Frequently Asked Questions

Ans:  The Biometric Sensor Market is expected to grow at a CAGR of 14.59% during 2024-2032.

Ans: Biometric Sensor Market size was USD 1.80 Billion in 2023 and is expected to Reach USD 6.10 Billion by 2032.

Ans: Governments across the globe are more and more acknowledging the advantages of biometric technology in improving national security and public safety.

Ans: The optical sensors segment dominated the Biometric Sensor Market.

Ans: North America dominated the Biometric Sensor Market in 2023.

Table of Contents

1. Introduction

1.1 Market Definition

1.2 Scope (Inclusion and Exclusions)

1.3 Research Assumptions

2. Executive Summary

2.1 Market Overview

2.2 Regional Synopsis

2.3 Competitive Summary

3. Research Methodology

3.1 Top-Down Approach

3.2 Bottom-up Approach

3.3. Data Validation

3.4 Primary Interviews

4. Market Dynamics Impact Analysis

4.1 Market Driving Factors Analysis

4.1.1 Drivers

4.1.2 Restraints

4.1.3 Opportunities

4.1.4 Challenges

4.2 PESTLE Analysis

4.3 Porter’s Five Forces Model

5. Statistical Insights and Trends Reporting

5.1 Biometric Sensor User Adoption Rates by Region

     5.2 Consumer Trends, by Region (2023)

     5.3 Regulatory Impact

     5.4 Supply Chain Analysis

6. Competitive Landscape

6.1 List of Major Companies, By Region

6.2 Market Share Analysis, By Region

6.3 Product Benchmarking

6.3.1 Product specifications and features

6.3.2 Pricing

6.4 Strategic Initiatives

6.4.1 Marketing and promotional activities

6.4.2 Distribution and supply chain strategies

6.4.3 Expansion plans and new product launches

6.4.4 Strategic partnerships and collaborations

6.5 Technological Advancements

6.6 Market Positioning and Branding

7. Biometric Sensor Market Segmentation, by Product

7.1 Chapter Overview

7.2 Optical Sensors

7.2.1 Optical Sensors Market Trends Analysis (2020-2032)

7.2.2 Optical Sensors Market Size Estimates and Forecasts to 2032 (USD Billion)

7.3 Electric Field Sensors

7.3.1 Electric Field Sensors Market Trends Analysis (2020-2032)

7.3.2 Electric Field Sensors Market Size Estimates and Forecasts to 2032 (USD Billion)

7.4 Thermal Sensors

7.4.1 Thermal Sensors Market Trends Analysis (2020-2032)

7.4.2 Thermal Sensors Market Size Estimates and Forecasts to 2032 (USD Billion)

7.5 Capacitive Sensors

7.5.1 Capacitive Sensors Market Trends Analysis (2020-2032)

7.5.2 Capacitive Sensors Market Size Estimates and Forecasts to 2032 (USD Billion)

7.6 Ultrasound Sensors

7.6.1 Ultrasound Sensors Market Trends Analysis (2020-2032)

7.6.2 Ultrasound Sensors Market Size Estimates and Forecasts to 2032 (USD Billion)

8. Biometric Sensor Market Segmentation, by Applications

8.1 Chapter Overview

8.2 Finger Scan

8.2.1 Finger Scan Market Trends Analysis (2020-2032)

8.2.2 Finger Scan Market Size Estimates and Forecasts to 2032 (USD Billion)

8.3 Facial Scan

8.3.1 Facial Scan Market Trends Analysis (2020-2032)

8.3.2 Facial Scan Market Size Estimates and Forecasts to 2032 (USD Billion)

8.4 Hand Scan

8.4.1 Hand Scan Market Trends Analysis (2020-2032)

8.4.2 Hand Scan Market Size Estimates and Forecasts to 2032 (USD Billion)

8.5 Voice Scan

8.5.1 Voice Scan Market Trends Analysis (2020-2032)

8.5.2 Voice Scan Market Size Estimates and Forecasts to 2032 (USD Billion)

8.6 Vein Scan

8.6.1 Vein Scan Market Trends Analysis (2020-2032)

8.6.2 Vein Scan Market Size Estimates and Forecasts to 2032 (USD Billion)

8.7 Iris Scan

8.7.1 Iris Scan Market Trends Analysis (2020-2032)

8.7.2 Iris Scan Market Size Estimates and Forecasts to 2032 (USD Billion)

9. Biometric Sensor Market Segmentation, by End User

9.1 Chapter Overview

9.2 Consumer electronics

9.2.1 Consumer electronics Market Trends Analysis (2020-2032)

9.2.2 Consumer electronics Market Size Estimates and Forecasts to 2032 (USD Billion)

9.3 Construction

9.3.1 Construction Market Trends Analysis (2020-2032)

9.3.2 Construction Market Size Estimates and Forecasts to 2032 (USD Billion)

9.4 Defense

9.4.1 Defense Market Trends Analysis (2020-2032)

9.4.2 Defense Market Size Estimates and Forecasts to 2032 (USD Billion)

9.5 Medical

9.5.1 Medical Market Trends Analysis (2020-2032)

9.5.2 Medical Market Size Estimates and Forecasts to 2032 (USD Billion)

9.6 BFSI

9.6.1 BFSI Market Trends Analysis (2020-2032)

9.6.2 BFSI Market Size Estimates and Forecasts to 2032 (USD Billion)

9.7 Others

9.7.1 Others Market Trends Analysis (2020-2032)

9.7.2 Others Market Size Estimates and Forecasts to 2032 (USD Billion)

10. Regional Analysis

10.1 Chapter Overview

10.2 North America

10.2.1 Trends Analysis

10.2.2 North America Biometric Sensor Market Estimates and Forecasts, by Country (2020-2032) (USD Billion)

10.2.3 North America Biometric Sensor Market Estimates and Forecasts, by Product (2020-2032) (USD Billion)  

10.2.4 North America Biometric Sensor Market Estimates and Forecasts, by Applications (2020-2032) (USD Billion)

10.2.5 North America Biometric Sensor Market Estimates and Forecasts, by End User (2020-2032) (USD Billion)

10.2.6 USA

10.2.6.1 USA Biometric Sensor Market Estimates and Forecasts, by Product (2020-2032) (USD Billion)

10.2.6.2 USA Biometric Sensor Market Estimates and Forecasts, by Applications (2020-2032) (USD Billion)

10.2.6.3 USA Biometric Sensor Market Estimates and Forecasts, by End User (2020-2032) (USD Billion)

10.2.7 Canada

10.2.7.1 Canada Biometric Sensor Market Estimates and Forecasts, by Product (2020-2032) (USD Billion)

10.2.7.2 Canada Biometric Sensor Market Estimates and Forecasts, by Applications (2020-2032) (USD Billion)

10.2.7.3 Canada Biometric Sensor Market Estimates and Forecasts, by End User (2020-2032) (USD Billion)

10.2.8 Mexico

10.2.8.1 Mexico Biometric Sensor Market Estimates and Forecasts, by Product (2020-2032) (USD Billion)

10.2.8.2 Mexico Biometric Sensor Market Estimates and Forecasts, by Applications (2020-2032) (USD Billion)

10.2.8.3 Mexico Biometric Sensor Market Estimates and Forecasts, by End User (2020-2032) (USD Billion)

10.3 Europe

10.3.1 Eastern Europe

10.3.1.1 Trends Analysis

10.3.1.2 Eastern Europe Biometric Sensor Market Estimates and Forecasts, by Country (2020-2032) (USD Billion)

10.3.1.3 Eastern Europe Biometric Sensor Market Estimates and Forecasts, by Product (2020-2032) (USD Billion)  

10.3.1.4 Eastern Europe Biometric Sensor Market Estimates and Forecasts, by Applications (2020-2032) (USD Billion)

10.3.1.5 Eastern Europe Biometric Sensor Market Estimates and Forecasts, by End User (2020-2032) (USD Billion)

10.3.1.6 Poland

10.3.1.6.1 Poland Biometric Sensor Market Estimates and Forecasts, by Product (2020-2032) (USD Billion)

10.3.1.6.2 Poland Biometric Sensor Market Estimates and Forecasts, by Applications (2020-2032) (USD Billion)

10.3.1.6.3 Poland Biometric Sensor Market Estimates and Forecasts, by End User (2020-2032) (USD Billion)

10.3.1.7 Romania

10.3.1.7.1 Romania Biometric Sensor Market Estimates and Forecasts, by Product (2020-2032) (USD Billion)

10.3.1.7.2 Romania Biometric Sensor Market Estimates and Forecasts, by Applications (2020-2032) (USD Billion)

10.3.1.7.3 Romania Biometric Sensor Market Estimates and Forecasts, by End User (2020-2032) (USD Billion)

10.3.1.8 Hungary

10.3.1.8.1 Hungary Biometric Sensor Market Estimates and Forecasts, by Product (2020-2032) (USD Billion)

10.3.1.8.2 Hungary Biometric Sensor Market Estimates and Forecasts, by Applications (2020-2032) (USD Billion)

10.3.1.8.3 Hungary Biometric Sensor Market Estimates and Forecasts, by End User (2020-2032) (USD Billion)

10.3.1.9 Turkey

10.3.1.9.1 Turkey Biometric Sensor Market Estimates and Forecasts, by Product (2020-2032) (USD Billion)

10.3.1.9.2 Turkey Biometric Sensor Market Estimates and Forecasts, by Applications (2020-2032) (USD Billion)

10.3.1.9.3 Turkey Biometric Sensor Market Estimates and Forecasts, by End User (2020-2032) (USD Billion)

10.3.1.10 Rest of Eastern Europe

10.3.1.10.1 Rest of Eastern Europe Biometric Sensor Market Estimates and Forecasts, by Product (2020-2032) (USD Billion)

10.3.1.10.2 Rest of Eastern Europe Biometric Sensor Market Estimates and Forecasts, by Applications (2020-2032) (USD Billion)

10.3.1.10.3 Rest of Eastern Europe Biometric Sensor Market Estimates and Forecasts, by End User (2020-2032) (USD Billion)

10.3.2 Western Europe

10.3.2.1 Trends Analysis

10.3.2.2 Western Europe Biometric Sensor Market Estimates and Forecasts, by Country (2020-2032) (USD Billion)

10.3.2.3 Western Europe Biometric Sensor Market Estimates and Forecasts, by Product (2020-2032) (USD Billion)  

10.3.2.4 Western Europe Biometric Sensor Market Estimates and Forecasts, by Applications (2020-2032) (USD Billion)

10.3.2.5 Western Europe Biometric Sensor Market Estimates and Forecasts, by End User (2020-2032) (USD Billion)

10.3.2.6 Germany

10.3.2.6.1 Germany Biometric Sensor Market Estimates and Forecasts, by Product (2020-2032) (USD Billion)

10.3.2.6.2 Germany Biometric Sensor Market Estimates and Forecasts, by Applications (2020-2032) (USD Billion)

10.3.2.6.3 Germany Biometric Sensor Market Estimates and Forecasts, by End User (2020-2032) (USD Billion)

10.3.2.7 France

10.3.2.7.1 France Biometric Sensor Market Estimates and Forecasts, by Product (2020-2032) (USD Billion)

10.3.2.7.2 France Biometric Sensor Market Estimates and Forecasts, by Applications (2020-2032) (USD Billion)

10.3.2.7.3 France Biometric Sensor Market Estimates and Forecasts, by End User (2020-2032) (USD Billion)

10.3.2.8 UK

10.3.2.8.1 UK Biometric Sensor Market Estimates and Forecasts, by Product (2020-2032) (USD Billion)

10.3.2.8.2 UK Biometric Sensor Market Estimates and Forecasts, by Applications (2020-2032) (USD Billion)

10.3.2.8.3 UK Biometric Sensor Market Estimates and Forecasts, by End User (2020-2032) (USD Billion)

10.3.2.9 Italy

10.3.2.9.1 Italy Biometric Sensor Market Estimates and Forecasts, by Product (2020-2032) (USD Billion)

10.3.2.9.2 Italy Biometric Sensor Market Estimates and Forecasts, by Applications (2020-2032) (USD Billion)

10.3.2.9.3 Italy Biometric Sensor Market Estimates and Forecasts, by End User (2020-2032) (USD Billion)

10.3.2.10 Spain

10.3.2.10.1 Spain Biometric Sensor Market Estimates and Forecasts, by Product (2020-2032) (USD Billion)

10.3.2.10.2 Spain Biometric Sensor Market Estimates and Forecasts, by Applications (2020-2032) (USD Billion)

10.3.2.10.3 Spain Biometric Sensor Market Estimates and Forecasts, by End User (2020-2032) (USD Billion)

10.3.2.11 Netherlands

10.3.2.11.1 Netherlands Biometric Sensor Market Estimates and Forecasts, by Product (2020-2032) (USD Billion)

10.3.2.11.2 Netherlands Biometric Sensor Market Estimates and Forecasts, by Applications (2020-2032) (USD Billion)

10.3.2.11.3 Netherlands Biometric Sensor Market Estimates and Forecasts, by End User (2020-2032) (USD Billion)

10.3.2.12 Switzerland

10.3.2.12.1 Switzerland Biometric Sensor Market Estimates and Forecasts, by Product (2020-2032) (USD Billion)

10.3.2.12.2 Switzerland Biometric Sensor Market Estimates and Forecasts, by Applications (2020-2032) (USD Billion)

10.3.2.12.3 Switzerland Biometric Sensor Market Estimates and Forecasts, by End User (2020-2032) (USD Billion)

10.3.2.13 Austria

10.3.2.13.1 Austria Biometric Sensor Market Estimates and Forecasts, by Product (2020-2032) (USD Billion)

10.3.2.13.2 Austria Biometric Sensor Market Estimates and Forecasts, by Applications (2020-2032) (USD Billion)

10.3.2.13.3 Austria Biometric Sensor Market Estimates and Forecasts, by End User (2020-2032) (USD Billion)

10.3.2.14 Rest of Western Europe

10.3.2.14.1 Rest of Western Europe Biometric Sensor Market Estimates and Forecasts, by Product (2020-2032) (USD Billion)

10.3.2.14.2 Rest of Western Europe Biometric Sensor Market Estimates and Forecasts, by Applications (2020-2032) (USD Billion)

10.3.2.14.3 Rest of Western Europe Biometric Sensor Market Estimates and Forecasts, by End User (2020-2032) (USD Billion)

10.4 Asia Pacific

10.4.1 Trends Analysis

10.4.2 Asia Pacific Biometric Sensor Market Estimates and Forecasts, by Country (2020-2032) (USD Billion)

10.4.3 Asia Pacific Biometric Sensor Market Estimates and Forecasts, by Product (2020-2032) (USD Billion)  

10.4.4 Asia Pacific Biometric Sensor Market Estimates and Forecasts, by Applications (2020-2032) (USD Billion)

10.4.5 Asia Pacific Biometric Sensor Market Estimates and Forecasts, by End User (2020-2032) (USD Billion)

10.4.6 China

10.4.6.1 China Biometric Sensor Market Estimates and Forecasts, by Product (2020-2032) (USD Billion)

10.4.6.2 China Biometric Sensor Market Estimates and Forecasts, by Applications (2020-2032) (USD Billion)

10.4.6.3 China Biometric Sensor Market Estimates and Forecasts, by End User (2020-2032) (USD Billion)

10.4.7 India

10.4.7.1 India Biometric Sensor Market Estimates and Forecasts, by Product (2020-2032) (USD Billion)

10.4.7.2 India Biometric Sensor Market Estimates and Forecasts, by Applications (2020-2032) (USD Billion)

10.4.7.3 India Biometric Sensor Market Estimates and Forecasts, by End User (2020-2032) (USD Billion)

10.4.8 Japan

10.4.8.1 Japan Biometric Sensor Market Estimates and Forecasts, by Product (2020-2032) (USD Billion)

10.4.8.2 Japan Biometric Sensor Market Estimates and Forecasts, by Applications (2020-2032) (USD Billion)

10.4.8.3 Japan Biometric Sensor Market Estimates and Forecasts, by End User (2020-2032) (USD Billion)

10.4.9 South Korea

10.4.9.1 South Korea Biometric Sensor Market Estimates and Forecasts, by Product (2020-2032) (USD Billion)

10.4.9.2 South Korea Biometric Sensor Market Estimates and Forecasts, by Applications (2020-2032) (USD Billion)

10.4.9.3 South Korea Biometric Sensor Market Estimates and Forecasts, by End User (2020-2032) (USD Billion)

10.4.10 Vietnam

10.4.10.1 Vietnam Biometric Sensor Market Estimates and Forecasts, by Product (2020-2032) (USD Billion)

10.4.10.2 Vietnam Biometric Sensor Market Estimates and Forecasts, by Applications (2020-2032) (USD Billion)

10.4.10.3 Vietnam Biometric Sensor Market Estimates and Forecasts, by End User (2020-2032) (USD Billion)

10.4.11 Singapore

10.4.11.1 Singapore Biometric Sensor Market Estimates and Forecasts, by Product (2020-2032) (USD Billion)

10.4.11.2 Singapore Biometric Sensor Market Estimates and Forecasts, by Applications (2020-2032) (USD Billion)

10.4.11.3 Singapore Biometric Sensor Market Estimates and Forecasts, by End User (2020-2032) (USD Billion)

10.4.12 Australia

10.4.12.1 Australia Biometric Sensor Market Estimates and Forecasts, by Product (2020-2032) (USD Billion)

10.4.12.2 Australia Biometric Sensor Market Estimates and Forecasts, by Applications (2020-2032) (USD Billion)

10.4.12.3 Australia Biometric Sensor Market Estimates and Forecasts, by End User (2020-2032) (USD Billion)

10.4.13 Rest of Asia Pacific

10.4.13.1 Rest of Asia Pacific Biometric Sensor Market Estimates and Forecasts, by Product (2020-2032) (USD Billion)

10.4.13.2 Rest of Asia Pacific Biometric Sensor Market Estimates and Forecasts, by Applications (2020-2032) (USD Billion)

10.4.13.3 Rest of Asia Pacific Biometric Sensor Market Estimates and Forecasts, by End User (2020-2032) (USD Billion)

10.5 Middle East and Africa

10.5.1 Middle East

10.5.1.1 Trends Analysis

10.5.1.2 Middle East Biometric Sensor Market Estimates and Forecasts, by Country (2020-2032) (USD Billion)

10.5.1.3 Middle East Biometric Sensor Market Estimates and Forecasts, by Product (2020-2032) (USD Billion)  

10.5.1.4 Middle East Biometric Sensor Market Estimates and Forecasts, by Applications (2020-2032) (USD Billion)

10.5.1.5 Middle East Biometric Sensor Market Estimates and Forecasts, by End User (2020-2032) (USD Billion)

10.5.1.6 UAE

10.5.1.6.1 UAE Biometric Sensor Market Estimates and Forecasts, by Product (2020-2032) (USD Billion)

10.5.1.6.2 UAE Biometric Sensor Market Estimates and Forecasts, by Applications (2020-2032) (USD Billion)

10.5.1.6.3 UAE Biometric Sensor Market Estimates and Forecasts, by End User (2020-2032) (USD Billion)

10.5.1.7 Egypt

10.5.1.7.1 Egypt Biometric Sensor Market Estimates and Forecasts, by Product (2020-2032) (USD Billion)

10.5.1.7.2 Egypt Biometric Sensor Market Estimates and Forecasts, by Applications (2020-2032) (USD Billion)

10.5.1.7.3 Egypt Biometric Sensor Market Estimates and Forecasts, by End User (2020-2032) (USD Billion)

10.5.1.8 Saudi Arabia

10.5.1.8.1 Saudi Arabia Biometric Sensor Market Estimates and Forecasts, by Product (2020-2032) (USD Billion)

10.5.1.8.2 Saudi Arabia Biometric Sensor Market Estimates and Forecasts, by Applications (2020-2032) (USD Billion)

10.5.1.8.3 Saudi Arabia Biometric Sensor Market Estimates and Forecasts, by End User (2020-2032) (USD Billion)

10.5.1.9 Qatar

10.5.1.9.1 Qatar Biometric Sensor Market Estimates and Forecasts, by Product (2020-2032) (USD Billion)

10.5.1.9.2 Qatar Biometric Sensor Market Estimates and Forecasts, by Applications (2020-2032) (USD Billion)

10.5.1.9.3 Qatar Biometric Sensor Market Estimates and Forecasts, by End User (2020-2032) (USD Billion)

10.5.1.10 Rest of Middle East

10.5.1.10.1 Rest of Middle East Biometric Sensor Market Estimates and Forecasts, by Product (2020-2032) (USD Billion)

10.5.1.10.2 Rest of Middle East Biometric Sensor Market Estimates and Forecasts, by Applications (2020-2032) (USD Billion)

10.5.1.10.3 Rest of Middle East Biometric Sensor Market Estimates and Forecasts, by End User (2020-2032) (USD Billion)

10.5.2 Africa

10.5.2.1 Trends Analysis

10.5.2.2 Africa Biometric Sensor Market Estimates and Forecasts, by Country (2020-2032) (USD Billion)

10.5.2.3 Africa Biometric Sensor Market Estimates and Forecasts, by Product (2020-2032) (USD Billion)  

10.5.2.4 Africa Biometric Sensor Market Estimates and Forecasts, by Applications (2020-2032) (USD Billion)

10.5.2.5 Africa Biometric Sensor Market Estimates and Forecasts, by End User (2020-2032) (USD Billion)

10.5.2.6 South Africa

10.5.2.6.1 South Africa Biometric Sensor Market Estimates and Forecasts, by Product (2020-2032) (USD Billion)

10.5.2.6.2 South Africa Biometric Sensor Market Estimates and Forecasts, by Applications (2020-2032) (USD Billion)

10.5.2.6.3 South Africa Biometric Sensor Market Estimates and Forecasts, by End User (2020-2032) (USD Billion)

10.5.2.7 Nigeria

10.5.2.7.1 Nigeria Biometric Sensor Market Estimates and Forecasts, by Product (2020-2032) (USD Billion)

10.5.2.7.2 Nigeria Biometric Sensor Market Estimates and Forecasts, by Applications (2020-2032) (USD Billion)

10.5.2.7.3 Nigeria Biometric Sensor Market Estimates and Forecasts, by End User (2020-2032) (USD Billion)

10.5.2.8 Rest of Africa

10.5.2.8.1 Rest of Africa Biometric Sensor Market Estimates and Forecasts, by Product (2020-2032) (USD Billion)

10.5.2.8.2 Rest of Africa Biometric Sensor Market Estimates and Forecasts, by Applications (2020-2032) (USD Billion)

10.5.2.8.3 Rest of Africa Biometric Sensor Market Estimates and Forecasts, by End User (2020-2032) (USD Billion)

10.6 Latin America

10.6.1 Trends Analysis

10.6.2 Latin America Biometric Sensor Market Estimates and Forecasts, by Country (2020-2032) (USD Billion)

10.6.3 Latin America Biometric Sensor Market Estimates and Forecasts, by Product (2020-2032) (USD Billion)  

10.6.4 Latin America Biometric Sensor Market Estimates and Forecasts, by Applications (2020-2032) (USD Billion)

10.6.5 Latin America Biometric Sensor Market Estimates and Forecasts, by End User (2020-2032) (USD Billion)

10.6.6 Brazil

10.6.6.1 Brazil Biometric Sensor Market Estimates and Forecasts, by Product (2020-2032) (USD Billion)

10.6.6.2 Brazil Biometric Sensor Market Estimates and Forecasts, by Applications (2020-2032) (USD Billion)

10.6.6.3 Brazil Biometric Sensor Market Estimates and Forecasts, by End User (2020-2032) (USD Billion)

10.6.7 Argentina

10.6.7.1 Argentina Biometric Sensor Market Estimates and Forecasts, by Product (2020-2032) (USD Billion)

10.6.7.2 Argentina Biometric Sensor Market Estimates and Forecasts, by Applications (2020-2032) (USD Billion)

10.6.7.3 Argentina Biometric Sensor Market Estimates and Forecasts, by End User (2020-2032) (USD Billion)

10.6.8 Colombia

10.6.8.1 Colombia Biometric Sensor Market Estimates and Forecasts, by Product (2020-2032) (USD Billion)

10.6.8.2 Colombia Biometric Sensor Market Estimates and Forecasts, by Applications (2020-2032) (USD Billion)

10.6.8.3 Colombia Biometric Sensor Market Estimates and Forecasts, by End User (2020-2032) (USD Billion)

10.6.9 Rest of Latin America

10.6.9.1 Rest of Latin America Biometric Sensor Market Estimates and Forecasts, by Product (2020-2032) (USD Billion)

10.6.9.2 Rest of Latin America Biometric Sensor Market Estimates and Forecasts, by Applications (2020-2032) (USD Billion)

10.6.9.3 Rest of Latin America Biometric Sensor Market Estimates and Forecasts, by End User (2020-2032) (USD Billion)

11. Company Profiles

11.1 Apple Inc.

11.1.1 Company Overview

11.1.2 Financial

11.1.3 Products/ Services Offered

11.1.4 SWOT Analysis

11.2 Samsung Electronics

11.2.1 Company Overview

11.2.2 Financial

11.2.3 Products/ Services Offered

11.2.4 SWOT Analysis

11.3 Synaptics Incorporated

11.3.1 Company Overview

11.3.2 Financial

11.3.3 Products/ Services Offered

11.3.4 SWOT Analysis

11.4 Qualcomm

11.4.1 Company Overview

11.4.2 Financial

11.4.3 Products/ Services Offered

11.4.4 SWOT Analysis

11.5 HID Global

11.5.1 Company Overview

11.5.2 Financial

11.5.3 Products/ Services Offered

11.5.4 SWOT Analysis

11.6 NEC Corporation

11.6.1 Company Overview

11.6.2 Financial

11.6.3 Products/ Services Offered

11.6.4 SWOT Analysis

11.7 Thales Group

11.7.1 Company Overview

11.7.2 Financial

11.7.3 Products/ Services Offered

11.7.4 SWOT Analysis

11.8 Idemia

11.8.1 Company Overview

11.8.2 Financial

11.8.3 Products/ Services Offered

11.8.4 SWOT Analysis

11.9 Integrated Biometrics

11.9.1 Company Overview

11.9.2 Financial

11.9.3 Products/ Services Offered

11.9.4 SWOT Analysis

11.10 Hikvision

11.10.1 Company Overview

11.10.2 Financial

11.10.3 Products/ Services Offered

11.10.4 SWOT Analysis

12. Use Cases and Best Practices

13. Conclusion

An accurate research report requires proper strategizing as well as implementation. There are multiple factors involved in the completion of good and accurate research report and selecting the best methodology to compete the research is the toughest part. Since the research reports we provide play a crucial role in any company’s decision-making process, therefore we at SNS Insider always believe that we should choose the best method which gives us results closer to reality. This allows us to reach at a stage wherein we can provide our clients best and accurate investment to output ratio.

Each report that we prepare takes a timeframe of 350-400 business hours for production. Starting from the selection of titles through a couple of in-depth brain storming session to the final QC process before uploading our titles on our website we dedicate around 350 working hours. The titles are selected based on their current market cap and the foreseen CAGR and growth.


The 5 steps process:

Step 1: Secondary Research:

Secondary Research or Desk Research is as the name suggests is a research process wherein, we collect data through the readily available information. In this process we use various paid and unpaid databases which our team has access to and gather data through the same. This includes examining of listed companies’ annual reports, Journals, SEC filling etc. Apart from this our team has access to various associations across the globe across different industries. Lastly, we have exchange relationships with various university as well as individual libraries.

Secondary Research

Step 2: Primary Research

When we talk about primary research, it is a type of study in which the researchers collect relevant data samples directly, rather than relying on previously collected data.  This type of research is focused on gaining content specific facts that can be sued to solve specific problems. Since the collected data is fresh and first hand therefore it makes the study more accurate and genuine.

We at SNS Insider have divided Primary Research into 2 parts.

Part 1 wherein we interview the KOLs of major players as well as the upcoming ones across various geographic regions. This allows us to have their view over the market scenario and acts as an important tool to come closer to the accurate market numbers. As many as 45 paid and unpaid primary interviews are taken from both the demand and supply side of the industry to make sure we land at an accurate judgement and analysis of the market.

This step involves the triangulation of data wherein our team analyses the interview transcripts, online survey responses and observation of on filed participants. The below mentioned chart should give a better understanding of the part 1 of the primary interview.

Primary Research

Part 2: In this part of primary research the data collected via secondary research and the part 1 of the primary research is validated with the interviews from individual consultants and subject matter experts.

Consultants are those set of people who have at least 12 years of experience and expertise within the industry whereas Subject Matter Experts are those with at least 15 years of experience behind their back within the same space. The data with the help of two main processes i.e., FGDs (Focused Group Discussions) and IDs (Individual Discussions). This gives us a 3rd party nonbiased primary view of the market scenario making it a more dependable one while collation of the data pointers.

Step 3: Data Bank Validation

Once all the information is collected via primary and secondary sources, we run that information for data validation. At our intelligence centre our research heads track a lot of information related to the market which includes the quarterly reports, the daily stock prices, and other relevant information. Our data bank server gets updated every fortnight and that is how the information which we collected using our primary and secondary information is revalidated in real time.

Data Bank Validation

Step 4: QA/QC Process

After all the data collection and validation our team does a final level of quality check and quality assurance to get rid of any unwanted or undesired mistakes. This might include but not limited to getting rid of the any typos, duplication of numbers or missing of any important information. The people involved in this process include technical content writers, research heads and graphics people. Once this process is completed the title gets uploader on our platform for our clients to read it.

Step 5: Final QC/QA Process:

This is the last process and comes when the client has ordered the study. In this process a final QA/QC is done before the study is emailed to the client. Since we believe in giving our clients a good experience of our research studies, therefore, to make sure that we do not lack at our end in any way humanly possible we do a final round of quality check and then dispatch the study to the client.

Key Segments:

By Product

  • Optical Sensors

  • Electric Field Sensors

  • Thermal Sensors

  • Capacitive Sensors

  • Ultrasound Sensors

By Application

  • Finger Scan

  • Facial Scan

  • Hand Scan

  • Voice Scan

  • Vein Scan

  • Iris Scan

By End User

  • Consumer electronics

  • Construction

  • Defense

  • Medical

  • BFSI

  • Others

Request for Segment Customization as per your Business Requirement: Segment Customization Request

REGIONAL COVERAGE:

North America

  • US

  • Canada

  • Mexico

Europe

  • Eastern Europe

    • Poland

    • Romania

    • Hungary

    • Turkey

    • Rest of Eastern Europe

  • Western Europe

    • Germany

    • France

    • UK

    • Italy

    • Spain

    • Netherlands

    • Switzerland

    • Austria

    • Rest of Western Europe

Asia Pacific

  • China

  • India

  • Japan

  • South Korea

  • Vietnam

  • Singapore

  • Australia

  • Rest of Asia Pacific

Middle East & Africa

  • Middle East

    • UAE

    • Egypt

    • Saudi Arabia

    • Qatar

    • Rest of the Middle East

  • Africa

    • Nigeria

    • South Africa

    • Rest of Africa

Latin America

  • Brazil

  • Argentina

  • Colombia

  • Rest of Latin America

Request for Country Level Research Report: Country Level Customization Request

Available Customization

With the given market data, SNS Insider offers customization as per the company’s specific needs. The following customization options are available for the report:

  • Product Analysis

  • Criss-Cross segment analysis (e.g. Product X Application)

  • Product Matrix which gives a detailed comparison of the product portfolio of each company

  • Geographic Analysis

  • Additional countries in any of the regions

  • Company Information

Detailed analysis and profiling of additional market players (Up to five)


  •            5000 (33% Discount)


  •            8950 (40% Discount)


  •            3050 (23% Discount)

Start a Conversation

Hi! Click one of our member below to chat on Phone