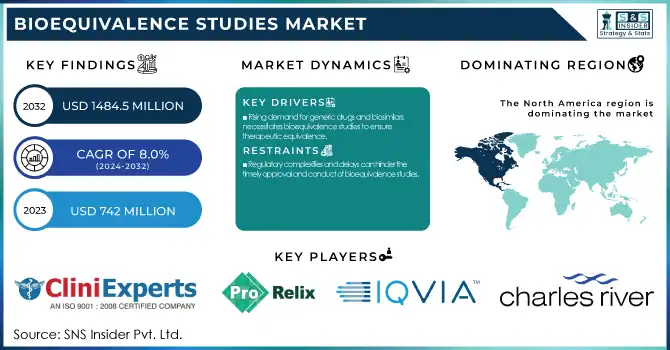
The Bioequivalence Studies Market was valued at USD 742 Million in 2023 and is expected to reach USD 1484.5 million by 2032, growing at a CAGR of 8% over the forecast period 2024-2032.
To get more information on Bioequivalence Studies Market - Request Free Sample Report
Bioequivalence Studies Market Report, designed with the latest statistical insights and trends catering to the dynamics of the industry. It addresses the incidence and prevalence of generic drug utilization as well as regulatory conditions for bioequivalence-backed drugs in major regions. This report analyses the global bioequivalence studies volume as well as R&D spending on that market by pharmaceutical companies and CROs. It also explores advances in testing methods, such as through AI-powered simulations and in vitro assessments. These insights offer a comprehensive view of market dynamics, regulatory shifts, and innovation trends, crucial for stakeholders in the pharmaceutical and clinical research sectors. The bioequivalence studies market is experiencing significant growth driven by the increasing demand for generic drugs and biosimilars. This surge in generic and biosimilar approvals has led to a corresponding increase in bioequivalence studies.
Drivers
Rising demand for generic drugs and biosimilars necessitates bioequivalence studies to ensure therapeutic equivalence.
Increasing demand for generic drugs and biosimilars is a key factor fuelling the growth of the bioequivalence studies market. Bioequivalence studies are critical in ensuring that these products are as effective and safe as their branded counterparts. The U.S. Food and Drug Administration (FDA) approved 917 Abbreviated New Drug Applications (ANDAs) for generic drugs in 2022, an 18% increase from 776 approvals. This uptick mirrors a broader shift toward cheaper drug alternatives. The sector of biosimilars is getting the most boost. The rising acceptance of biosimilars in the healthcare system is further supported by the FDA’s approval of 60 biosimilar products by September 2024. However, the expanding options in the market require robust bioequivalence studies to confirm these products achieve high therapeutic performance. With the continuing production and export of generics, there is a pressing need for bioequivalence studies to ensure health is not compromised at the global level. The increasing demand for competitively priced generic drugs and biosimilars is driving the growth of the bioequivalence studies market. Such studies can provide data to support regulatory approvals and market expansions and help ensure therapeutic equivalence and patient safety.
Restraints:
Regulatory complexities and delays can hinder the timely approval and conduct of bioequivalence studies.
The bioequivalence studies market is drastically affected by regulatory challenges which may delay drug development and drug entry into the market. In Dec 2022, the U.S. Food and Drug Administration (FDA) published draft guidance entitled Statistical Approaches to Establishing Bioequivalence, and the intention is to offer updated guidance on the analysis of bioequivalence (BE) studies. The guidance relates to a variety of statistical methods that can be applied to in vivo and in vitro bioequivalence (BE) assessments and represents the FDA's current thinking on this topic. These changes aim to both better align with global practices and ensure drug affordability and access. Increased clarity and predictability of processes and timelines, including expedited pathways, have provided benefits to the pharmaceutical industry. In recent years, the number of national and international clinical trials in India has significantly increased, with trial approvals rising in the double digits. Newer regulations, guidelines, and rules further strengthen India's regulatory system, positioning the country as a valuable partner in global clinical trials.
However, the technical and regulatory hurdles associated with the development and approval of biosimilars still represent to this day significant challenges. Internationally, aligning standards for biosimilars may facilitate progress toward efficient approval procedures and the timely availability of these products for patients around the globe. Regulatory hurdles like these compel pharma companies to be aware of changing rules and adjust their development strategies accordingly for compliance and speedy market availability.
Opportunities:
Advancements in bioanalytical technologies enhance the accuracy and efficiency of bioequivalence assessments.
Advancements in bioanalytical technologies are significantly enhancing the accuracy and efficiency of bioequivalence assessments, creating significant opportunities in the pharmaceutical industry. This growth is attributed to the surging demand for advanced analytics in drug development and the growing adoption of precision medicine, where biomarker discovery and validation-a primary realm of bioanalytical services a prominent role. In 2022, the global precision medicine market was valued at USD 70 billion, suggesting strong demand for biomarker analysis and companion diagnostics-based services.
Technological advances, including the adoption of artificial intelligence (AI) and automation, are also driving the market forward. The integration of AI in bioanalytical testing facilitates advanced drug screening, imaging analysis, and drug target identification, ensuring better precision in bioequivalence studies. Bioanalytical testing services have become an increasingly outsourced procedure. This shift allows pharmaceutical companies to leverage specialized expertise and advanced technologies without significant in-house investments, thereby streamlining drug development processes.
Challenges:
Ensuring data integrity and maintaining high ethical standards are critical to uphold the credibility of bioequivalence studies.
Integrity of data in bioequivalence studies is critical since compromised data may result in an inaccurate assessment of the therapeutic equivalence and may thus, endanger the safety of the patient. This issue is underscored by recent incidents. In 2023, a Harvard Business School professor was accused of fabricating data in multiple published papers, highlighting that approximately 2% of scholars across various fields admit to data falsification at least once in their careers. Within the pharmaceutical industry, the U.S. Food and Drug Administration (FDA) has stepped up scrutiny and flagged data integrity as a leading issue. The FDA published several current Good Manufacturing Practice (CGMP) warning letters in 2024, with a large number of which being related to data integrity breaches. From 2017 to 2022, the FDA sent more than 160 warning letters for data integrity deficiencies, including 13 in 2022 alone. These figures highlight the importance of promoting strong data management best practices in bioequivalence studies for the integrity of research results and to ensure public health safety.
By Molecule Type
In 2023, the small molecule segment accounted for the largest share of revenue in the global bioequivalence studies market, contributing 59% revenue share. This dominance can be attributed to several factors, including the widespread use of small molecule drugs in various therapeutic areas and the increasing focus on developing generic versions of off-patent small molecule drugs. Recently, the US FDA's Center for Drug Evaluation and Research (CDER) stated that 75% of all new drug approvals for 2024 were small molecules, highlighting how popular they are in relation to biopharmaceuticals. Moreover, small molecule drugs can boast lower development costs and easier manufacturing processes than large molecule biologics, and small molecules are significantly more common in the market. The solid performance of the segment has also been driven by a burgeoning pipeline of small molecule drugs for a wide range of diseases, particularly in oncology and neurology. According to the National Institutes of Health (NIH) Clinical Trials database, 60% of clinical trials had been conducted using small molecule drugs as of February 2025, demonstrating a continued need for bioequivalence studies in this section.
Moreover, generic small molecule drugs are gaining popularity as regulatory agencies have embraced this trend and have made the approval process easy thus encouraging more companies to join this sector thereby increasing the need for bioequivalence studies. OGA noted that 2023 witnessed an increase of 20% in the approvals of generic drugs compared to 2022, however, most of them were small-molecule generic drugs.
By Dosage Form
In 2023, the solid oral dosage segment accounted for the largest share of revenue 54%. The majority share of this market can be attributed to the most common dosage form for the patients in the form of oral solid dosage forms, like tablets, capsules, etc. and that is the solid oral dosage forms that are always preferred by pharmaceutical companies and patients due to their convenience, stability, and economy. In 2024, about 60% of all approved drugs were solid oral dosage forms, according to the U.S. FDA's Office of Pharmaceutical Quality. This segment is strongly supported by innovations in manufacturing technologies that have enhanced the quality and bioavailability of solid oral dosage forms. In 2024, the EMA also reported a 25% growth in generic solid oral dosage forms applications and a 26.8% increase in valid applications leading to CAD's approval corresponding to higher bioequivalence studies for solid dosage forms.
Additionally, solid oral dosage forms benefit from well-characterized regulatory guidelines, which provide a framework for conducting bioequivalence studies, while the other dosage forms still face challenges in the approval process. In 2024, the U.S. Food and Drug Administration (FDA) issued guidance on bioequivalence studies for solid oral dosage forms (510(k) of 2024) that provided more clarity on the pathway for obtaining market approval for these bioequivalence studies, which has had the effect of furthering the growth of this segment.
By Therapeutic Area
The oncology segment led the bioequivalence studies market and held the largest revenue share of 26% in 2023. This growth Is driven by the high burden of cancer globally and increasing emphasis on manufacturing generic and biosimilar versions of expensive oncology drugs. Cancer is the second leading cause of death worldwide, according to the World Health Organization (WHO), with around 19.3 million new cases in 2024. The increasing cost of innovative cancer therapies has resulted in the need for less expensive treatment options and a need for more bioequivalence studies of oncology drugs. In 2024, 35% of new drug approvals were oncology drugs, with much of that coming from generic or biosimilar versions of existing treatments, the FDA said. This trend will persist since multiple patents for blockbuster oncology drugs already expire in the next few years. In addition, oncology drugs vary widely in complexity and targeted therapies and immunotherapies, in particular, require careful and comprehensive bioequivalence studies to ensure safety and efficacy. In 2024, the National Cancer Institute (NCI) announced it would receive a 30% budget increase and devote much of this to studying and testing new treatments, including generics and biosimilars.
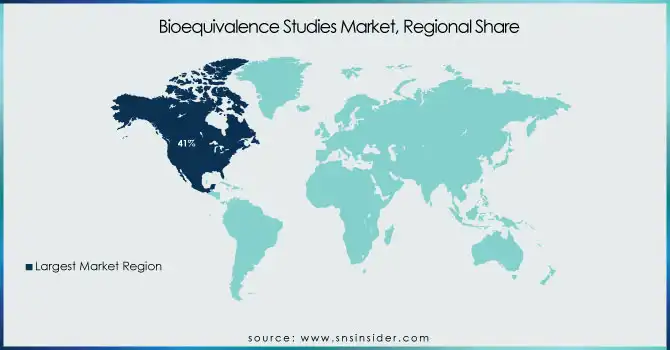
The North American region held the largest share 41% in 2023 of the bioequivalence studies market. North America accounts for the largest share of the market, driven by a strong pharmaceutical industry, strict regulatory landscape, and high healthcare spending. In 2024, the U.S. FDA saw a 15% increase in submissions for bioequivalence studies compared to the previous year, underscoring the region's strong market position. The Asia Pacific region is anticipated to be the fastest-growing region during the forecast period. This growth is primarily attributed to increasing production of generic drugs, outsourcing of pharmaceutical services, and favorable government policies. Major hubs for generic drug manufacture and bioequivalence studies include nations such as India and China. India has taken several initiatives to promote drug manufacturing in the country, including generics, with the “Pharma Vision 2025” target that is intended to establish India as a global leader in the drug manufacturing sector. Moreover, the Chinese National Medical Products Administration (NMPA) announced a 30% increase in the number of generic drugs approved in 2024 demonstrating the increasing requirement for bioequivalence studies in the region. Global pharma firms have been increasingly outsourcing their bioequivalence studies to the Asia Pacific owing to cost-effective advantages and improvements in regulatory standards.
Get Customized Report as per Your Business Requirement - Enquiry Now
Key Service Providers/Manufacturers
CliniExperts (Regulatory Consulting Services, Clinical Trial Management)
ProRelix Services LLP (Clinical Research Services, Bioanalytical Services)
IQVIA (Clinical Development Services, Real-World Evidence Solutions)
ICON plc (Clinical Research Services, Laboratory Services)
Charles River Laboratories (Preclinical Services, Laboratory Testing)
Labcorp Drug Development (Clinical Trial Management, Bioanalytical Testing)
KYMOS Group (Bioequivalence Testing, Analytical Development)
Veeda Clinical Research (Clinical Trial Services, Bioanalytical Services)
Notrox Research (Clinical Research Services, Bioanalytical Testing)
NorthEast BioAnalytical Laboratories LLC (Bioanalytical Services, Pharmacokinetic Analysis)
Malvern Panalytical Ltd (Analytical Instruments, Material Characterization Solutions)
Synova Health (Clinical Trial Services, Regulatory Consulting)
Inhibikase Therapeutics, Inc. (IkT-001Pro, IkT-148009)
Lupin Limited (Ethambutol, Rifampicin)
Geropharm (Semavic, Insulin Glargine)
Promomed (Generic Pharmaceuticals, Biosimilars)
PSK Pharma (Generic Drugs, Active Pharmaceutical Ingredients)
Zhejiang Peptides Biotech (Active Pharmaceutical Ingredients, Peptide Synthesis Services)
Gilead Sciences (Remdesivir, Biktarvy)
Novo Nordisk (Ozempic, Wegovy)
The FDA has streamlined guidelines for biosimilar and interchangeable biosimilar approvals. In May 2024, discussions suggested treating all biosimilars as interchangeable, aiming to enhance market competition and accessibility.
In November 2024, Charles River Laboratories formed a collaborative relationship with a major Chinese pharmaceutical company in order to found a joint bioequivalence research center in Shanghai. This collaboration aims to expedite the development and approval of generic medicines for the Chinese market.
| Report Attributes | Details |
|---|---|
| Market Size in 2023 | USD 742 Million |
| Market Size by 2032 | USD 1484.5 Million |
| CAGR | CAGR of 8.0% From 2024 to 2032 |
| Base Year | 2023 |
| Forecast Period | 2024-2032 |
| Historical Data | 2020-2022 |
| Report Scope & Coverage | Market Size, Segments Analysis, Competitive Landscape, Regional Analysis, DROC & SWOT Analysis, Forecast Outlook |
| Key Segments | • By Dosage Form (Solid Oral Dosage, Topical Products, Parenteral Formulations, Others) • By Molecule Type (Small Molecule, Large Molecule) • By Therapeutic Area, (Oncology, Neurology, Immunology, Metabolic Disorders, Hematology, Others) |
| Regional Analysis/Coverage | North America (US, Canada, Mexico), Europe (Eastern Europe [Poland, Romania, Hungary, Turkey, Rest of Eastern Europe] Western Europe] Germany, France, UK, Italy, Spain, Netherlands, Switzerland, Austria, Rest of Western Europe]), Asia Pacific (China, India, Japan, South Korea, Vietnam, Singapore, Australia, Rest of Asia Pacific), Middle East & Africa (Middle East [UAE, Egypt, Saudi Arabia, Qatar, Rest of Middle East], Africa [Nigeria, South Africa, Rest of Africa], Latin America (Brazil, Argentina, Colombia, Rest of Latin America) |
| Company Profiles | CliniExperts, ProRelix Services LLP, IQVIA, ICON plc, Charles River Laboratories, Labcorp Drug Development, KYMOS Group, Veeda Clinical Research, Notrox Research, NorthEast BioAnalytical Laboratories LLC, Malvern Panalytical Ltd, Synova Health, Inhibikase Therapeutics, Inc., Lupin Limited, Geropharm, Promomed, PSK Pharma, Zhejiang Peptides Biotech, Gilead Sciences, Novo Nordisk |
Ans. The projected market size for the Bioequivalence Studies Market is USD 1484.5 Million by 2032.
Ans: The North American region dominated the Bioequivalence Studies Market in 2023.
Ans. The CAGR of the Bioequivalence Studies Market is 8% During the forecast period of 2024-2032.
Ans: Rising demand for generic drugs and biosimilars necessitates bioequivalence studies to ensure therapeutic equivalence.
Ans: The small molecule segment molecule type dominated the Bioequivalence Studies Market.
Table of Contents
1. Introduction
1.1 Market Definition
1.2 Scope (Inclusion and Exclusions)
1.3 Research Assumptions
2. Executive Summary
2.1 Market Overview
2.2 Regional Synopsis
2.3 Competitive Summary
3. Research Methodology
3.1 Top-Down Approach
3.2 Bottom-up Approach
3.3. Data Validation
3.4 Primary Interviews
4. Market Dynamics Impact Analysis
4.1 Market Driving Factors Analysis
4.1.1 Drivers
4.1.2 Restraints
4.1.3 Opportunities
4.1.4 Challenges
4.2 PESTLE Analysis
4.3 Porter’s Five Forces Model
5. Statistical Insights and Trends Reporting
5.1 Incidence and Prevalence of Generic Drug Use (2023)
5.2 Regulatory Approvals for Generic Drugs (2023)
5.3 Global Bioequivalence Study Volume (2020-2032)
5.4 R&D Expenditure on Bioequivalence Testing
5.5 Adoption of Advanced Testing Methods
6. Competitive Landscape
6.1 List of Major Companies, By Region
6.2 Market Share Analysis, By Region
6.3 Product Benchmarking
6.3.1 Product specifications and features
6.3.2 Pricing
6.4 Strategic Initiatives
6.4.1 Marketing and promotional activities
6.4.2 Distribution and Supply Chain Strategies
6.4.3 Expansion plans and new product launches
6.4.4 Strategic partnerships and collaborations
6.5 Technological Advancements
6.6 Market Positioning and Branding
7. Bioequivalence Studies Market Segmentation, By Dosage Form
7.1 Chapter Overview
7.2 Solid Oral Dosage
7.2.1 Solid Oral Dosage Market Trends Analysis (2020-2032)
7.2.2 Solid Oral Dosage Market Size Estimates and Forecasts to 2032 (USD Million)
7.3 Topical Products
7.3.1 Topical Products Market Trends Analysis (2020-2032)
7.3.2 Topical Products Market Size Estimates and Forecasts to 2032 (USD Million)
7.4 Parenteral Formulations
7.4.1 Parenteral Formulations Market Trends Analysis (2020-2032)
7.4.2 Parenteral Formulations Market Size Estimates and Forecasts to 2032 (USD Million)
7.7 Others
7.7.1 Others Market Trends Analysis (2020-2032)
7.7.2 Others Market Size Estimates and Forecasts to 2032 (USD Million)
8. Bioequivalence Studies Market Segmentation, By Molecule Type
8.1 Chapter Overview
8.2 Small Molecule
8.2.1 Small Molecule Market Trends Analysis (2020-2032)
8.2.2 Small Molecule Market Size Estimates and Forecasts to 2032 (USD Million)
8.3 Large Molecule
8.3.1 Large Molecule Market Trends Analysis (2020-2032)
8.3.2 Large Molecule Market Size Estimates and Forecasts to 2032 (USD Million)
9. Bioequivalence Studies Market Segmentation, By Therapeutic Area
9.1 Chapter Overview
9.2 Oncology
9.2.1 Oncology Market Trends Analysis (2020-2032)
9.2.2 Oncology Market Size Estimates and Forecasts to 2032 (USD Million)
9.3 Neurology
9.3.1 Neurology Market Trends Analysis (2020-2032)
9.3.2 Neurology Market Size Estimates and Forecasts to 2032 (USD Million)
9.4 Immunology
9.4.1 Immunology Market Trends Analysis (2020-2032)
9.4.2 Immunology Market Size Estimates and Forecasts to 2032 (USD Million)
9.5 Metabolic Disorders
9.5.1 Metabolic Disorders Market Trends Analysis (2020-2032)
9.5.2 Metabolic Disorders Market Size Estimates and Forecasts to 2032 (USD Million)
9.6 Hematology
9.6.1 Hematology Market Trends Analysis (2020-2032)
9.6.2 Hematology Market Size Estimates and Forecasts to 2032 (USD Million)
9.7 Others
9.7.1 Others Market Trends Analysis (2020-2032)
9.7.2 Others Market Size Estimates and Forecasts to 2032 (USD Million)
10. Regional Analysis
10.1 Chapter Overview
10.2 North America
10.2.1 Trends Analysis
10.2.2 North America Bioequivalence Studies Market Estimates and Forecasts, by Country (2020-2032) (USD Million)
10.2.3 North America Bioequivalence Studies Market Estimates and Forecasts, By Dosage Form (2020-2032) (USD Million)
10.2.4 North America Bioequivalence Studies Market Estimates and Forecasts, By Molecule Type (2020-2032) (USD Million)
10.2.5 North America Bioequivalence Studies Market Estimates and Forecasts, By Therapeutic Area (2020-2032) (USD Million)
10.2.6 USA
10.2.6.1 USA Bioequivalence Studies Market Estimates and Forecasts, By Dosage Form (2020-2032) (USD Million)
10.2.6.2 USA Bioequivalence Studies Market Estimates and Forecasts, By Molecule Type (2020-2032) (USD Million)
10.2.6.3 USA Bioequivalence Studies Market Estimates and Forecasts, By Therapeutic Area (2020-2032) (USD Million)
10.2.7 Canada
10.2.7.1 Canada Bioequivalence Studies Market Estimates and Forecasts, By Dosage Form (2020-2032) (USD Million)
10.2.7.2 Canada Bioequivalence Studies Market Estimates and Forecasts, By Molecule Type (2020-2032) (USD Million)
10.2.7.3 Canada Bioequivalence Studies Market Estimates and Forecasts, By Therapeutic Area (2020-2032) (USD Million)
10.2.8 Mexico
10.2.8.1 Mexico Bioequivalence Studies Market Estimates and Forecasts, By Dosage Form (2020-2032) (USD Million)
10.2.8.2 Mexico Bioequivalence Studies Market Estimates and Forecasts, By Molecule Type (2020-2032) (USD Million)
10.2.8.3 Mexico Bioequivalence Studies Market Estimates and Forecasts, By Therapeutic Area (2020-2032) (USD Million)
10.3 Europe
10.3.1 Eastern Europe
10.3.1.1 Trends Analysis
10.3.1.2 Eastern Europe Bioequivalence Studies Market Estimates and Forecasts, by Country (2020-2032) (USD Million)
10.3.1.3 Eastern Europe Bioequivalence Studies Market Estimates and Forecasts, By Dosage Form (2020-2032) (USD Million)
10.3.1.4 Eastern Europe Bioequivalence Studies Market Estimates and Forecasts, By Molecule Type (2020-2032) (USD Million)
10.3.1.5 Eastern Europe Bioequivalence Studies Market Estimates and Forecasts, By Therapeutic Area (2020-2032) (USD Million)
10.3.1.6 Poland
10.3.1.6.1 Poland Bioequivalence Studies Market Estimates and Forecasts, By Dosage Form (2020-2032) (USD Million)
10.3.1.6.2 Poland Bioequivalence Studies Market Estimates and Forecasts, By Molecule Type (2020-2032) (USD Million)
10.3.1.6.3 Poland Bioequivalence Studies Market Estimates and Forecasts, By Therapeutic Area (2020-2032) (USD Million)
10.3.1.7 Romania
10.3.1.7.1 Romania Bioequivalence Studies Market Estimates and Forecasts, By Dosage Form (2020-2032) (USD Million)
10.3.1.7.2 Romania Bioequivalence Studies Market Estimates and Forecasts, By Molecule Type (2020-2032) (USD Million)
10.3.1.7.3 Romania Bioequivalence Studies Market Estimates and Forecasts, By Therapeutic Area (2020-2032) (USD Million)
10.3.1.8 Hungary
10.3.1.8.1 Hungary Bioequivalence Studies Market Estimates and Forecasts, By Dosage Form (2020-2032) (USD Million)
10.3.1.8.2 Hungary Bioequivalence Studies Market Estimates and Forecasts, By Molecule Type (2020-2032) (USD Million)
10.3.1.8.3 Hungary Bioequivalence Studies Market Estimates and Forecasts, By Therapeutic Area (2020-2032) (USD Million)
10.3.1.9 Turkey
10.3.1.9.1 Turkey Bioequivalence Studies Market Estimates and Forecasts, By Dosage Form (2020-2032) (USD Million)
10.3.1.9.2 Turkey Bioequivalence Studies Market Estimates and Forecasts, By Molecule Type (2020-2032) (USD Million)
10.3.1.9.3 Turkey Bioequivalence Studies Market Estimates and Forecasts, By Therapeutic Area (2020-2032) (USD Million)
10.3.1.10 Rest of Eastern Europe
10.3.1.10.1 Rest of Eastern Europe Bioequivalence Studies Market Estimates and Forecasts, By Dosage Form (2020-2032) (USD Million)
10.3.1.10.2 Rest of Eastern Europe Bioequivalence Studies Market Estimates and Forecasts, By Molecule Type (2020-2032) (USD Million)
10.3.1.10.3 Rest of Eastern Europe Bioequivalence Studies Market Estimates and Forecasts, By Therapeutic Area (2020-2032) (USD Million)
10.3.2 Western Europe
10.3.2.1 Trends Analysis
10.3.2.2 Western Europe Bioequivalence Studies Market Estimates and Forecasts, by Country (2020-2032) (USD Million)
10.3.2.3 Western Europe Bioequivalence Studies Market Estimates and Forecasts, By Dosage Form (2020-2032) (USD Million)
10.3.2.4 Western Europe Bioequivalence Studies Market Estimates and Forecasts, By Molecule Type (2020-2032) (USD Million)
10.3.2.5 Western Europe Bioequivalence Studies Market Estimates and Forecasts, By Therapeutic Area (2020-2032) (USD Million)
10.3.2.6 Germany
10.3.2.6.1 Germany Bioequivalence Studies Market Estimates and Forecasts, By Dosage Form (2020-2032) (USD Million)
10.3.2.6.2 Germany Bioequivalence Studies Market Estimates and Forecasts, By Molecule Type (2020-2032) (USD Million)
10.3.2.6.3 Germany Bioequivalence Studies Market Estimates and Forecasts, By Therapeutic Area (2020-2032) (USD Million)
10.3.2.7 France
10.3.2.7.1 France Bioequivalence Studies Market Estimates and Forecasts, By Dosage Form (2020-2032) (USD Million)
10.3.2.7.2 France Bioequivalence Studies Market Estimates and Forecasts, By Molecule Type (2020-2032) (USD Million)
10.3.2.7.3 France Bioequivalence Studies Market Estimates and Forecasts, By Therapeutic Area (2020-2032) (USD Million)
10.3.2.8 UK
10.3.2.8.1 UK Bioequivalence Studies Market Estimates and Forecasts, By Dosage Form (2020-2032) (USD Million)
10.3.2.8.2 UK Bioequivalence Studies Market Estimates and Forecasts, By Molecule Type (2020-2032) (USD Million)
10.3.2.8.3 UK Bioequivalence Studies Market Estimates and Forecasts, By Therapeutic Area (2020-2032) (USD Million)
10.3.2.9 Italy
10.3.2.9.1 Italy Bioequivalence Studies Market Estimates and Forecasts, By Dosage Form (2020-2032) (USD Million)
10.3.2.9.2 Italy Bioequivalence Studies Market Estimates and Forecasts, By Molecule Type (2020-2032) (USD Million)
10.3.2.9.3 Italy Bioequivalence Studies Market Estimates and Forecasts, By Therapeutic Area (2020-2032) (USD Million)
10.3.2.10 Spain
10.3.2.10.1 Spain Bioequivalence Studies Market Estimates and Forecasts, By Dosage Form (2020-2032) (USD Million)
10.3.2.10.2 Spain Bioequivalence Studies Market Estimates and Forecasts, By Molecule Type (2020-2032) (USD Million)
10.3.2.10.3 Spain Bioequivalence Studies Market Estimates and Forecasts, By Therapeutic Area (2020-2032) (USD Million)
10.3.2.11 Netherlands
10.3.2.11.1 Netherlands Bioequivalence Studies Market Estimates and Forecasts, By Dosage Form (2020-2032) (USD Million)
10.3.2.11.2 Netherlands Bioequivalence Studies Market Estimates and Forecasts, By Molecule Type (2020-2032) (USD Million)
10.3.2.11.3 Netherlands Bioequivalence Studies Market Estimates and Forecasts, By Therapeutic Area (2020-2032) (USD Million)
10.3.2.12 Switzerland
10.3.2.12.1 Switzerland Bioequivalence Studies Market Estimates and Forecasts, By Dosage Form (2020-2032) (USD Million)
10.3.2.12.2 Switzerland Bioequivalence Studies Market Estimates and Forecasts, By Molecule Type (2020-2032) (USD Million)
10.3.2.12.3 Switzerland Bioequivalence Studies Market Estimates and Forecasts, By Therapeutic Area (2020-2032) (USD Million)
10.3.2.13 Austria
10.3.2.13.1 Austria Bioequivalence Studies Market Estimates and Forecasts, By Dosage Form (2020-2032) (USD Million)
10.3.2.13.2 Austria Bioequivalence Studies Market Estimates and Forecasts, By Molecule Type (2020-2032) (USD Million)
10.3.2.13.3 Austria Bioequivalence Studies Market Estimates and Forecasts, By Therapeutic Area (2020-2032) (USD Million)
10.3.2.14 Rest of Western Europe
10.3.2.14.1 Rest of Western Europe Bioequivalence Studies Market Estimates and Forecasts, By Dosage Form (2020-2032) (USD Million)
10.3.2.14.2 Rest of Western Europe Bioequivalence Studies Market Estimates and Forecasts, By Molecule Type (2020-2032) (USD Million)
10.3.2.14.3 Rest of Western Europe Bioequivalence Studies Market Estimates and Forecasts, By Therapeutic Area (2020-2032) (USD Million)
10.4 Asia Pacific
10.4.1 Trends Analysis
10.4.2 Asia Pacific Bioequivalence Studies Market Estimates and Forecasts, by Country (2020-2032) (USD Million)
10.4.3 Asia Pacific Bioequivalence Studies Market Estimates and Forecasts, By Dosage Form (2020-2032) (USD Million)
10.4.4 Asia Pacific Bioequivalence Studies Market Estimates and Forecasts, By Molecule Type (2020-2032) (USD Million)
10.4.5 Asia Pacific Bioequivalence Studies Market Estimates and Forecasts, By Therapeutic Area (2020-2032) (USD Million)
10.4.6 China
10.4.6.1 China Bioequivalence Studies Market Estimates and Forecasts, By Dosage Form (2020-2032) (USD Million)
10.4.6.2 China Bioequivalence Studies Market Estimates and Forecasts, By Molecule Type (2020-2032) (USD Million)
10.4.6.3 China Bioequivalence Studies Market Estimates and Forecasts, By Therapeutic Area (2020-2032) (USD Million)
10.4.7 India
10.4.7.1 India Bioequivalence Studies Market Estimates and Forecasts, By Dosage Form (2020-2032) (USD Million)
10.4.7.2 India Bioequivalence Studies Market Estimates and Forecasts, By Molecule Type (2020-2032) (USD Million)
10.4.7.3 India Bioequivalence Studies Market Estimates and Forecasts, By Therapeutic Area (2020-2032) (USD Million)
10.4.8 Japan
10.4.8.1 Japan Bioequivalence Studies Market Estimates and Forecasts, By Dosage Form (2020-2032) (USD Million)
10.4.8.2 Japan Bioequivalence Studies Market Estimates and Forecasts, By Molecule Type (2020-2032) (USD Million)
10.4.8.3 Japan Bioequivalence Studies Market Estimates and Forecasts, By Therapeutic Area (2020-2032) (USD Million)
10.4.9 South Korea
10.4.9.1 South Korea Bioequivalence Studies Market Estimates and Forecasts, By Dosage Form (2020-2032) (USD Million)
10.4.9.2 South Korea Bioequivalence Studies Market Estimates and Forecasts, By Molecule Type (2020-2032) (USD Million)
10.4.9.3 South Korea Bioequivalence Studies Market Estimates and Forecasts, By Therapeutic Area (2020-2032) (USD Million)
10.4.10 Vietnam
10.4.10.1 Vietnam Bioequivalence Studies Market Estimates and Forecasts, By Dosage Form (2020-2032) (USD Million)
10.4.10.2 Vietnam Bioequivalence Studies Market Estimates and Forecasts, By Molecule Type (2020-2032) (USD Million)
10.4.10.3 Vietnam Bioequivalence Studies Market Estimates and Forecasts, By Therapeutic Area (2020-2032) (USD Million)
10.4.11 Singapore
10.4.11.1 Singapore Bioequivalence Studies Market Estimates and Forecasts, By Dosage Form (2020-2032) (USD Million)
10.4.11.2 Singapore Bioequivalence Studies Market Estimates and Forecasts, By Molecule Type (2020-2032) (USD Million)
10.4.11.3 Singapore Bioequivalence Studies Market Estimates and Forecasts, By Therapeutic Area (2020-2032) (USD Million)
10.4.12 Australia
10.4.12.1 Australia Bioequivalence Studies Market Estimates and Forecasts, By Dosage Form (2020-2032) (USD Million)
10.4.12.2 Australia Bioequivalence Studies Market Estimates and Forecasts, By Molecule Type (2020-2032) (USD Million)
10.4.12.3 Australia Bioequivalence Studies Market Estimates and Forecasts, By Therapeutic Area (2020-2032) (USD Million)
10.4.13 Rest of Asia Pacific
10.4.13.1 Rest of Asia Pacific Bioequivalence Studies Market Estimates and Forecasts, By Dosage Form (2020-2032) (USD Million)
10.4.13.2 Rest of Asia Pacific Bioequivalence Studies Market Estimates and Forecasts, By Molecule Type (2020-2032) (USD Million)
10.4.13.3 Rest of Asia Pacific Bioequivalence Studies Market Estimates and Forecasts, By Therapeutic Area (2020-2032) (USD Million)
10.5 Middle East and Africa
10.5.1 Middle East
10.5.1.1 Trends Analysis
10.5.1.2 Middle East Bioequivalence Studies Market Estimates and Forecasts, by Country (2020-2032) (USD Million)
10.5.1.3 Middle East Bioequivalence Studies Market Estimates and Forecasts, By Dosage Form (2020-2032) (USD Million)
10.5.1.4 Middle East Bioequivalence Studies Market Estimates and Forecasts, By Molecule Type (2020-2032) (USD Million)
10.5.1.5 Middle East Bioequivalence Studies Market Estimates and Forecasts, By Therapeutic Area (2020-2032) (USD Million)
10.5.1.6 UAE
10.5.1.6.1 UAE Bioequivalence Studies Market Estimates and Forecasts, By Dosage Form (2020-2032) (USD Million)
10.5.1.6.2 UAE Bioequivalence Studies Market Estimates and Forecasts, By Molecule Type (2020-2032) (USD Million)
10.5.1.6.3 UAE Bioequivalence Studies Market Estimates and Forecasts, By Therapeutic Area (2020-2032) (USD Million)
10.5.1.7 Egypt
10.5.1.7.1 Egypt Bioequivalence Studies Market Estimates and Forecasts, By Dosage Form (2020-2032) (USD Million)
10.5.1.7.2 Egypt Bioequivalence Studies Market Estimates and Forecasts, By Molecule Type (2020-2032) (USD Million)
10.5.1.7.3 Egypt Bioequivalence Studies Market Estimates and Forecasts, By Therapeutic Area (2020-2032) (USD Million)
10.5.1.8 Saudi Arabia
10.5.1.8.1 Saudi Arabia Bioequivalence Studies Market Estimates and Forecasts, By Dosage Form (2020-2032) (USD Million)
10.5.1.8.2 Saudi Arabia Bioequivalence Studies Market Estimates and Forecasts, By Molecule Type (2020-2032) (USD Million)
10.5.1.8.3 Saudi Arabia Bioequivalence Studies Market Estimates and Forecasts, By Therapeutic Area (2020-2032) (USD Million)
10.5.1.9 Qatar
10.5.1.9.1 Qatar Bioequivalence Studies Market Estimates and Forecasts, By Dosage Form (2020-2032) (USD Million)
10.5.1.9.2 Qatar Bioequivalence Studies Market Estimates and Forecasts, By Molecule Type (2020-2032) (USD Million)
10.5.1.9.3 Qatar Bioequivalence Studies Market Estimates and Forecasts, By Therapeutic Area (2020-2032) (USD Million)
10.5.1.10 Rest of Middle East
10.5.1.10.1 Rest of Middle East Bioequivalence Studies Market Estimates and Forecasts, By Dosage Form (2020-2032) (USD Million)
10.5.1.10.2 Rest of Middle East Bioequivalence Studies Market Estimates and Forecasts, By Molecule Type (2020-2032) (USD Million)
10.5.1.10.3 Rest of Middle East Bioequivalence Studies Market Estimates and Forecasts, By Therapeutic Area (2020-2032) (USD Million)
10.5.2 Africa
10.5.2.1 Trends Analysis
10.5.2.2 Africa Bioequivalence Studies Market Estimates and Forecasts, by Country (2020-2032) (USD Million)
10.5.2.3 Africa Bioequivalence Studies Market Estimates and Forecasts, By Dosage Form (2020-2032) (USD Million)
10.5.2.4 Africa Bioequivalence Studies Market Estimates and Forecasts, By Molecule Type (2020-2032) (USD Million)
10.5.2.5 Africa Bioequivalence Studies Market Estimates and Forecasts, By Therapeutic Area (2020-2032) (USD Million)
10.5.2.6 South Africa
10.5.2.6.1 South Africa Bioequivalence Studies Market Estimates and Forecasts, By Dosage Form (2020-2032) (USD Million)
10.5.2.6.2 South Africa Bioequivalence Studies Market Estimates and Forecasts, By Molecule Type (2020-2032) (USD Million)
10.5.2.6.3 South Africa Bioequivalence Studies Market Estimates and Forecasts, By Therapeutic Area (2020-2032) (USD Million)
10.5.2.7 Nigeria
10.5.2.7.1 Nigeria Bioequivalence Studies Market Estimates and Forecasts, By Dosage Form (2020-2032) (USD Million)
10.5.2.7.2 Nigeria Bioequivalence Studies Market Estimates and Forecasts, By Molecule Type (2020-2032) (USD Million)
10.5.2.7.3 Nigeria Bioequivalence Studies Market Estimates and Forecasts, By Therapeutic Area (2020-2032) (USD Million)
10.5.2.8 Rest of Africa
10.5.2.8.1 Rest of Africa Bioequivalence Studies Market Estimates and Forecasts, By Dosage Form (2020-2032) (USD Million)
10.5.2.8.2 Rest of Africa Bioequivalence Studies Market Estimates and Forecasts, By Molecule Type (2020-2032) (USD Million)
10.5.2.8.3 Rest of Africa Bioequivalence Studies Market Estimates and Forecasts, By Therapeutic Area (2020-2032) (USD Million)
10.6 Latin America
10.6.1 Trends Analysis
10.6.2 Latin America Bioequivalence Studies Market Estimates and Forecasts, by Country (2020-2032) (USD Million)
10.6.3 Latin America Bioequivalence Studies Market Estimates and Forecasts, By Dosage Form (2020-2032) (USD Million)
10.6.4 Latin America Bioequivalence Studies Market Estimates and Forecasts, By Molecule Type (2020-2032) (USD Million)
10.6.5 Latin America Bioequivalence Studies Market Estimates and Forecasts, By Therapeutic Area (2020-2032) (USD Million)
10.6.6 Brazil
10.6.6.1 Brazil Bioequivalence Studies Market Estimates and Forecasts, By Dosage Form (2020-2032) (USD Million)
10.6.6.2 Brazil Bioequivalence Studies Market Estimates and Forecasts, By Molecule Type (2020-2032) (USD Million)
10.6.6.3 Brazil Bioequivalence Studies Market Estimates and Forecasts, By Therapeutic Area (2020-2032) (USD Million)
10.6.7 Argentina
10.6.7.1 Argentina Bioequivalence Studies Market Estimates and Forecasts, By Dosage Form (2020-2032) (USD Million)
10.6.7.2 Argentina Bioequivalence Studies Market Estimates and Forecasts, By Molecule Type (2020-2032) (USD Million)
10.6.7.3 Argentina Bioequivalence Studies Market Estimates and Forecasts, By Therapeutic Area (2020-2032) (USD Million)
10.6.8 Colombia
10.6.8.1 Colombia Bioequivalence Studies Market Estimates and Forecasts, By Dosage Form (2020-2032) (USD Million)
10.6.8.2 Colombia Bioequivalence Studies Market Estimates and Forecasts, By Molecule Type (2020-2032) (USD Million)
10.6.8.3 Colombia Bioequivalence Studies Market Estimates and Forecasts, By Therapeutic Area (2020-2032) (USD Million)
10.6.9 Rest of Latin America
10.6.9.1 Rest of Latin America Bioequivalence Studies Market Estimates and Forecasts, By Dosage Form (2020-2032) (USD Million)
10.6.9.2 Rest of Latin America Bioequivalence Studies Market Estimates and Forecasts, By Molecule Type (2020-2032) (USD Million)
10.6.9.3 Rest of Latin America Bioequivalence Studies Market Estimates and Forecasts, By Therapeutic Area (2020-2032) (USD Million)
11. Company Profiles
11.1 CliniExperts
11.1.1 Company Overview
11.1.2 Financial
11.1.3 Products/ Services Offered
11.1.4 SWOT Analysis
11.2 ProRelix Services LLP
11.2.1 Company Overview
11.2.2 Financial
11.2.3 Products/ Services Offered
11.2.4 SWOT Analysis
11.3 IQVIA
11.3.1 Company Overview
11.3.2 Financial
11.3.3 Products/ Services Offered
11.3.4 SWOT Analysis
11.4 ICON plc
11.4.1 Company Overview
11.4.2 Financial
11.4.3 Products/ Services Offered
11.4.4 SWOT Analysis
11.5 Charles River Laboratories
11.5.1 Company Overview
11.5.2 Financial
11.5.3 Products/ Services Offered
11.5.4 SWOT Analysis
11.6 Labcorp Drug Development
11.6.1 Company Overview
11.6.2 Financial
11.6.3 Products/ Services Offered
11.6.4 SWOT Analysis
11.7 KYMOS Group
11.7.1 Company Overview
11.7.2 Financial
11.7.3 Products/ Services Offered
11.7.4 SWOT Analysis
11.8 Veeda Clinical Research
11.8.1 Company Overview
11.8.2 Financial
11.8.3 Products/ Services Offered
11.8.4 SWOT Analysis
11.9 Notrox Research
11.9.1 Company Overview
11.9.2 Financial
11.9.3 Products/ Services Offered
11.9.4 SWOT Analysis
11.10 NorthEast BioAnalytical Laboratories LLC
11.10.1 Company Overview
11.10.2 Financial
11.10.3 Products/ Services Offered
11.10.4 SWOT Analysis
12. Use Cases and Best Practices
13. Conclusion
An accurate research report requires proper strategizing as well as implementation. There are multiple factors involved in the completion of good and accurate research report and selecting the best methodology to compete the research is the toughest part. Since the research reports we provide play a crucial role in any company’s decision-making process, therefore we at SNS Insider always believe that we should choose the best method which gives us results closer to reality. This allows us to reach at a stage wherein we can provide our clients best and accurate investment to output ratio.
Each report that we prepare takes a timeframe of 350-400 business hours for production. Starting from the selection of titles through a couple of in-depth brain storming session to the final QC process before uploading our titles on our website we dedicate around 350 working hours. The titles are selected based on their current market cap and the foreseen CAGR and growth.
The 5 steps process:
Step 1: Secondary Research:
Secondary Research or Desk Research is as the name suggests is a research process wherein, we collect data through the readily available information. In this process we use various paid and unpaid databases which our team has access to and gather data through the same. This includes examining of listed companies’ annual reports, Journals, SEC filling etc. Apart from this our team has access to various associations across the globe across different industries. Lastly, we have exchange relationships with various university as well as individual libraries.

Step 2: Primary Research
When we talk about primary research, it is a type of study in which the researchers collect relevant data samples directly, rather than relying on previously collected data. This type of research is focused on gaining content specific facts that can be sued to solve specific problems. Since the collected data is fresh and first hand therefore it makes the study more accurate and genuine.
We at SNS Insider have divided Primary Research into 2 parts.
Part 1 wherein we interview the KOLs of major players as well as the upcoming ones across various geographic regions. This allows us to have their view over the market scenario and acts as an important tool to come closer to the accurate market numbers. As many as 45 paid and unpaid primary interviews are taken from both the demand and supply side of the industry to make sure we land at an accurate judgement and analysis of the market.
This step involves the triangulation of data wherein our team analyses the interview transcripts, online survey responses and observation of on filed participants. The below mentioned chart should give a better understanding of the part 1 of the primary interview.

Part 2: In this part of primary research the data collected via secondary research and the part 1 of the primary research is validated with the interviews from individual consultants and subject matter experts.
Consultants are those set of people who have at least 12 years of experience and expertise within the industry whereas Subject Matter Experts are those with at least 15 years of experience behind their back within the same space. The data with the help of two main processes i.e., FGDs (Focused Group Discussions) and IDs (Individual Discussions). This gives us a 3rd party nonbiased primary view of the market scenario making it a more dependable one while collation of the data pointers.
Step 3: Data Bank Validation
Once all the information is collected via primary and secondary sources, we run that information for data validation. At our intelligence centre our research heads track a lot of information related to the market which includes the quarterly reports, the daily stock prices, and other relevant information. Our data bank server gets updated every fortnight and that is how the information which we collected using our primary and secondary information is revalidated in real time.

Step 4: QA/QC Process
After all the data collection and validation our team does a final level of quality check and quality assurance to get rid of any unwanted or undesired mistakes. This might include but not limited to getting rid of the any typos, duplication of numbers or missing of any important information. The people involved in this process include technical content writers, research heads and graphics people. Once this process is completed the title gets uploader on our platform for our clients to read it.
Step 5: Final QC/QA Process:
This is the last process and comes when the client has ordered the study. In this process a final QA/QC is done before the study is emailed to the client. Since we believe in giving our clients a good experience of our research studies, therefore, to make sure that we do not lack at our end in any way humanly possible we do a final round of quality check and then dispatch the study to the client.
Key Segments:
By Dosage Form
Solid Oral Dosage
Topical Products
Parenteral Formulations
Others
By Molecule Type
Small Molecule
Large Molecule
By Therapeutic Area
Oncology
Neurology
Immunology
Metabolic Disorders
Hematology
Others
Request for Segment Customization as per your Business Requirement: Segment Customization Request
Regional Coverage:
North America
US
Canada
Mexico
Europe
Eastern Europe
Poland
Romania
Hungary
Turkey
Rest of Eastern Europe
Western Europe
Germany
France
UK
Italy
Spain
Netherlands
Switzerland
Austria
Rest of Western Europe
Asia Pacific
China
India
Japan
South Korea
Vietnam
Singapore
Australia
Rest of Asia Pacific
Middle East & Africa
Middle East
UAE
Egypt
Saudi Arabia
Qatar
Rest of Middle East
Africa
Nigeria
South Africa
Rest of Africa
Latin America
Brazil
Argentina
Colombia
Rest of Latin America
Request for Country Level Research Report: Country Level Customization Request
Available Customization
With the given market data, SNS Insider offers customization as per the company’s specific needs. The following customization options are available for the report:
Detailed Volume Analysis
Criss-Cross segment analysis (e.g. Product X Application)
Competitive Product Benchmarking
Geographic Analysis
Additional countries in any of the regions
Customized Data Representation
Detailed analysis and profiling of additional market players
The Wellness Supplements Market was valued at USD 245.41 billion in 2023 and is expected to reach USD 470.93 billion by 2032, growing at a CAGR of 7.51% from 2024 to 2032.
The Infertility Treatment Market Size was USD 1.745 billion in 2023 & is expected to reach USD 3.512 Bn by 2032, growing at a CAGR of 8.02% from 2024-2032.
The Laser Hair Removal Market Size was valued at USD 1.23 billion in 2023 and is witnessed to reach USD 5.02 billion by 2032 and grow at a CAGR of 17.81% over the forecast period 2024-2032.
The Genomics Biomarker Market was valued at USD 4.84 billion in 2023, is expected to reach USD 10.39 billion by 2032, growing at a CAGR of 8.89% from 2024-2032.
The liquid biopsy market size is projected to grow from USD 7.20 billion in 2023 to USD 21.78 billion by 2032, at a CAGR of 13.11% during 2024–2032.
Immunoassay Analyzers Market was valued at USD 7.55 billion in 2023, expected to reach USD 10.16 billion by 2032, growing at a CAGR of 3.38% from 2024-2032.

Hi! Click one of our member below to chat on Phone
© 2025 All Rights Reserved by SNS Insider Pvt Ltd


