image

Bio Solvents Market Report Scope & Overview:

Bio Solvents Market Revenue Analysis

Get More Information on Bio Solvents Market - Request Sample Report

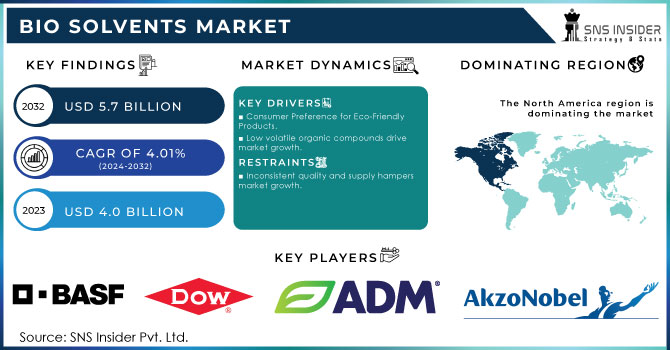
The Bio Solvents Market Size was valued at USD 4.0 Billion in 2023. It is expected to grow to USD 5.7 Billion by 2032 and grow at a CAGR of 4.01% over the forecast period of 2024-2032.

The global bio-solvents market is primarily driven by the increasing environmental concerns and the stringent government regulations. This is because of their environmentally-friendly nature where their ability to derive from natural feedstock such as vegetables has been beneficial in their increased productivity. Furthermore, the increasing demand for bio-solvents is from the key end-use industries such as paints and coatings, adhesives, and pharmaceutical industries, which is increasing their growth.

In 2023, the European Commission reported that bio-based solvents accounted for approximately 15% of the total solvents market in the EU, driven by stringent regulations under the EU Green Deal and the REACH (Registration, Evaluation, Authorisation, and Restriction of Chemicals) regulation, which encourage the use of eco-friendly alternatives to reduce environmental impact.

Advancements in technology and an increase in R&D activities have carried the development of high-quality performance bio-solvents, hence their demands. For instance, there are strict regulations by the U.S. government and the European Union requiring biomaterials in the manufacturing of the products.

The regulations play a significant role in explaining the shape of the global bio-solvents market as they have made it a requirement for chemical manufacturers and related industries to employ the use of bio-based products. For example, the Farm Security and Rural Investment Act of the Public Law 107-171 in the U.S. and the Registration, Evaluation, Authorization, and Restriction of Chemicals by the European Union is a response to the risks associated with the use of synthetic solvents.

In 2023, Evonik introduced VESTASOL IP, a bio-solvent for coatings and paints, which aligns with the European Union’s Green Deal regulations for reducing volatile organic compounds (VOCs).

Synthetic solvents can irritate the skin, eyes, and nose, and their use releases volatile organic compounds that are harmful to the environment. The health impact of such synthetic solvents ranges from dizziness, headache, and unconsciousness if inhaled. Major restrictions from the leading authorities in most countries, especially in Europe and North America will as well fuel the bio-solvents market as they are meant to limit the use of these toxic solvents. For example, it is reported that the EPA and the DEFRA have imposed restrictions on the toxicity content of the solvents. 

Bio Solvents Market Dynamics

Drivers

  • Consumer Preference for Eco-Friendly Products.

  • Low volatile organic compounds drive market growth.

Bio solvents are highly favored in the industries on account of their low volatile Organic compounds emanation. VOCs are the core aspects of air pollution as well as the formation of smog, posing adverse health effects, including the respiratory system and long-term exposure-related illnesses. Unlike the petrochemical traditional solvents that emit a lot of VOCs, bio-solvents are derived from nature and have the least impact on the environment. This form of the solvent, therefore, is highly viable for use in paints and coatings, cleaners as well and personal care products which are environmentally sensitive and rely on minimal air pollution. Governments across the globe impose stringent regulations to limit VOCs. Therefore, all industries are required to adopt bio-solvents as their core constituent.

This form of the solvent complies with the regulation and the tendency of investing in a sustainable alternative secures the green aspect. The European Environment Agency (EEA) noted that bio-solvents, which typically emit 60-90% fewer VOCs compared to petrochemical solvents, have played a crucial role in reducing urban air pollution across the EU in alignment with the Clean Air for Europe (CAFE) Directive.

Restraint

  • Inconsistent quality and supply hampers market growth.

The key factor that restricts the expansion of the bio-solvents market is the inconsistency in their quality and supply. As raw materials undergo many changes when grown, such as vegetable oils and other natural feedstocks, it is hard to predict and ensure the uniform quality of the final product. Their quality may change from yield to yield, making them hard to rely on in industrial applications. As a result, potential manufacturers are hesitant about using bio-solvents instead of traditional ones for their needs, such as in paints, coatings, or adhesives, which require the same properties throughout the final product’s lifespan. In addition, the supply can be disrupted due to many factors, such as the failure of a provider to deliver a specific amount, variability in agriculture yields due to seasonality, and fierce competition with other potential users, limiting the product’s availability at best. Potential manufacturers would stop using bio-solvents, as they are unable to ensure that consistent supplies are used for the manufacturing process. As a result, they would stick to traditional solvents with predictable supply chains, thus inhibiting the bio-solvents market’s growth.

Opportunity

  • Technological Advancements in Production Processes

  • Rising Regulations Against Hazardous Chemicals

Bio Solvents Market Segmentation Overview

By Product

The bio-alcohol product segment dominated the market and accounted for a share of 47% in 2023. Bio-alcohols are widely adopted by industries such as pharmaceuticals, food, and beverages, where bioethanol and biobutanol serve as greener alternatives to petrochemical solvents. Enhanced performance and lower operating costs of bioethanol and biobutanol fuel their high usage. Their sustainable availability is crucial, with the increasing demand for eco-friendly products. The repelling properties offered enable their adoption by various industries. Moreover, supportive government regulations promoting industries to use renewable resources have contributed to their adoption. Industries are focused on reducing their carbon footprints and minimizing the environmental impacts, which is expected to fuel their execution ability, further boosting the bio-alcohol segment growth.

The D-Limonene segment is anticipated to grow at the fastest CAGR of 4.8% from 2024 to 2032. D-Limonene, derived from citrus fruits, is valued for biodegradability, non-toxicity, and pleasant aroma, which is consumed in a variety of cleaning products, adhesives, and coatings. It owes this application growth to the ongoing shift toward eco-friendly and safe alternatives for industrial and consumer products fostered by the growing awareness regarding health and environmental safety. Such a trend is projected to be enhanced by advancements in extraction technologies, which may improve its competitive advantage.
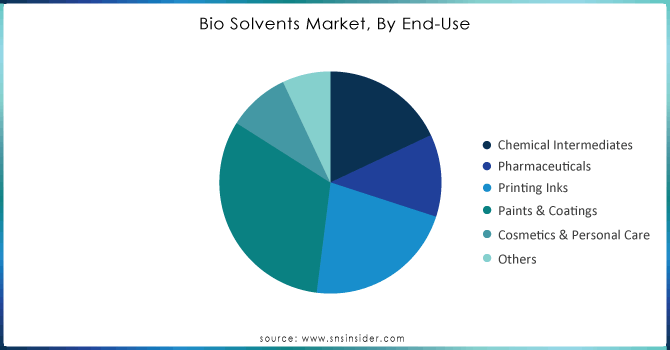
By End-Use

The paint & coatings held the largest market share around 32% in 2023. This is due to the increasing demand for environmentally friendly and sustainable solutions within the coatings industry. The expanding landscape of chemical manufacturers is therefore anticipated to boost the significant growth and thus the segment’s dominance in the forthcoming years. Moreover, with the growing demand for green products by end-consumers alongside strict VOC regulations and an increasing number of manufacturers adopting bio-solvents, the segment will dominate the market share through the forecast period. In addition, the dominance of the segment is attributed to the emergence of bio-solvent formulations.

The latter have expedited their use in an extensive range of coating materials such as waterborne and high-solids systems and have not only boosted their performance but also reduced the environmental impact of these coatings. Therefore, bio solvents are nowadays mainly used in both industrial and decorative applications as the increasing construction and automotive industries also focus on sustainable practices

Bio-Solvents-Market-By-End-Use

Need any customization research on Bio Solvents Market - Enquiry Now

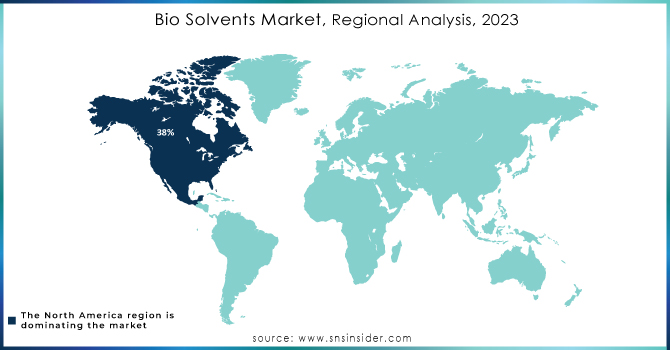
Bio Solvents Market Regional Analysis

North America held the largest market share around 38% in 2023. High demand for ecologically friendly substitutes for traditional petroleum-based solvent cleaners drives the North America bio solvents market. Moreover, with such industry leaders as Cargill Incorporated and Stepan Company operating in the region, North America becomes a core for bio solvents development and commercialization. The U.S. held the largest share of the market in 2023 due to environmental regulations, increased consumer awareness of eco-friendly and healthful products, technological advances, government support, increasing application areas, and global sustainability initiatives. Canada bio solvents market is projected to expand significantly from 2024 to 2032, with the demand being fuelled by the active promotion of renewable resource adoption that sustains and increases demand for bio solvents. Moreover, research and development efforts are increasing, which makes the bio solvents more cost- and performance-effective, making them the perfect alternative to traditional solvents.

Bio-Solvents-Market-Regional-Analysis-2023

Key Players in Bio Solvents Market

  • BASF SE (Sovermol, Lutropur)

  • Dow Inc. (Bio-Prima, Dowanol PnB)

  • Archer Daniels Midland Company (ADM BioSolutions)

  • Cargill, Incorporated (Envirotemp FR3, NatureWax)

  • Corbion N.V. (PURASOLV, PURALACT)

  • AkzoNobel N.V. (Berol, Dissolvine)

  • LyondellBasell Industries Holdings B.V. (Tetrahydrofuran, Bio-based PG)

  • Evonik Industries AG (VESTASOL IP, Rewoferm)

  • Solvay S.A. (Rhodiasolv IRIS, Augeo SL 191)

  • Eastman Chemical Company (BioSustane, Eastman Omnia)

  • Gevo, Inc. (Isobutanol, Ethanol)

  • Stepan Company (STEPOSOL MET-10U, STEPOSOL C-42)

  • GFBiochemicals Ltd. (Levoglucosenone, Gamma-Valerolactone)

  • Myriant Corporation (Bio-based Succinic Acid)

  • Flotek Industries, Inc. (Complex Nano-Fluid, Bio-based Citrus Solvents)

  • Vertec BioSolvents Inc. (VertecBio ELSOL)

  • Azelis SA (ECO-Bio Solvent, GreenBios)

  • Ashland Global Holdings Inc. (Envirez, Greenchem)

  • SEPPIC S.A. (Sepisol, Simulsol)

  • Sasol Limited (Lactosolv, Alkylate Bio-Solvents) 

Recent Development:

  • In 2023, BASF expanded its portfolio of sustainable solvents by launching Sovermol 830, a bio-based, non-toxic solvent targeting the coatings industry, enhancing performance while reducing environmental impact.

  • In 2023, Cargill introduced its next-generation bio-based dielectric fluid, Envirotemp FR3, which supports sustainability initiatives and reduces the dependency on petroleum-based solvents.

  • In 2023, Dow introduced Bio-Prima, a new line of bio-based solvents derived from renewable sources. This product line focuses on reducing carbon emissions in industrial applications.

Bio Solvents Market Report Scope

Report Attributes Details
Market Size in 2023 US$ 4.0 Billion
Market Size by 2032 US$ 5.7 Billion
CAGR CAGR of 4.01% From 2024 to 2032
Base Year 2023
Forecast Period 2024-2032
Historical Data 2020-2022
Report Scope & Coverage Market Size, Segments Analysis, Competitive  Landscape, Regional Analysis, DROC & SWOT Analysis, Forecast Outlook
Key Segments  
• By Product (Bio-alcohols, Glycerol Derivatives, D-Limonene, Lactate Esters, 2-Methyltetrahydrofuran, and Others),

• By End-Use (Chemical Intermediates, Pharmaceuticals, Printing Inks, Paints & Coatings, Cosmetics & Personal Care, Others),
Regional Analysis/Coverage North America (US, Canada, Mexico), Europe (Eastern Europe [Poland, Romania, Hungary, Turkey, Rest of Eastern Europe] Western Europe] Germany, France, UK, Italy, Spain, Netherlands, Switzerland, Austria, Rest of Western Europe]), Asia Pacific (China, India, Japan, South Korea, Vietnam, Singapore, Australia, Rest of Asia Pacific), Middle East & Africa (Middle East [UAE, Egypt, Saudi Arabia, Qatar, Rest of Middle East], Africa [Nigeria, South Africa, Rest of Africa], Latin America (Brazil, Argentina, Colombia, Rest of Latin America)
Company Profiles BASF SE Dow Inc. Archer Daniels Midland Company Cargill, Incorporated Corbion N.V. AkzoNobel N.V. LyondellBasell Industries Holdings B.V. Evonik Industries AG Solvay S.A. Eastman Chemical Company Gevo, Inc. Stepan Company GFBiochemicals Ltd. Myriant Corporation Flotek Industries, Inc. Vertec BioSolvents Inc. Azelis SA Ashland Global Holdings Inc. SEPPIC S.A. Sasol Limited and Others
Key Drivers •Consumer Preference for Eco-Friendly Products.
• Low volatile organic compounds drive market growth.
RESTRAINTS •Inconsistent quality and supply hampers market growth.  

Frequently Asked Questions

Ans: The Bio Solvents Market was valued at USD 4.0 billion in 2023.

Ans: The expected CAGR of the global Bio Solvents Market during the forecast period is 4.01%.

Ans: The paint & coatings segment grow rapidly in the Bio Solvents Market from 2024-2032.

Ans: Rising Regulations Against Hazardous Chemicals Bio Solvents Market.

Ans: The U.S. led the Bio Solvents Market in North America region with the highest revenue share in 2023.

Table of Content

1. Introduction

1.1 Market Definition

1.2 Scope (Inclusion and Exclusions)

1.3 Research Assumptions

2. Executive Summary

2.1 Market Overview

2.2 Regional Synopsis

2.3 Competitive Summary

3. Research Methodology

3.1 Top-Down Approach

3.2 Bottom-up Approach

3.3. Data Validation

3.4 Primary Interviews

4. Market Dynamics Impact Analysis

3.1 Market Driving Factors Analysis

3.1.2 Drivers

3.1.2 Restraints

3.1.3 Opportunities

3.1.4 Challenges

3.2 PESTLE Analysis

3.3 Porter’s Five Forces Model

5. Statistical Insights and Trends Reporting

5.1 Production Capacity and Utilization, by Country, by Type, 2023

5.2 Feedstock Prices, by Country, by Type, 2023

5.3   Regulatory Impact, by l Country, by Type, 2023.

5.4 Environmental Metrics: Emissions Data, Waste Management Practices, and Sustainability Initiatives, by Region

5.5 Innovation and R&D, by Type, 2023

6. Competitive Landscape

6.1 List of Major Companies, By Region

6.2 Market Share Analysis, By Region

6.3 Product Benchmarking

6.3.1 Product specifications and features

6.3.2 Pricing

6.4 Strategic Initiatives

6.4.1 Marketing and promotional activities

6.4.2 Distribution and supply chain strategies

6.4.3 Expansion plans and new Product launches

6.4.4 Strategic partnerships and collaborations

6.5 Technological Advancements

6.6 Market Positioning and Branding

7. Bio Solvents Market Segmentation, by Product

7.1 Chapter Overview

7.2 Bio-alcohols

        7.2.1 Bio-alcohols Market Trends Analysis (2020-2032)

7.2.2 Bio-alcohols Market Size Estimates and Forecasts to 2032 (USD Billion)

7.3 Glycerol Derivatives

       7.3.1 Glycerol Derivatives Market Trends Analysis (2020-2032)

       7.3.2 Glycerol Derivatives Market Size Estimates and Forecasts to 2032 (USD Billion)

7.4 D-Limonene

        7.4.1 D-Limonene Market Trends Analysis (2020-2032)

7.4.2 D-Limonene Market Size Estimates and Forecasts to 2032 (USD Billion)

7.5 Lactate Esters

       7.5.1 Lactate Esters Market Trends Analysis (2020-2032)

       7.5.2 Lactate Esters Market Size Estimates and Forecasts to 2032 (USD Billion)

7.6 2-Methyltetrahydrofuran

       7.6.1 2-Methyltetrahydrofuran Market Trends Analysis (2020-2032)

       7.6.2 2-Methyltetrahydrofuran Market Size Estimates and Forecasts to 2032 (USD Billion)

7.7 Others

       7.7.1 Others Market Trends Analysis (2020-2032)

       7.7.2 Others Market Size Estimates and Forecasts to 2032 (USD Billion)

8. Bio Solvents Market Segmentation, by End-Use

8.1 Chapter Overview

8.2 Chemical Intermediates

        8.2.1 Chemical Intermediates Market Trends Analysis (2020-2032)

8.2.2 Chemical Intermediates Market Size Estimates and Forecasts to 2032 (USD Billion)

8.3 Pharmaceuticals

        8.3.1 Pharmaceuticals Market Trends Analysis (2020-2032)

8.3.2 Pharmaceuticals Market Size Estimates and Forecasts to 2032 (USD Billion)

8.4 Printing Inks         

        8.4.1 Printing Inks Market Trends Analysis (2020-2032)

8.4.2 Printing Inks Market Size Estimates and Forecasts to 2032 (USD Billion)

8.5 Paints & Coatings

        8.5.1 Paints & Coatings Market Trends Analysis (2020-2032)

8.5.2 Paints & Coatings Market Size Estimates and Forecasts to 2032 (USD Billion)

8.6 Cosmetics & Personal Care       

        8.6.1 Cosmetics & Personal Care Market Trends Analysis (2020-2032)

8.6.2 Cosmetics & Personal Care Market Size Estimates and Forecasts to 2032 (USD Billion)

8.7 Others

        8.7.1 Others Market Trends Analysis (2020-2032)

8.7.2 Others Market Size Estimates and Forecasts to 2032 (USD Billion)

9. Regional Analysis

9.1 Chapter Overview

9.2 North America

9.2.1 Trends Analysis

9.2.2 North America Bio Solvents Market Estimates and Forecasts, by Country (2020-2032) (USD Billion)

9.2.3 North America Bio Solvents Market Estimates and Forecasts, by Product (2020-2032) (USD Billion)  

9.2.4 North America Bio Solvents Market Estimates and Forecasts, by End-Use (2020-2032) (USD Billion)

9.2.5 USA

9.2.5.1 USA Bio Solvents Market Estimates and Forecasts, by Product (2020-2032) (USD Billion)

9.2.5.2 USA Bio Solvents Market Estimates and Forecasts, by End-Use (2020-2032) (USD Billion)

9.2.6 Canada

9.2.6.1 Canada Bio Solvents Market Estimates and Forecasts, by Product (2020-2032) (USD Billion)

9.2.6.2 Canada Bio Solvents Market Estimates and Forecasts, by End-Use (2020-2032) (USD Billion)

9.2.7 Mexico

9.2.7.1 Mexico Bio Solvents Market Estimates and Forecasts, by Product (2020-2032) (USD Billion)

9.2.7.2 Mexico Bio Solvents Market Estimates and Forecasts, by End-Use (2020-2032) (USD Billion)

9.3 Europe

9.3.1 Eastern Europe

9.3.1.1 Trends Analysis

9.3.1.2 Eastern Europe Bio Solvents Market Estimates and Forecasts, by Country (2020-2032) (USD Billion)

9.3.1.3 Eastern Europe Bio Solvents Market Estimates and Forecasts, by Product (2020-2032) (USD Billion)  

9.3.1.4 Eastern Europe Bio Solvents Market Estimates and Forecasts, by End-Use (2020-2032) (USD Billion)

9.3.1.5 Poland

9.3.1.5.1 Poland Bio Solvents Market Estimates and Forecasts, by Product (2020-2032) (USD Billion)

9.3.1.5.2 Poland Bio Solvents Market Estimates and Forecasts, by End-Use (2020-2032) (USD Billion)

9.3.1.6 Romania

9.3.1.6.1 Romania Bio Solvents Market Estimates and Forecasts, by Product (2020-2032) (USD Billion)

9.3.1.6.2 Romania Bio Solvents Market Estimates and Forecasts, by End-Use (2020-2032) (USD Billion)

9.3.1.7 Hungary

9.3.1.7.1 Hungary Bio Solvents Market Estimates and Forecasts, by Product (2020-2032) (USD Billion)

9.3.1.7.2 Hungary Bio Solvents Market Estimates and Forecasts, by End-Use (2020-2032) (USD Billion)

9.3.1.8 Turkey

9.3.1.8.1 Turkey Bio Solvents Market Estimates and Forecasts, by Product (2020-2032) (USD Billion)

9.3.1.8.2 Turkey Bio Solvents Market Estimates and Forecasts, by End-Use (2020-2032) (USD Billion)

9.3.1.9 Rest of Eastern Europe

9.3.1.9.1 Rest of Eastern Europe Bio Solvents Market Estimates and Forecasts, by Product (2020-2032) (USD Billion)

9.3.1.9.2 Rest of Eastern Europe Bio Solvents Market Estimates and Forecasts, by End-Use (2020-2032) (USD Billion)

9.3.2 Western Europe

9.3.2.1 Trends Analysis

9.3.2.2 Western Europe Bio Solvents Market Estimates and Forecasts, by Country (2020-2032) (USD Billion)

9.3.2.3 Western Europe Bio Solvents Market Estimates and Forecasts, by Product (2020-2032) (USD Billion)  

9.3.2.4 Western Europe Bio Solvents Market Estimates and Forecasts, by End-Use (2020-2032) (USD Billion)

9.3.2.5 Germany

9.3.2.5.1 Germany Bio Solvents Market Estimates and Forecasts, by Product (2020-2032) (USD Billion)

9.3.2.5.2 Germany Bio Solvents Market Estimates and Forecasts, by End-Use (2020-2032) (USD Billion)

9.3.2.6 France

9.3.2.6.1 France Bio Solvents Market Estimates and Forecasts, by Product (2020-2032) (USD Billion)

9.3.2.6.2 France Bio Solvents Market Estimates and Forecasts, by End-Use (2020-2032) (USD Billion)

9.3.2.7 UK

9.3.2.7.1 UK Bio Solvents Market Estimates and Forecasts, by Product (2020-2032) (USD Billion)

9.3.2.7.2 UK Bio Solvents Market Estimates and Forecasts, by End-Use (2020-2032) (USD Billion)

9.3.2.8 Italy

9.3.2.8.1 Italy Bio Solvents Market Estimates and Forecasts, by Product (2020-2032) (USD Billion)

9.3.2.8.2 Italy Bio Solvents Market Estimates and Forecasts, by End-Use (2020-2032) (USD Billion)

9.3.2.9 Spain

9.3.2.9.1 Spain Bio Solvents Market Estimates and Forecasts, by Product (2020-2032) (USD Billion)

9.3.2.9.2 Spain Bio Solvents Market Estimates and Forecasts, by End-Use (2020-2032) (USD Billion)

9.3.2.10 Netherlands

9.3.2.10.1 Netherlands Bio Solvents Market Estimates and Forecasts, by Product (2020-2032) (USD Billion)

9.3.2.10.2 Netherlands Bio Solvents Market Estimates and Forecasts, by End-Use (2020-2032) (USD Billion)

9.3.2.11 Switzerland

9.3.2.11.1 Switzerland Bio Solvents Market Estimates and Forecasts, by Product (2020-2032) (USD Billion)

9.3.2.11.2 Switzerland Bio Solvents Market Estimates and Forecasts, by End-Use (2020-2032) (USD Billion)

9.3.2.12 Austria

9.3.2.12.1 Austria Bio Solvents Market Estimates and Forecasts, by Product (2020-2032) (USD Billion)

9.3.2.12.2 Austria Bio Solvents Market Estimates and Forecasts, by End-Use (2020-2032) (USD Billion)

9.3.2.13 Rest of Western Europe

9.3.2.13.1 Rest of Western Europe Bio Solvents Market Estimates and Forecasts, by Product (2020-2032) (USD Billion)

9.3.2.13.2 Rest of Western Europe Bio Solvents Market Estimates and Forecasts, by End-Use (2020-2032) (USD Billion)

9.4 Asia Pacific

9.4.1 Trends Analysis

9.4.2 Asia Pacific Bio Solvents Market Estimates and Forecasts, by Country (2020-2032) (USD Billion)

9.4.3 Asia Pacific Bio Solvents Market Estimates and Forecasts, by Product (2020-2032) (USD Billion)  

9.4.4 Asia Pacific Bio Solvents Market Estimates and Forecasts, by End-Use (2020-2032) (USD Billion)

9.4.5 China

9.4.5.1 China Bio Solvents Market Estimates and Forecasts, by Product (2020-2032) (USD Billion)

9.4.5.2 China Bio Solvents Market Estimates and Forecasts, by End-Use (2020-2032) (USD Billion)

9.4.6 India

9.4.5.1 India Bio Solvents Market Estimates and Forecasts, by Product (2020-2032) (USD Billion)

9.4.5.2 India Bio Solvents Market Estimates and Forecasts, by End-Use (2020-2032) (USD Billion)

9.4.5 Japan

9.4.5.1 Japan Bio Solvents Market Estimates and Forecasts, by Product (2020-2032) (USD Billion)

9.4.5.2 Japan Bio Solvents Market Estimates and Forecasts, by End-Use (2020-2032) (USD Billion)

9.4.6 South Korea

9.4.6.1 South Korea Bio Solvents Market Estimates and Forecasts, by Product (2020-2032) (USD Billion)

9.4.6.2 South Korea Bio Solvents Market Estimates and Forecasts, by End-Use (2020-2032) (USD Billion)

9.4.7 Vietnam

9.4.7.1 Vietnam Bio Solvents Market Estimates and Forecasts, by Product (2020-2032) (USD Billion)

9.2.7.2 Vietnam Bio Solvents Market Estimates and Forecasts, by End-Use (2020-2032) (USD Billion)

9.4.8 Singapore

9.4.8.1 Singapore Bio Solvents Market Estimates and Forecasts, by Product (2020-2032) (USD Billion)

9.4.8.2 Singapore Bio Solvents Market Estimates and Forecasts, by End-Use (2020-2032) (USD Billion)

9.4.9 Australia

9.4.9.1 Australia Bio Solvents Market Estimates and Forecasts, by Product (2020-2032) (USD Billion)

9.4.9.2 Australia Bio Solvents Market Estimates and Forecasts, by End-Use (2020-2032) (USD Billion)

9.4.10 Rest of Asia Pacific

9.4.10.1 Rest of Asia Pacific Bio Solvents Market Estimates and Forecasts, by Product (2020-2032) (USD Billion)

9.4.10.2 Rest of Asia Pacific Bio Solvents Market Estimates and Forecasts, by End-Use (2020-2032) (USD Billion)

9.5 Middle East and Africa

9.5.1 Middle East

9.5.1.1 Trends Analysis

9.5.1.2 Middle East Bio Solvents Market Estimates and Forecasts, by Country (2020-2032) (USD Billion)

9.5.1.3 Middle East Bio Solvents Market Estimates and Forecasts, by Product (2020-2032) (USD Billion)  

9.5.1.4 Middle East Bio Solvents Market Estimates and Forecasts, by End-Use (2020-2032) (USD Billion)

9.5.1.5 UAE

9.5.1.5.1 UAE Bio Solvents Market Estimates and Forecasts, by Product (2020-2032) (USD Billion)

9.5.1.5.2 UAE Bio Solvents Market Estimates and Forecasts, by End-Use (2020-2032) (USD Billion)

9.5.1.6 Egypt

9.5.1.6.1 Egypt Bio Solvents Market Estimates and Forecasts, by Product (2020-2032) (USD Billion)

9.5.1.6.2 Egypt Bio Solvents Market Estimates and Forecasts, by End-Use (2020-2032) (USD Billion)

9.5.1.7 Saudi Arabia

9.5.1.7.1 Saudi Arabia Bio Solvents Market Estimates and Forecasts, by Product (2020-2032) (USD Billion)

9.5.1.7.2 Saudi Arabia Bio Solvents Market Estimates and Forecasts, by End-Use (2020-2032) (USD Billion)

9.5.1.8 Qatar

9.5.1.8.1 Qatar Bio Solvents Market Estimates and Forecasts, by Product (2020-2032) (USD Billion)

9.5.1.8.2 Qatar Bio Solvents Market Estimates and Forecasts, by End-Use (2020-2032) (USD Billion)

9.5.1.9 Rest of Middle East

9.5.1.9.1 Rest of Middle East Bio Solvents Market Estimates and Forecasts, by Product (2020-2032) (USD Billion)

9.5.1.9.2 Rest of Middle East Bio Solvents Market Estimates and Forecasts, by End-Use (2020-2032) (USD Billion)

9.5.2 Africa

9.5.2.1 Trends Analysis

9.5.2.2 Africa Bio Solvents Market Estimates and Forecasts, by Country (2020-2032) (USD Billion)

9.5.2.3 Africa Bio Solvents Market Estimates and Forecasts, by Product (2020-2032) (USD Billion)  

9.5.2.4 Africa Bio Solvents Market Estimates and Forecasts, by End-Use (2020-2032) (USD Billion)

9.5.2.5 South Africa

9.5.2.5.1 South Africa Bio Solvents Market Estimates and Forecasts, by Product (2020-2032) (USD Billion)

9.5.2.5.2 South Africa Bio Solvents Market Estimates and Forecasts, by End-Use (2020-2032) (USD Billion)

9.5.2.6 Nigeria

9.5.2.6.1 Nigeria Bio Solvents Market Estimates and Forecasts, by Product (2020-2032) (USD Billion)

9.5.2.6.2 Nigeria Bio Solvents Market Estimates and Forecasts, by End-Use (2020-2032) (USD Billion)

9.6 Latin America

9.6.1 Trends Analysis

9.6.2 Latin America Bio Solvents Market Estimates and Forecasts, by Country (2020-2032) (USD Billion)

9.6.3 Latin America Bio Solvents Market Estimates and Forecasts, by Product (2020-2032) (USD Billion)  

9.6.4 Latin America Bio Solvents Market Estimates and Forecasts, by End-Use (2020-2032) (USD Billion)

9.6.5 Brazil

9.6.5.1 Brazil Bio Solvents Market Estimates and Forecasts, by Product (2020-2032) (USD Billion)

9.6.5.2 Brazil Bio Solvents Market Estimates and Forecasts, by End-Use (2020-2032) (USD Billion)

9.6.6 Argentina

9.6.6.1 Argentina Bio Solvents Market Estimates and Forecasts, by Product (2020-2032) (USD Billion)

9.6.6.2 Argentina Bio Solvents Market Estimates and Forecasts, by End-Use (2020-2032) (USD Billion)

9.6.7 Colombia

9.6.7.1 Colombia Bio Solvents Market Estimates and Forecasts, by Product (2020-2032) (USD Billion)

9.6.7.2 Colombia Bio Solvents Market Estimates and Forecasts, by End-Use (2020-2032) (USD Billion)

9.6.8 Rest of Latin America

9.6.8.1 Rest of Latin America Bio Solvents Market Estimates and Forecasts, by Product (2020-2032) (USD Billion)

9.6.8.2 Rest of Latin America Bio Solvents Market Estimates and Forecasts, by End-Use (2020-2032) (USD Billion)

10. Company Profiles

           10.1 BASF SE

                          10.1.1 Company Overview

10.1.2 Financial

10.1.3 Products/ Services Offered

10.1.4 SWOT Analysis

           10.2   Dow Inc.

                           10.2.1 Company Overview

10.2.2 Financial

10.2.3 Products/ Services Offered

10.2.4 SWOT Analysis

10.3 Archer Daniels Midland Company

              10.3.1 Company Overview

10.3.2 Financial

10.3.3 Products/ Services Offered

10.3.4 SWOT Analysis

10.4 Cargill, Incorporated

             10.4.1 Company Overview

10.4.2 Financial

10.4.3 Products/ Services Offered

10.4.4 SWOT Analysis

10.5 Corbion N.V.

             10.5.1 Company Overview

10.5.2 Financial

10.5.3 Products/ Services Offered

10.5.4 SWOT Analysis

10.6 AkzoNobel N.V.

             10.6.1 Company Overview

10.6.2 Financial

10.6.3 Products/ Services Offered

10.6.4 SWOT Analysis

10.7 LyondellBasell Industries Holdings B.V.

             10.7.1 Company Overview

10.7.2 Financial

10.7.3 Products/ Services Offered

10.7.4 SWOT Analysis

10.8 Evonik Industries AG

             10.8.1 Company Overview

10.8.2 Financial

10.8.3 Products/ Services Offered

10.8.4 SWOT Analysis

10.9 Solvay S.A.

             10.9.1 Company Overview

10.9.2 Financial

10.9.3 Products/ Services Offered

10.9.4 SWOT Analysis

10.10 Eastman Chemical Company

             10.10.1 Company Overview

10.10.2 Financial

10.10.3 Products/ Services Offered

10.10.4 SWOT Analysis

11. Use Cases and Best Practices

12. Conclusion

An accurate research report requires proper strategizing as well as implementation. There are multiple factors involved in the completion of good and accurate research report and selecting the best methodology to compete the research is the toughest part. Since the research reports we provide play a crucial role in any company’s decision-making process, therefore we at SNS Insider always believe that we should choose the best method which gives us results closer to reality. This allows us to reach at a stage wherein we can provide our clients best and accurate investment to output ratio.

Each report that we prepare takes a timeframe of 350-400 business hours for production. Starting from the selection of titles through a couple of in-depth brain storming session to the final QC process before uploading our titles on our website we dedicate around 350 working hours. The titles are selected based on their current market cap and the foreseen CAGR and growth.


The 5 steps process:

Step 1: Secondary Research:

Secondary Research or Desk Research is as the name suggests is a research process wherein, we collect data through the readily available information. In this process we use various paid and unpaid databases which our team has access to and gather data through the same. This includes examining of listed companies’ annual reports, Journals, SEC filling etc. Apart from this our team has access to various associations across the globe across different industries. Lastly, we have exchange relationships with various university as well as individual libraries.

Secondary Research

Step 2: Primary Research

When we talk about primary research, it is a type of study in which the researchers collect relevant data samples directly, rather than relying on previously collected data.  This type of research is focused on gaining content specific facts that can be sued to solve specific problems. Since the collected data is fresh and first hand therefore it makes the study more accurate and genuine.

We at SNS Insider have divided Primary Research into 2 parts.

Part 1 wherein we interview the KOLs of major players as well as the upcoming ones across various geographic regions. This allows us to have their view over the market scenario and acts as an important tool to come closer to the accurate market numbers. As many as 45 paid and unpaid primary interviews are taken from both the demand and supply side of the industry to make sure we land at an accurate judgement and analysis of the market.

This step involves the triangulation of data wherein our team analyses the interview transcripts, online survey responses and observation of on filed participants. The below mentioned chart should give a better understanding of the part 1 of the primary interview.

Primary Research

Part 2: In this part of primary research the data collected via secondary research and the part 1 of the primary research is validated with the interviews from individual consultants and subject matter experts.

Consultants are those set of people who have at least 12 years of experience and expertise within the industry whereas Subject Matter Experts are those with at least 15 years of experience behind their back within the same space. The data with the help of two main processes i.e., FGDs (Focused Group Discussions) and IDs (Individual Discussions). This gives us a 3rd party nonbiased primary view of the market scenario making it a more dependable one while collation of the data pointers.

Step 3: Data Bank Validation

Once all the information is collected via primary and secondary sources, we run that information for data validation. At our intelligence centre our research heads track a lot of information related to the market which includes the quarterly reports, the daily stock prices, and other relevant information. Our data bank server gets updated every fortnight and that is how the information which we collected using our primary and secondary information is revalidated in real time.

Data Bank Validation

Step 4: QA/QC Process

After all the data collection and validation our team does a final level of quality check and quality assurance to get rid of any unwanted or undesired mistakes. This might include but not limited to getting rid of the any typos, duplication of numbers or missing of any important information. The people involved in this process include technical content writers, research heads and graphics people. Once this process is completed the title gets uploader on our platform for our clients to read it.

Step 5: Final QC/QA Process:

This is the last process and comes when the client has ordered the study. In this process a final QA/QC is done before the study is emailed to the client. Since we believe in giving our clients a good experience of our research studies, therefore, to make sure that we do not lack at our end in any way humanly possible we do a final round of quality check and then dispatch the study to the client.

Key Segments:

By Product

  • Bio-alcohols

  • Glycerol Derivatives

  • D-Limonene

  • Lactate Esters

  • 2-Methyltetrahydrofuran

  • Others

By End-Use

  • Chemical Intermediates

  • Pharmaceuticals

  • Printing Inks

  • Paints & Coatings

  • Cosmetics & Personal Care

  • Others

Request for Segment Customization as per your Business Requirement: Segment Customization Request

Regional Coverage:

North America

  • US

  • Canada

  • Mexico

Europe

  • Eastern Europe

    • Poland

    • Romania

    • Hungary

    • Turkey

    • Rest of Eastern Europe

  • Western Europe

    • Germany

    • France

    • UK

    • Italy

    • Spain

    • Netherlands

    • Switzerland

    • Austria

    • Rest of Western Europe

Asia Pacific

  • China

  • India

  • Japan

  • South Korea

  • Vietnam

  • Singapore

  • Australia

  • Rest of Asia Pacific

Middle East & Africa

  • Middle East

    • UAE

    • Egypt

    • Saudi Arabia

    • Qatar

    • Rest of Middle East

  • Africa

    • Nigeria

    • South Africa

    • Rest of Africa

  • Latin America

  • Brazil

  • Argentina

  • Colombia

  • Rest of Latin America

Request for Country Level Research Report: Country Level Customization Request

Available Customization

With the given market data, SNS Insider offers customization as per the company’s specific needs. The following customization options are available for the report:

  • Product Analysis

  • Criss-Cross segment analysis (e.g. Product X Application)

  • Product Matrix which gives a detailed comparison of product portfolio of each company

  • Geographic Analysis

  • Additional countries in any of the regions

  • Company Information

  • Detailed analysis and profiling of additional market players (Up to five)


  •            5000 (33% Discount)


  •            8950 (40% Discount)


  •            3050 (23% Discount)

Start a Conversation

Hi! Click one of our member below to chat on Phone