image

Bio-Based Polymers Market Report Scope & Overview:

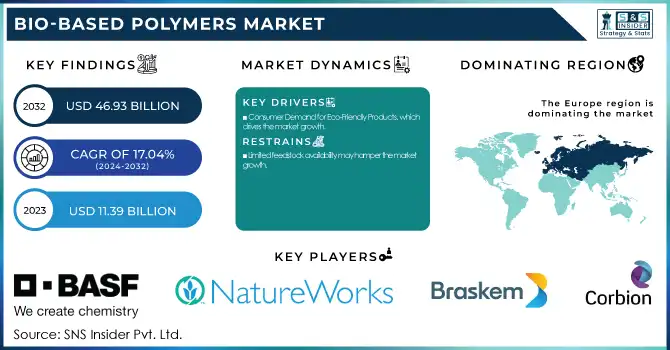
The Bio-Based Polymers Market size was USD 11.39 Billion in 2023 and is expected to reach USD 46.93 Billion by 2032 and grow at a CAGR of 17.04% over the forecast period of 2024-2032. This report delivers comprehensive statistical insights into the bio-based polymer market by analyzing production capacity and utilization by country and polymer type for 2023. It examines feedstock price trends and supply chain dynamics, highlighting regional variations that impact production economics. The report also assesses the regulatory landscape, exploring policy developments that promote sustainable manufacturing and market growth. Additionally, environmental metrics such as emissions data and waste management practices are detailed alongside emerging sustainability initiatives. Finally, innovation trends in R&D and adoption rates across key regions provide a clear picture of market penetration and future potential.

Bio-Based Polymers Market Revenue Analysis

To get more information on Bio-Based Polymers Market - Request Free Sample Report

Bio-Based Polymers Market Dynamics

Drivers

  • Consumer Demand for Eco-Friendly Products, which drives the market growth. 

One of the major factors driving the demand for bio-based polymers is the increasing consumer preference for green products. Consumers today are becoming more conscious of the impact of their purchases on the environment and are seeking out products that use sustainable materials and reduce waste. As consumers become more environmentally aware, companies across all sectors of packaging, automotive, consumer goods, etc. have turned to bio-based polymers as a more sustainable alternative to traditional plastics. With growing awareness and demand for sustainable products, businesses are spending on eco-friendly products to boost their brand value and satisfy market needs. Apart from catalyzing the antagonistic development process, this consumer-driven trend is also triggering innovation across the product development lifecycle of the bio-based polymers industry.

Restraint

  •   Limited feedstock availability may hamper the market growth.

The unavailability of feedstock may limit the growth of the bio-based polymers market by causing slow-moving supply bottlenecks that restrict the scale of production. In contrast, bio-based polymers depend on renewable feedstocks like corn, sugarcane, and other agricultural by-products, which may be influenced by seasonal changes, climate, and their other applications in food and energy. Not only does this contextualize consistency in production but it also causes volatility in pricing due to the difficulty for manufacturers to maintain competitive pricing. Insufficient or unreliable feedstock supply can stifle a mature supply chain, limiting market entry and investment in new production technologies. Consequently, maintaining a reliable and sustainable feedstock supply is still one of the most formidable hurdles for the sector.

Opportunity

Advancements in Feedstock Utilization create market opportunities.

Feedstock conversion technologies Populations of bio-based polymers are emerging with great promise through improvements in the efficient processing of renewable raw materials to fermentable sugars and then into high-value polymers. This holistic approach includes innovations to processing technologies, as well as the utilization of advanced design approaches and machine learning to allow processors to optimize yields and purity on the biopolymer while minimizing waste during enzymatic treatment and fermentation. These advancements not only reduce the cost of production but also allow for the use of a wider variety of agricultural residues and non-food biomass, relieving the strain on conventional feedstocks. As a result, these technology developments are accelerating the scalability and sustainability of bio-based polymers toward becoming a cost-competitive substitute for conventional fossil-based plastics.

Challenges

 Infrastructure and recycling issues may create a challenge for the market.

The infrastructure and recycling issues that bio-based polymers face are major impediments to their widespread adoption and effective utilization. Although these materials are intended to be biodegradable, compostable, or recyclable, their environmental benefits are frequently outweighed because of the lack of appropriate infrastructure to dispose of or process to fully leverage their capabilities. Plastic waste management systems are mostly suited to conventional plastics in many areas, while biopolymers encounter little in recycling or composting facilities. As a result, bio-based polymers can end up in a landfill rather than in a compost facility or biodegradation environment, or they may be mixed with traditional plastics, contaminating their recycling streams and preventing the long-term saving of feedstock for potential reuse

Bio-Based Polymers Market Segmentation

By Type

Poly Latic Acid (PLA) held the largest market share around 32% in 2023. It is due to its versatile properties and wide range of application base. The outstanding transparency, biodegradability, and mechanical performance of PLA render it especially attractive in packaging, disposable products, and consumer-goods markets that largely are being transformed by sustainability trends. Development of cost-effective manufacturing processes. The manufacturing processes have improved to a great extent, and details of largest-scale production have decreased the PLA's production costs, making PLA-type polymers a less-expensive alternative to common plastics. Furthermore, the rising consumer inclination towards green materials along with the favorable regulatory scenario across the globe has fueled the growth of market. All these factors together make PLA the leader of bio-based polymers market.

By Application

Packaging held the largest market share around 28% in 2023.   It is owing to the converging forces of demand from end-users for sustainable products, regulatory pressures, and the properties of the material which fulfill the packaging need perfectly. Growing environmental consciousness among consumers as well as industries has diverted interest towards green, biodegradable alternatives to traditional single-use items and packaging for food which in turn has resulted in an increase in demand for bio-based polymers, including PLA. Ideal for packaging applications, they are easily processed into high transparent materials with minimal thickness, while being more durable and with a significantly lower carbon footprint than standard plastics. Additionally, strong regulations to minimize plastic waste and boost recycling have also catalyzed the transition to bio-based packaging.

Bio-Based Polymers Market Regional Analysis

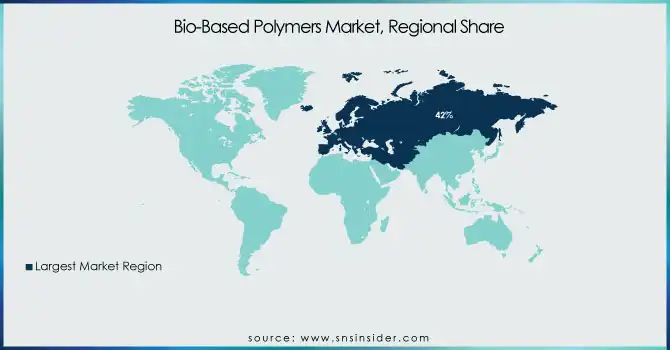
Europe held the largest market share around 42% in 2023. Due to its commitment towards sustainability and strict environmental regulations, Europe dominated the bio-based polymers market. Due to stringent regulations in the region along with increasing awareness among consumers regarding the ill-effects of the petrochemical-based plastics, the market for biodegradable plastics has witnessed significant deployment of materials (biodegradable plastics) such as PLA, PHA and starch-based biodegradables in the packaging sector. The R&D infrastructure is also quite strong in this regard and Government incentives have also fueled this journey of making new technologies and processes available at lower costs. At the same time, the mature recycling systems and high level of waste management in Europe ensure a circular economy, better enabling the bio-based polymers' lifetime cycle.

Asia-Pacific more had a majority share in the bio-based polymers market. Bamboo is being widely used for packaging and consumer goods in the region due to the rising consumer demand for sustainable products. In addition, you have policy support and incentives, and investments supported through policy as well as through incentives for advanced R&D and advanced production technologies that increase cost-competitiveness and scalability. Asia-Pacific has emerged as a key contributor to the global bio-based polymer production, especially due to a strong manufacturing base and steady improvements in feedstock conversion.

Bio-Based-Polymers-Market-Regional-Share

Get Customized Report as per Your Business Requirement - Enquiry Now

Key Players

  • BASF SE - Ecovio, Ultramid

  • NatureWorks LLC - Ingeo, Ingeo Biopolymer for 3D printing

  • Braskem - Green PE, I'm green EVA

  • Corbion NV - Luminy, PURASORB

  • TotalEnergies Corbion - Luminy PLA, High-heat PLA

  • Novamont S.p.A. - Mater-Bi, Origo-Bi

  • Arkema - Rilsan, Pebax Rnew

  • DuPont de Nemours, Inc. - Sorona, Biomax PTT

  • Mitsubishi Chemical Corporation - BioPBS, Durabio

  • Teijin Limited - Biofront, Ecodear

  • Danimer Scientific - Nodax, Rinnovo

  • Plantic Technologies Ltd. - Plantic, Eco Plastic

  • Futerro - PLA, Lactide

  • Biome Technologies plc - Biome Bioplastics, Biopol

  • Toray Industries, Inc. - Ecodear, PLA-based fibers

  • Evonik Industries AG - VESTAMID Terra, RESOMER

  • Rodenburg Biopolymers - Solanyl, Biopolymer compounds

  • FKuR Kunststoff GmbH - Bio-Flex, Terralene

  • Kaneka Corporation - PHBH, Green Planet

  • Bio-On S.p.A. - Minerv PHA, PHA-based bioplastics

Recent Development:

  • In 2023, BASF SE introduced a new grade of its Ecovio bioplastic, specifically designed for flexible packaging applications. This innovative material offers improved biodegradability, making it an eco-friendly solution for single-use packaging while maintaining high performance.

  • In 2023, NatureWorks LLC expanded its production capacity for Ingeo PLA (polylactic acid) biopolymers at its facility in Thailand. This expansion was aimed at addressing the growing global demand for sustainable materials in packaging, textiles, and 3D printing.

Bio-Based Polymers Market Report Scope:

Report Attributes Details
Market Size in 2023 USD 11.39  Billion
Market Size by 2032 USD 46.93   Billion
CAGR CAGR of 17.04%  From 2024 to 2032
Base Year 2023
Forecast Period 2024-2032
Historical Data 2020-2022
Report Scope & Coverage Market Size, Segments Analysis, Competitive  Landscape, Regional Analysis, DROC & SWOT Analysis, Forecast Outlook
Key Segments • By Type (Starch-based Plastics, Poly Lactic Acid (PLA), Polyesters (PBS, PBAT, PCL), PolyHydroxy Alkanoates (PHA), Polyesters (PBS, PBAT, PCL))
• By Application(Packaging, Textile, Automotive & Transportation, Electronics, Consumer Goods, Agriculture, Others)
Regional Analysis/Coverage North America (US, Canada, Mexico), Europe (Eastern Europe [Poland, Romania, Hungary, Turkey, Rest of Eastern Europe] Western Europe] Germany, France, UK, Italy, Spain, Netherlands, Switzerland, Austria, Rest of Western Europe]), Asia Pacific (China, India, Japan, South Korea, Vietnam, Singapore, Australia, Rest of Asia Pacific), Middle East & Africa (Middle East [UAE, Egypt, Saudi Arabia, Qatar, Rest of Middle East], Africa [Nigeria, South Africa, Rest of Africa], Latin America (Brazil, Argentina, Colombia, Rest of Latin America)
Company Profiles BASF SE, NatureWorks LLC, Braskem, Corbion NV, TotalEnergies Corbion, Novamont S.p.A., Arkema, DuPont de Nemours, Inc., Mitsubishi Chemical Corporation, Teijin Limited, Danimer Scientific, Plantic Technologies Ltd., Futerro, Biome Technologies plc, Toray Industries, Inc., Evonik Industries AG, Rodenburg Biopolymers, FKuR Kunststoff GmbH, Kaneka Corporation, Bio-On S.p.A.

Frequently Asked Questions

Ans: Europe led the Bio-Based Polymers Market in the region with the highest revenue share in 2023.

Ans:    Consumer Demand for Eco-Friendly Products, which drives the market growth.     

Ans: Poly Latic Acid (PLA) will grow rapidly in the Bio-Based Polymers Market from 2024-2032.

Ans: The expected CAGR of the global Bio-Based Polymers Market during the forecast period is 17.04%.

Ans: The Bio-Based Polymers Market was valued at USD 11.39 Billion in 2023.

Table of Contents:

1. Introduction

1.1 Market Definition

1.2 Scope (Inclusion and Exclusions)

1.3 Research Assumptions

2. Executive Summary

2.1 Market Overview       

2.2 Regional Synopsis

2.3 Competitive Summary

3. Research Methodology

3.1 Top-Down Approach

3.2 Bottom-up Approach

3.3. Data Validation

3.4 Primary Interviews

4. Market Dynamics Impact Analysis

3.1 Market Driving Factors Analysis

3.1.2 Drivers

3.1.2 Restraints

3.1.3 Opportunities

3.1.4 Challenges

3.2 PESTLE Analysis

3.3 Porter’s Five Forces Model

5. Statistical Insights and Trends Reporting

5.1 Production Capacity and Utilization, by Country, By Type, 2023

5.2 Feedstock Prices, by Country, By Type, 2023

5.3   Regulatory Impact, by Country, By Type 2023.

5.4 Environmental Metrics: Emissions Data, Waste Management Practices, and     Sustainability Initiatives, by Region

5.5 Innovation and R&D, Type, 2023

6. Competitive Landscape

6.1 List of Major Companies, By Region

6.2 Market Share Analysis, By Region

6.3 Product Benchmarking

6.3.1 Product specifications and features

6.3.2 Pricing

6.4 Strategic Initiatives

6.4.1 Marketing and promotional activities

6.4.2 Distribution and Supply Chain Strategies

6.4.3 Expansion Plans and New Product Launches

6.4.4 Strategic partnerships and collaborations

6.5 Technological Advancements

6.6 Market Positioning and Branding

7. Bio-Based Polymers Market Segmentation, By Type

7.1 Chapter Overview

7.2 Starch-based Plastics

        7.2.1 Starch-based Plastics Trends Analysis (2020-2032)

7.2.2 Starch-based Plastics Market Size Estimates and Forecasts to 2032 (USD Billion)

7.3 Poly Latic Acid (PLA)

       7.3.1 Poly Latic Acid (PLA) Market Trends Analysis (2020-2032)

       7.3.2 Poly Latic Acid (PLA) Market Size Estimates and Forecasts to 2032 (USD Billion)

7.4 Polyesters (PBS, PBAT, and PCL)

        7.4.1 Polyesters (PBS, PBAT, and PCL) Trends Analysis (2020-2032)

7.4.2 Polyesters (PBS, PBAT, and PCL) Market Size Estimates and Forecasts to 2032 (USD Billion)

7.5 PolyHydroxy Alkanoates (PHA)

       7.5.1 PolyHydroxy Alkanoates (PHA)Market Trends Analysis (2020-2032)

       7.5.2 PolyHydroxy Alkanoates (PHA) Market Size Estimates and Forecasts to 2032 (USD Billion)

7.6 Polyesters (PBS, PBAT, and PCL)

        7.6.1 Polyesters (PBS, PBAT, and PCL) Trends Analysis (2020-2032)

7.6.2 Polyesters (PBS, PBAT, and PCL) Market Size Estimates and Forecasts to 2032 (USD Billion)

8. Bio-Based Polymers Market Segmentation, by Application

8.1 Chapter Overview

8.2 Packaging

        8.2.1 Packaging Market Trends Analysis (2020-2032)

8.2.2 Packaging Market Size Estimates and Forecasts to 2032 (USD Billion)

8.3 Textile

      8.3.1 Textile Market Trends Analysis (2020-2032)

      8.3.2 Textile Market Size Estimates and Forecasts to 2032 (USD Billion)

8.4 Automotive & Transportation

        8.4.1 Automotive & Transportation Market Trends Analysis (2020-2032)

8.4.2 Automotive & Transportation Market Size Estimates and Forecasts to 2032 (USD Billion)

8.5 Electronics

        8.5.1 Electronics Market Trends Analysis (2020-2032)

8.5.2 Electronics Market Size Estimates and Forecasts to 2032 (USD Billion)

8.6 Consumer Goods

        8.6.1 Consumer Goods Market Trends Analysis (2020-2032)

8.6.2 Consumer Goods Market Size Estimates and Forecasts to 2032 (USD Billion)

8.7 Agriculture

        8.7.1 Agriculture Market Trends Analysis (2020-2032)

8.7.2 Agriculture Market Size Estimates and Forecasts to 2032 (USD Billion)

8.8 Others

        8.8.1 Others Market Trends Analysis (2020-2032)

8.8.2 Others Market Size Estimates and Forecasts to 2032 (USD Billion)

9. Regional Analysis

9.1 Chapter Overview

9.2 North America

9.2.1 Trends Analysis

9.2.2 North America Bio-Based Polymers Market Estimates and Forecasts, by Country (2020-2032) (USD Billion)

9.2.3 North America Bio-Based Polymers Market Estimates and Forecasts, By Type (2020-2032) (USD Billion) 

9.2.4 North America Bio-Based Polymers Market Estimates and Forecasts, by Application (2020-2032) (USD Billion)

9.2.5 USA

9.2.5.1 USA Bio-Based Polymers Market Estimates and Forecasts, By Type (2020-2032) (USD Billion)

9.2.5.2 USA Bio-Based Polymers Market Estimates and Forecasts, by Application (2020-2032) (USD Billion)

9.2.6 Canada

9.2.6.1 Canada Bio-Based Polymers Market Estimates and Forecasts, By Type (2020-2032) (USD Billion)

9.2.6.2 Canada Bio-Based Polymers Market Estimates and Forecasts, by Application (2020-2032) (USD Billion)

9.2.7 Mexico

9.2.7.1 Mexico Bio-Based Polymers Market Estimates and Forecasts, By Type (2020-2032) (USD Billion)

9.2.7.2 Mexico Bio-Based Polymers Market Estimates and Forecasts, by Application (2020-2032) (USD Billion)

9.3 Europe

9.3.1 Eastern Europe

9.3.1.1 Trends Analysis

9.3.1.2 Eastern Europe Bio-Based Polymers Market Estimates and Forecasts, by Country (2020-2032) (USD Billion)

9.3.1.3 Eastern Europe Bio-Based Polymers Market Estimates and Forecasts, By Type (2020-2032) (USD Billion) 

9.3.1.4 Eastern Europe Bio-Based Polymers Market Estimates and Forecasts, by Application (2020-2032) (USD Billion)

9.3.1.5 Poland

9.3.1.5.1 Poland Bio-Based Polymers Market Estimates and Forecasts, By Type (2020-2032) (USD Billion)

9.3.1.5.2 Poland Bio-Based Polymers Market Estimates and Forecasts, by Application (2020-2032) (USD Billion)

9.3.1.6 Romania

9.3.1.6.1 Romania Bio-Based Polymers Market Estimates and Forecasts, By Type (2020-2032) (USD Billion)

9.3.1.6.2 Romania Bio-Based Polymers Market Estimates and Forecasts, by Application (2020-2032) (USD Billion)

9.3.1.7 Hungary

9.3.1.7.1 Hungary Bio-Based Polymers Market Estimates and Forecasts, By Type (2020-2032) (USD Billion)

9.3.1.7.2 Hungary Bio-Based Polymers Market Estimates and Forecasts, by Application (2020-2032) (USD Billion)

9.3.1.8 Turkey

9.3.1.8.1 Turkey Bio-Based Polymers Market Estimates and Forecasts, By Type (2020-2032) (USD Billion)

9.3.1.8.2 Turkey Bio-Based Polymers Market Estimates and Forecasts, by Application (2020-2032) (USD Billion)

9.3.1.9 Rest of Eastern Europe

9.3.1.9.1 Rest of Eastern Europe Bio-Based Polymers Market Estimates and Forecasts, By Type (2020-2032) (USD Billion)

9.3.1.9.2 Rest of Eastern Europe Bio-Based Polymers Market Estimates and Forecasts, by Application (2020-2032) (USD Billion)

9.3.2 Western Europe

9.3.2.1 Trends Analysis

9.3.2.2 Western Europe Bio-Based Polymers Market Estimates and Forecasts, by Country (2020-2032) (USD Billion)

9.3.2.3 Western Europe Bio-Based Polymers Market Estimates and Forecasts, By Type (2020-2032) (USD Billion) 

9.3.2.4 Western Europe Bio-Based Polymers Market Estimates and Forecasts, by Application (2020-2032) (USD Billion)

9.3.2.5 Germany

9.3.2.5.1 Germany Bio-Based Polymers Market Estimates and Forecasts, By Type (2020-2032) (USD Billion)

9.3.2.5.2 Germany Bio-Based Polymers Market Estimates and Forecasts, by Application (2020-2032) (USD Billion)

9.3.2.6 France

9.3.2.6.1 France Bio-Based Polymers Market Estimates and Forecasts, By Type (2020-2032) (USD Billion)

9.3.2.6.2 France Bio-Based Polymers Market Estimates and Forecasts, by Application (2020-2032) (USD Billion)

9.3.2.7 UK

9.3.2.7.1 UK Bio-Based Polymers Market Estimates and Forecasts, By Type (2020-2032) (USD Billion)

9.3.2.7.2 UK Bio-Based Polymers Market Estimates and Forecasts, by Application (2020-2032) (USD Billion)

9.3.2.8 Italy

9.3.2.8.1 Italy Bio-Based Polymers Market Estimates and Forecasts, By Type (2020-2032) (USD Billion)

9.3.2.8.2 Italy Bio-Based Polymers Market Estimates and Forecasts, by Application (2020-2032) (USD Billion)

9.3.2.9 Spain

9.3.2.9.1 Spain Bio-Based Polymers Market Estimates and Forecasts, By Type (2020-2032) (USD Billion)

9.3.2.9.2 Spain Bio-Based Polymers Market Estimates and Forecasts, by Application (2020-2032) (USD Billion)

9.3.2.10 Netherlands

9.3.2.10.1 Netherlands Bio-Based Polymers Market Estimates and Forecasts, By Type (2020-2032) (USD Billion)

9.3.2.10.2 Netherlands Bio-Based Polymers Market Estimates and Forecasts, by Application (2020-2032) (USD Billion)

9.3.2.11 Switzerland

9.3.2.11.1 Switzerland Bio-Based Polymers Market Estimates and Forecasts, By Type (2020-2032) (USD Billion)

9.3.2.11.2 Switzerland Bio-Based Polymers Market Estimates and Forecasts, by Application (2020-2032) (USD Billion)

9.3.2.12 Austria

9.3.2.12.1 Austria Bio-Based Polymers Market Estimates and Forecasts, By Type (2020-2032) (USD Billion)

9.3.2.12.2 Austria Bio-Based Polymers Market Estimates and Forecasts, by Application (2020-2032) (USD Billion)

9.3.2.13 Rest of Western Europe

9.3.2.13.1 Rest of Western Europe Bio-Based Polymers Market Estimates and Forecasts, By Type (2020-2032) (USD Billion)

9.3.2.13.2 Rest of Western Europe Bio-Based Polymers Market Estimates and Forecasts, by Application (2020-2032) (USD Billion)

9.4 Asia Pacific

9.4.1 Trends Analysis

9.4.2 Asia Pacific Bio-Based Polymers Market Estimates and Forecasts, by Country (2020-2032) (USD Billion)

9.4.3 Asia Pacific Bio-Based Polymers Market Estimates and Forecasts, By Type (2020-2032) (USD Billion) 

9.4.4 Asia Pacific Bio-Based Polymers Market Estimates and Forecasts, by Application (2020-2032) (USD Billion)

9.4.5 China

9.4.5.1 China Bio-Based Polymers Market Estimates and Forecasts, By Type (2020-2032) (USD Billion)

9.4.5.2 China Bio-Based Polymers Market Estimates and Forecasts, by Application (2020-2032) (USD Billion)

9.4.6 India

9.4.5.1 India Bio-Based Polymers Market Estimates and Forecasts, By Type (2020-2032) (USD Billion)

9.4.5.2 India Bio-Based Polymers Market Estimates and Forecasts, by Application (2020-2032) (USD Billion)

9.4.5 Japan

9.4.5.1 Japan Bio-Based Polymers Market Estimates and Forecasts, By Type (2020-2032) (USD Billion)

9.4.5.2 Japan Bio-Based Polymers Market Estimates and Forecasts, by Application (2020-2032) (USD Billion)

9.4.6 South Korea

9.4.6.1 South Korea Bio-Based Polymers Market Estimates and Forecasts, By Type (2020-2032) (USD Billion)

9.4.6.2 South Korea Bio-Based Polymers Market Estimates and Forecasts, by Application (2020-2032) (USD Billion)

9.4.7 Vietnam

9.4.7.1 Vietnam Bio-Based Polymers Market Estimates and Forecasts, By Type (2020-2032) (USD Billion)

9.2.7.2 Vietnam Bio-Based Polymers Market Estimates and Forecasts, by Application (2020-2032) (USD Billion)

9.4.8 Singapore

9.4.8.1 Singapore Bio-Based Polymers Market Estimates and Forecasts, By Type (2020-2032) (USD Billion)

9.4.8.2 Singapore Bio-Based Polymers Market Estimates and Forecasts, by Application (2020-2032) (USD Billion)

9.4.9 Australia

9.4.9.1 Australia Bio-Based Polymers Market Estimates and Forecasts, By Type (2020-2032) (USD Billion)

9.4.9.2 Australia Bio-Based Polymers Market Estimates and Forecasts, by Application (2020-2032) (USD Billion)

9.4.10 Rest of Asia Pacific

9.4.10.1 Rest of Asia Pacific Bio-Based Polymers Market Estimates and Forecasts, By Type (2020-2032) (USD Billion)

9.4.10.2 Rest of Asia Pacific Bio-Based Polymers Market Estimates and Forecasts, by Application (2020-2032) (USD Billion)

9.5 Middle East and Africa

9.5.1 Middle East

9.5.1.1 Trends Analysis

9.5.1.2 Middle East Bio-Based Polymers Market Estimates and Forecasts, by Country (2020-2032) (USD Billion)

9.5.1.3 Middle East Bio-Based Polymers Market Estimates and Forecasts, By Type (2020-2032) (USD Billion) 

9.5.1.4 Middle East Bio-Based Polymers Market Estimates and Forecasts, by Application (2020-2032) (USD Billion)

9.5.1.5 UAE

9.5.1.5.1 UAE Bio-Based Polymers Market Estimates and Forecasts, By Type (2020-2032) (USD Billion)

9.5.1.5.2 UAE Bio-Based Polymers Market Estimates and Forecasts, by Application (2020-2032) (USD Billion)

9.5.1.6 Egypt

9.5.1.6.1 Egypt Bio-Based Polymers Market Estimates and Forecasts, By Type (2020-2032) (USD Billion)

9.5.1.6.2 Egypt Bio-Based Polymers Market Estimates and Forecasts, by Application (2020-2032) (USD Billion)

9.5.1.7 Saudi Arabia

9.5.1.7.1 Saudi Arabia Bio-Based Polymers Market Estimates and Forecasts, By Type (2020-2032) (USD Billion)

9.5.1.7.2 Saudi Arabia Bio-Based Polymers Market Estimates and Forecasts, by Application (2020-2032) (USD Billion)

9.5.1.8 Qatar

9.5.1.8.1 Qatar Bio-Based Polymers Market Estimates and Forecasts, By Type (2020-2032) (USD Billion)

9.5.1.8.2 Qatar Bio-Based Polymers Market Estimates and Forecasts, by Application (2020-2032) (USD Billion)

9.5.1.9 Rest of Middle East

9.5.1.9.1 Rest of Middle East Bio-Based Polymers Market Estimates and Forecasts, By Type (2020-2032) (USD Billion)

9.5.1.9.2 Rest of Middle East Bio-Based Polymers Market Estimates and Forecasts, by Application (2020-2032) (USD Billion)

9.5.2 Africa

9.5.2.1 Trends Analysis

9.5.2.2 Africa Bio-Based Polymers Market Estimates and Forecasts, by Country (2020-2032) (USD Billion)

9.5.2.3 Africa Bio-Based Polymers Market Estimates and Forecasts, By Type (2020-2032) (USD Billion) 

9.5.2.4 Africa Bio-Based Polymers Market Estimates and Forecasts, by Application (2020-2032) (USD Billion)

9.5.2.5 South Africa

9.5.2.5.1 South Africa Bio-Based Polymers Market Estimates and Forecasts, By Type (2020-2032) (USD Billion)

9.5.2.5.2 South Africa Bio-Based Polymers Market Estimates and Forecasts, by Application (2020-2032) (USD Billion)

9.5.2.6 Nigeria

9.5.2.6.1 Nigeria Bio-Based Polymers Market Estimates and Forecasts, By Type (2020-2032) (USD Billion)

9.5.2.6.2 Nigeria Bio-Based Polymers Market Estimates and Forecasts, by Application (2020-2032) (USD Billion)

9.6 Latin America

9.6.1 Trends Analysis

9.6.2 Latin America Bio-Based Polymers Market Estimates and Forecasts, by Country (2020-2032) (USD Billion)

9.6.3 Latin America Bio-Based Polymers Market Estimates and Forecasts, By Type (2020-2032) (USD Billion) 

9.6.4 Latin America Bio-Based Polymers Market Estimates and Forecasts, by Application (2020-2032) (USD Billion)

9.6.5 Brazil

9.6.5.1 Brazil Bio-Based Polymers Market Estimates and Forecasts, By Type (2020-2032) (USD Billion)

9.6.5.2 Brazil Bio-Based Polymers Market Estimates and Forecasts, by Application (2020-2032) (USD Billion)

9.6.6 Argentina

9.6.6.1 Argentina Bio-Based Polymers Market Estimates and Forecasts, By Type (2020-2032) (USD Billion)

9.6.6.2 Argentina Bio-Based Polymers Market Estimates and Forecasts, by Application (2020-2032) (USD Billion)

9.6.7 Colombia

9.6.7.1 Colombia Bio-Based Polymers Market Estimates and Forecasts, By Type (2020-2032) (USD Billion)

9.6.7.2 Colombia Bio-Based Polymers Market Estimates and Forecasts, by Application (2020-2032) (USD Billion)

9.6.8 Rest of Latin America

9.6.8.1 Rest of Latin America Bio-Based Polymers Market Estimates and Forecasts, By Type (2020-2032) (USD Billion)

9.6.8.2 Rest of Latin America Bio-Based Polymers Market Estimates and Forecasts, by Application (2020-2032) (USD Billion)

10. Company Profiles

           10.1      BASF SE

                          10.1.1 Company Overview

10.1.2 Financial

10.1.3 Product / Services Offered

10.1.4 SWOT Analysis

           10.2      NatureWorks LLC

                           10.2.1 Company Overview

10.2.2 Financial

10.2.3 Product/ Services Offered

10.2.4 SWOT Analysis

10.3 Braskem

              10.3.1 Company Overview

10.3.2 Financial

10.3.3 Product/ Services Offered

10.3.4 SWOT Analysis

10.4 Corbion NV

             10.4.1 Company Overview

10.4.2 Financial

10.4.3 Product/ Services Offered

10.4.4 SWOT Analysis

10.5 TotalEnergies Corbion

             10.5.1 Company Overview

10.5.2 Financial

10.5.3 Product/ Services Offered

10.5.4 SWOT Analysis

10.6 Novamont S.p.A.

             10.6.1 Company Overview

10.6.2 Financial

10.6.3 Product/ Services Offered

10.6.4 SWOT Analysis

10.7 Arkema

             10.7.1 Company Overview

10.7.2 Financial

10.7.3 Product/ Services Offered

10.7.4 SWOT Analysis

10.8 DuPont de Nemours, Inc.

             10.8.1 Company Overview

10.8.2 Financial

10.8.3 Product/ Services Offered

10.8.4 SWOT Analysis

10.9 Mitsubishi Chemical Corporation

             10.9.1 Company Overview

10.9.2 Financial

10.9.3 Product/ Services Offered

10.9.4 SWOT Analysis

10.10 Teijin Limited

             10.10.1 Company Overview

10.10.2 Financial

10.10.3 Product/ Services Offered

10.10.4 SWOT Analysis

11. Use Cases and Best Practices

12. Conclusion

An accurate research report requires proper strategizing as well as implementation. There are multiple factors involved in the completion of good and accurate research report and selecting the best methodology to compete the research is the toughest part. Since the research reports we provide play a crucial role in any company’s decision-making process, therefore we at SNS Insider always believe that we should choose the best method which gives us results closer to reality. This allows us to reach at a stage wherein we can provide our clients best and accurate investment to output ratio.

Each report that we prepare takes a timeframe of 350-400 business hours for production. Starting from the selection of titles through a couple of in-depth brain storming session to the final QC process before uploading our titles on our website we dedicate around 350 working hours. The titles are selected based on their current market cap and the foreseen CAGR and growth.


The 5 steps process:

Step 1: Secondary Research:

Secondary Research or Desk Research is as the name suggests is a research process wherein, we collect data through the readily available information. In this process we use various paid and unpaid databases which our team has access to and gather data through the same. This includes examining of listed companies’ annual reports, Journals, SEC filling etc. Apart from this our team has access to various associations across the globe across different industries. Lastly, we have exchange relationships with various university as well as individual libraries.

Secondary Research

Step 2: Primary Research

When we talk about primary research, it is a type of study in which the researchers collect relevant data samples directly, rather than relying on previously collected data.  This type of research is focused on gaining content specific facts that can be sued to solve specific problems. Since the collected data is fresh and first hand therefore it makes the study more accurate and genuine.

We at SNS Insider have divided Primary Research into 2 parts.

Part 1 wherein we interview the KOLs of major players as well as the upcoming ones across various geographic regions. This allows us to have their view over the market scenario and acts as an important tool to come closer to the accurate market numbers. As many as 45 paid and unpaid primary interviews are taken from both the demand and supply side of the industry to make sure we land at an accurate judgement and analysis of the market.

This step involves the triangulation of data wherein our team analyses the interview transcripts, online survey responses and observation of on filed participants. The below mentioned chart should give a better understanding of the part 1 of the primary interview.

Primary Research

Part 2: In this part of primary research the data collected via secondary research and the part 1 of the primary research is validated with the interviews from individual consultants and subject matter experts.

Consultants are those set of people who have at least 12 years of experience and expertise within the industry whereas Subject Matter Experts are those with at least 15 years of experience behind their back within the same space. The data with the help of two main processes i.e., FGDs (Focused Group Discussions) and IDs (Individual Discussions). This gives us a 3rd party nonbiased primary view of the market scenario making it a more dependable one while collation of the data pointers.

Step 3: Data Bank Validation

Once all the information is collected via primary and secondary sources, we run that information for data validation. At our intelligence centre our research heads track a lot of information related to the market which includes the quarterly reports, the daily stock prices, and other relevant information. Our data bank server gets updated every fortnight and that is how the information which we collected using our primary and secondary information is revalidated in real time.

Data Bank Validation

Step 4: QA/QC Process

After all the data collection and validation our team does a final level of quality check and quality assurance to get rid of any unwanted or undesired mistakes. This might include but not limited to getting rid of the any typos, duplication of numbers or missing of any important information. The people involved in this process include technical content writers, research heads and graphics people. Once this process is completed the title gets uploader on our platform for our clients to read it.

Step 5: Final QC/QA Process:

This is the last process and comes when the client has ordered the study. In this process a final QA/QC is done before the study is emailed to the client. Since we believe in giving our clients a good experience of our research studies, therefore, to make sure that we do not lack at our end in any way humanly possible we do a final round of quality check and then dispatch the study to the client.

Key Segments:

By Type

  • Starch-based Plastics

  • Poly Latic Acid (PLA)

  • Polyesters (PBS, PBAT, and PCL)

  • PolyHydroxy Alkanoates (PHA)

  • Polyesters (PBS, PBAT, and PCL)

By Application

  • Packaging

  • Textile

  • Automotive & Transportation

  • Electronics

  • Consumer Goods

  • Agriculture

  • Others

Request for Segment Customization as per your Business Requirement: Segment Customization Request

Regional Coverage:

North America

  • US

  • Canada

  • Mexico

Europe

  • Eastern Europe

    • Poland

    • Romania

    • Hungary

    • Turkey

    • Rest of Eastern Europe

  • Western Europe

    • Germany

    • France

    • UK

    • Italy

    • Spain

    • Netherlands

    • Switzerland

    • Austria

    • Rest of Western Europe

Asia Pacific

  • China

  • India

  • Japan

  • South Korea

  • Vietnam

  • Singapore

  • Australia

  • Rest of Asia Pacific

Middle East & Africa

  • Middle East

    • UAE

    • Egypt

    • Saudi Arabia

    • Qatar

    • Rest of Middle East

  • Africa

    • Nigeria

    • South Africa

    • Rest of Africa

  • Latin America

  • Brazil

  • Argentina

  • Colombia

  • Rest of Latin America

Request for Country Level Research Report: Country Level Customization Request

Available Customization

With the given market data, SNS Insider offers customization as per the company’s specific needs. The following customization options are available for the report:

  • Product Analysis

  • Criss-Cross segment analysis (e.g. Product X Application)

  • Product Matrix which gives a detailed comparison of the product portfolio of each company

  • Geographic Analysis

  • Additional countries in any of the regions

  • Company Information

  • Detailed analysis and profiling of additional market players (Up to five)


  •            5000 (33% Discount)


  •            8950 (40% Discount)


  •            3050 (23% Discount)

Start a Conversation

Hi! Click one of our member below to chat on Phone