Get More Information on Beverage Packaging Market - Request Sample Report
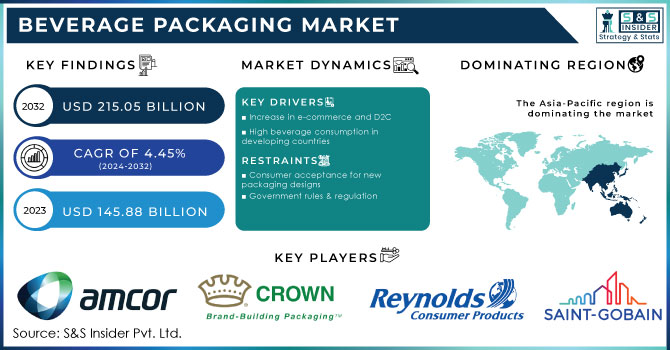
The Beverage Packaging Market Size was valued USD 144.23 billion in 2023, is anticipated to reach USD 226.64 billion by 2032, growing at a CAGR of 5.16% during the forecast period.
The demand for various types of beverages, including carbonated drinks, sports drinks, and fruit juices, has fueled the beverage packaging market. The higher demand for these beverages boosts the need for packaging materials in various sizes and types. Packaging is not just essential to protect the product but also influences consumer choices. Innovative packaging solutions are being used more and more to attract customers, which impacts sales and market growth directly.
Increasing demand for functional and healthy beverages is a major driver in the beverage packaging market. The trend of low-calorie, low-sugar, and fortified beverages demands that the packaging preserve the nutritional integrity of the product. For instance, Energy drinks are at the top with 32% of total sales, accounting for 16 billion dollars, Sports drinks earn 12.2 billion dollars, Sports protein RTDs and meal replacements have 12.8% of sales worth 6.4 billion dollars. Functional RTD coffees and teas (1.8 billion dollars), carbonates (1.7 billion), and yogurt beverages earn 1.2 billion dollars indicating the trend toward healthier choice beverages. Beverages enriched with vitamins, minerals, and probiotics require packaging that can provide superior barrier properties against oxidation, moisture absorption, and light exposure, which degrade the product. This demand has generated the development of packaging technologies that guarantee freshness and extend shelf life.
Another factor that comes into play is the ease of use. Consumers are finding their lives busier; thus, the demand for single-serve, ready-to-go packaging has also increased. Cans, pouches, and bottles that are smaller, portable, and easy to dispose of become more popular. This trend continues to drive innovation in beverage packaging to be lightweight yet sustainable, such as with recyclable PET, paper-based cartons, and aluminum. Apart from this, the emerging requirement of eco-friendly and earth-sensitive consumers is pushing back manufacturers to opt for alternatives like sustainable packaging solutions in materials that reduce environmental effects.
Technological Innovations Driving Sustainability in Beverage Packaging Market
Technological advances, such as smart packaging and the use of lightweight materials, have become major drivers for growth in the beverage packaging market. These technologies improve the functionality of packaging by enabling freshness monitoring, better consumer interaction, and optimization of supply chains. Integrating features related to smart packaging such as sensors or QR codes gives better rapport with consumers.
Building on top of these technological advancements, sustainability-focused innovations are increasingly forming the beverage packaging market. For example, brands like Wise Wolf by Banrock Station used advanced material science to inject sustainability into the design. Their use of 91% recycled glass bottles, use of sugarcane-based labels, and lightweight, recycled aluminum caps showcase how technology may drive eco-friendly solutions but not at the cost of quality or functionality. For example, features such as QR codes on packaging provide a clearer view of the environmental characteristics of the product. The innovation reduces cost and negative impact on the environment; however, it further fortifies consumer trust and unlocks other avenues for expansion.
Increased Demand for Single-Serve and Convenience Packaging driving the Beverage Packaging Market
Restrains:
Fluctuations in Raw Material Prices Impacting the Beverage Packaging Market
Fluctuations in raw material prices are impacting the beverage packaging market. The prices of key materials like plastic, aluminum, and paperboard are highly volatile and influenced by factors such as raw material availability, production costs, and global supply chain challenges. For example, the price of plastic is highly influenced by the fluctuation in oil prices since plastic is a petroleum-based product. The U.S. Producer Price Index (PPI) graph for plastic material and resin manufacturing shows a high level of increase. In September 2024, the PPI increased by 4.21% from the previous month and 2.25% over the year, which is indicative of the rising production cost of the plastics industry due to causes such as disruptions in the supply chain, higher energy prices, and greater demand for plastic materials. Such cost increase in production is going to shift packaging costs upwards, mainly within those industries reliant on plastic materials.
Similarly, an increase in the energy or mining cost raises aluminum prices whereas paperboard prices are quite sensitive to wood pulp increase and demand for recycled materials; these price changes can have a piling effect on beverage packaging prices. When these material prices tend to rise, the production cost that packaging manufacturers have to endure may lead to a price increase imposed on the end consumer. For instance, when energy prices increase, aluminum demand tends to be higher; therefore, the cost of aluminum packaging goes up significantly, impacting manufacturing processes in beverage and canned food production. This is an essential factor in the beverage packaging market, where cost fluctuations tend to impact manufacturers' bottom lines and consumer prices alike.
Supply Chain Disruptions Impacting the Beverage Packaging Market
By Material:
In 2023, the Glass segment dominated the market and accounted for more than 40% of the total market share because of its premium appeal, preservation qualities, and recyclability. It is preferred enormously in the alcoholic beverage, soft drink, and premium juice markets due to its non-reactive nature, which helps preserve the flavor, taste, and integrity of the beverages. It is also entirely recyclable, making it environmentally friendly in light of the ever-increasing consumer and regulatory focus on sustainability. This has ensured glass remains the material of choice for premium products and eco-conscious brands. Further, the governments of the world are now encouraging the use of sustainable materials such as glass, which helps this material continue to maintain a leading position in beverage packaging.
In contrast, plastic packaging appears to exhibit a higher rate of growth (CAGR) due to its lightweight, easy-to-mass-manufactured, and cost-effective nature. Plastic bottles are mostly used for soft drinks and juices or bottled water, as demand for "on the go" beverage use increases. Its increasing adoption is supported further by innovative recyclable material in plastic and efforts focused on lowering the environmental degradation of plastics.
By Product Type:
In 2023, the Bottles segment dominated the market and accounted for 57% of the total market share due to its multifunctionality, robustness, and suitability for different types of drinks, such as water, soft drinks, alcoholic beverages, and dairy products. The bottles offer a greater advantage in terms of mobility, recyclability, and re-closure, while they provide an excellent ground for designing and branding to maximize appeal for consumer convenience and marketing campaigns. In addition, regulations related to recyclable and reusable bottles in several countries have increased demand. For example, glass bottles are widely accepted for their premium appeal and recyclability, but plastic bottles meet the demand for lightweight, on-the-go packaging.
Cartons are growing more rapidly in terms of CAGR as it has an environmentally friendly appeal. Cartons, which essentially consist of renewable materials like paperboard, cater to these eco-conscious consumers and increasingly gain ground in markets driven by sustainability.
By Application:
In 2023, the Alcoholic beverages segment dominated the market and accounted for 47% of the total market share. The alcoholic beverages segment has led the beverage packaging market through several factors, including increased demand for premium alcoholic products, and increased consumption in emerging markets such as China and India. Moreover, the demand for sophisticated solutions such as glass for wine and beer has increased, but sustainability trends are pushing consumers toward more eco-friendly options. Innovations in this category include customized packaging, tailored to consumers' preferences for craft beers and premium liquors.
On the other hand, the non-alcoholic beverages segment is growing with a higher CAGR. The factors driving growth in this area include a shift by consumers toward healthier, low-calorie options, as well as ready-to-drink product growth. In non-alcoholic beverages, demand for sustainable and functional packaging is also on the rise.
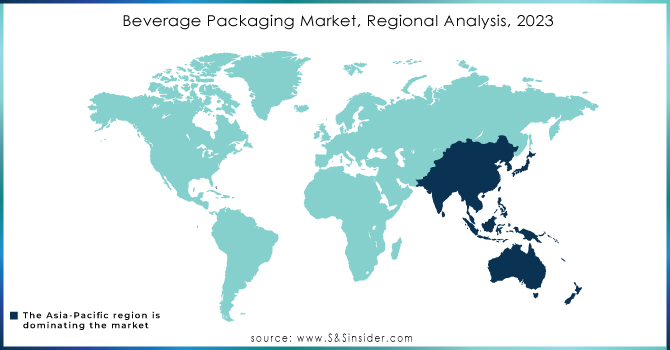
In 2023, the Asia Pacific region dominated the market and accounted for 40% of the total market share. The region is rapidly industrializing, and urbanization is on the rise along with a growing middle class that has higher disposable incomes. These factors drive the demand for alcoholic and non-alcoholic beverages, further increasing the demand for beverage packaging solutions. Asia Pacific is another large market for packaging manufacturers since its production is cost-effective, and innovation is very impressive, hence the region remains dominant in the beverage packaging market.
North America is the fastest-growing region for the beverage packaging market, where growth is high due to an increasing focus on sustainable packaging solutions with more investments in technological enhancement. Strong growth has also been experienced in the US and Canada regarding the consumption of non-alcoholic beverages- carbonated beverages and more health-conscious beverages that need packaging innovation. More and more people switching to sustainable as well as environment-friendly type of packaging material also facilitates the market's beverage packaging market growth.
Get Customised Report as per Your Business Requirement - Enquiry Now
Bemis Company, Inc.
Sonoco Products Company
Scholle IPN
Mondi
Amcor plc
Reynolds Group Ltd.
Crown
Stora Enso
Tetra Laval International S.A.
Ball Corporation
WestRock Company
Graham Packaging
Pulpoloco Sangrias
Berry Global Inc.
Amber Packaging
RPC Group
Saint-Gobain S.A.
Ardagh Group S.A.
Gunna Drinks
Tetra Laval International
Gunna Drinks: In July 2023, Gunna Drinks unveiled aluminum soda bottles as part of its initiative to reduce plastic usage. The step is expected to eliminate over 1.2 million plastic bottles annually, as part of the company's efforts to go green. The new aluminum bottles are fully recyclable and provide a more environmentally friendly alternative to traditional plastic packaging, as consumers increasingly demand greener packaging solutions.
Pulpoloco Sangrias: In April 2024, Pulpoloco Sangrias introduced the new CartoCan packaging. CartoCan package is an innovative 250-mL aseptic paper can, cutting material usage by 30% compared to traditional cans in aluminum or PET. It is composed of 60% Forest Stewardship Council-certified paper, and it is intended to reduce CO2 emissions by 20-60% compared to alternative packaging. It has a preservative-free 12-month shelf life and is a fully recyclable product for consumers who care much about going green. To date, this type of eco-friendly packaging will give in to the growing demand by consumers regarding sustainable products available in the beverage industry.
Report Attributes |
Details |
Market Size in 2023 |
US$ 144.23 Billion |
Market Size by 2032 |
US$ 226.64 Billion |
CAGR |
CAGR of 5.16% From 2024 to 2032 |
Base Year |
2023 |
Forecast Period |
2024-2032 |
Historical Data |
2020-2022 |
Report Scope & Coverage |
Market Size, Segments Analysis, Competitive Landscape, Regional Analysis, DROC & SWOT Analysis, Forecast Outlook |
Key Segments |
• By Raw Material (Plastic, Metal, Glass, Paper & Paperboard) |
Regional Analysis/Coverage |
North America (US, Canada, Mexico), Europe (Eastern Europe [Poland, Romania, Hungary, Turkey, Rest of Eastern Europe] Western Europe [Germany, France, UK, Italy, Spain, Netherlands, Switzerland, Austria, Rest of Western Europe]), Asia Pacific (China, India, Japan, South Korea, Vietnam, Singapore, Australia, Rest of Asia Pacific), Middle East & Africa (Middle East [UAE, Egypt, Saudi Arabia, Qatar, Rest of Middle East], Africa [Nigeria, South Africa, Rest of Africa], Latin America (Brazil, Argentina, Colombia, Rest of Latin America) |
Company Profiles |
Saint-Gobain S.A, Reynolds Group Holdings Limited, Crown Holdings Inc, Ball Corporation, Orora Packaging Australia Pty Ltd, Berry Global Inc, Intrapac International Corporation, Amcor Limited, Owens-Illinois Inc, BA Glass Germany GmbH, and other players |
Key Drivers |
• Increase in e-commerce and D2C |
Market Opportunities |
• Market Expansion in emerging economies. |
Ans: Beverage Packaging Market is expected to grow at a CAGR of 4.45% over the forecast period of 2024-2032.
Ans- The bottles segment dominated the Beverage Packaging market in 2023.
Ans- The Beverage Packaging Market size was valued at USD 144.23 Billion in 2023.
Ans- North America is the fastest-growing region in the Beverage Packaging Market.
Ans- Alcoholic Beverage had the largest market share in the Beverage Packaging Market.
1. Introduction
1.1 Market Definition
1.2 Scope (Inclusion and Exclusions)
1.3 Research Assumptions
2. Executive Summary
2.1 Market Overview
2.2 Regional Synopsis
2.3 Competitive Summary
3. Research Methodology
3.1 Top-Down Approach
3.2 Bottom-up Approach
3.3. Data Validation
3.4 Primary Interviews
4. Market Dynamics Impact Analysis
4.1 Market Driving Factors Analysis
4.1.1 Drivers
4.1.2 Restraints
4.1.3 Opportunities
4.1.4 Challenges
4.2 PESTLE Analysis
4.3 Porter’s Five Forces Model
5. Statistical Insights and Trends Reporting
5.1 Packaging Volume Trends by Product and Region, 2023
5.2 Technology Adoption in Packaging Manufacturing, 2023
5.3 Sustainability Efforts by Type and Region, 2023
5.4 Advancements in Lightweight Packaging Technology, 2023
6. Competitive Landscape
6.1 List of Major Companies, By Region
6.2 Market Share Analysis, By Region
6.3 Product Benchmarking
6.3.1 Product specifications and features
6.3.2 Pricing
6.4 Strategic Initiatives
6.4.1 Marketing and promotional activities
6.4.2 Distribution and Supply Chain Strategies
6.4.3 Expansion plans and new product launches
6.4.4 Strategic partnerships and collaborations
6.5 Technological Advancements
6.6 Market Positioning and Branding
7. Beverage Packaging Market Segmentation, by Material
7.1 Chapter Overview
7.2 Plastic
7.2.1 Plastic Market Trends Analysis (2020-2032)
7.2.2 Plastic Market Size Estimates and Forecasts to 2032 (USD Billion)
7.3 Metal
7.3.1 Metal Market Trends Analysis (2020-2032)
7.3.2 Metal Market Size Estimates and Forecasts to 2032 (USD Billion)
7.4 Glass
7.4.1 Glass Market Trends Analysis (2020-2032)
7.4.2 Glass Market Size Estimates and Forecasts to 2032 (USD Billion)
7.5 Others
7.5.1 Others Market Trends Analysis (2020-2032)
7.5.2 Others Market Size Estimates and Forecasts to 2032 (USD Billion)
8. Beverage Packaging Market Segmentation, by Product Type
8.1 Chapter Overview
8.2 Bottles
8.2.1 Bottles Market Trends Analysis (2020-2032)
8.2.2 Bottles Market Size Estimates and Forecasts to 2032 (USD Billion)
8.3 Cans
8.3.1 Cans Market Trends Analysis (2020-2032)
8.3.2 Cans Market Size Estimates and Forecasts to 2032 (USD Billion)
8.3 Cartons
8.3.1 Cartons Market Trends Analysis (2020-2032)
8.3.2 Cartons Market Size Estimates and Forecasts to 2032 (USD Billion)
8.3 Pouch
8.3.1 Pouch Market Trends Analysis (2020-2032)
8.3.2 Pouch Market Size Estimates and Forecasts to 2032 (USD Billion)
8.3 Others
8.3.1 Others Market Trends Analysis (2020-2032)
8.3.2 Others Market Size Estimates and Forecasts to 2032 (USD Billion)
9. Beverage Packaging Market Segmentation, by Application
9.1 Chapter Overview
9.2 Alcoholic Beverages
9.2.1 Alcoholic Beverages Market Trends Analysis (2020-2032)
9.2.2 Alcoholic Beverages Market Size Estimates and Forecasts to 2032 (USD Billion)
9.3 Non-Alcoholic Beverages
9.3.1 Non-Alcoholic Beverages Market Trends Analysis (2020-2032)
9.3.2 Non-Alcoholic Beverages Market Size Estimates and Forecasts to 2032 (USD Billion)
10. Regional Analysis
10.1 Chapter Overview
10.2 North America
10.2.1 Trends Analysis
10.2.2 North America Beverage Packaging Market Estimates and Forecasts, by Country (2020-2032) (USD Billion)
10.2.3 North America Beverage Packaging Market Estimates and Forecasts, by Material (2020-2032) (USD Billion)
10.2.4 North America Beverage Packaging Market Estimates and Forecasts, by Product Type (2020-2032) (USD Billion)
10.2.5 North America Beverage Packaging Market Estimates and Forecasts, by Application (2020-2032) (USD Billion)
10.2.6 USA
10.2.6.1 USA Beverage Packaging Market Estimates and Forecasts, by Material (2020-2032) (USD Billion)
10.2.6.2 USA Beverage Packaging Market Estimates and Forecasts, by Product Type (2020-2032) (USD Billion)
10.2.6.3 USA Beverage Packaging Market Estimates and Forecasts, by Application (2020-2032) (USD Billion)
10.2.7 Canada
10.2.7.1 Canada Beverage Packaging Market Estimates and Forecasts, by Material (2020-2032) (USD Billion)
10.2.7.2 Canada Beverage Packaging Market Estimates and Forecasts, by Product Type (2020-2032) (USD Billion)
10.2.7.3 Canada Beverage Packaging Market Estimates and Forecasts, by Application (2020-2032) (USD Billion)
10.2.8 Mexico
10.2.8.1 Mexico Beverage Packaging Market Estimates and Forecasts, by Material (2020-2032) (USD Billion)
10.2.8.2 Mexico Beverage Packaging Market Estimates and Forecasts, by Product Type (2020-2032) (USD Billion)
10.2.8.3 Mexico Beverage Packaging Market Estimates and Forecasts, by Application (2020-2032) (USD Billion)
10.3 Europe
10.3.1 Eastern Europe
10.3.1.1 Trends Analysis
10.3.1.2 Eastern Europe Beverage Packaging Market Estimates and Forecasts, by Country (2020-2032) (USD Billion)
10.3.1.3 Eastern Europe Beverage Packaging Market Estimates and Forecasts, by Material (2020-2032) (USD Billion)
10.3.1.4 Eastern Europe Beverage Packaging Market Estimates and Forecasts, by Product Type (2020-2032) (USD Billion)
10.3.1.5 Eastern Europe Beverage Packaging Market Estimates and Forecasts, by Application (2020-2032) (USD Billion)
10.3.1.6 Poland
10.3.1.6.1 Poland Beverage Packaging Market Estimates and Forecasts, by Material (2020-2032) (USD Billion)
10.3.1.6.2 Poland Beverage Packaging Market Estimates and Forecasts, by Product Type (2020-2032) (USD Billion)
10.3.1.6.3 Poland Beverage Packaging Market Estimates and Forecasts, by Application (2020-2032) (USD Billion)
10.3.1.7 Romania
10.3.1.7.1 Romania Beverage Packaging Market Estimates and Forecasts, by Material (2020-2032) (USD Billion)
10.3.1.7.2 Romania Beverage Packaging Market Estimates and Forecasts, by Product Type (2020-2032) (USD Billion)
10.3.1.7.3 Romania Beverage Packaging Market Estimates and Forecasts, by Application (2020-2032) (USD Billion)
10.3.1.8 Hungary
10.3.1.8.1 Hungary Beverage Packaging Market Estimates and Forecasts, by Material (2020-2032) (USD Billion)
10.3.1.8.2 Hungary Beverage Packaging Market Estimates and Forecasts, by Product Type (2020-2032) (USD Billion)
10.3.1.8.3 Hungary Beverage Packaging Market Estimates and Forecasts, by Application (2020-2032) (USD Billion)
10.3.1.9 Turkey
10.3.1.9.1 Turkey Beverage Packaging Market Estimates and Forecasts, by Material (2020-2032) (USD Billion)
10.3.1.9.2 Turkey Beverage Packaging Market Estimates and Forecasts, by Product Type (2020-2032) (USD Billion)
10.3.1.9.3 Turkey Beverage Packaging Market Estimates and Forecasts, by Application (2020-2032) (USD Billion)
10.3.1.10 Rest of Eastern Europe
10.3.1.10.1 Rest of Eastern Europe Beverage Packaging Market Estimates and Forecasts, by Material (2020-2032) (USD Billion)
10.3.1.10.2 Rest of Eastern Europe Beverage Packaging Market Estimates and Forecasts, by Product Type (2020-2032) (USD Billion)
10.3.1.10.3 Rest of Eastern Europe Beverage Packaging Market Estimates and Forecasts, by Application (2020-2032) (USD Billion)
10.3.2 Western Europe
10.3.2.1 Trends Analysis
10.3.2.2 Western Europe Beverage Packaging Market Estimates and Forecasts, by Country (2020-2032) (USD Billion)
10.3.2.3 Western Europe Beverage Packaging Market Estimates and Forecasts, by Material (2020-2032) (USD Billion)
10.3.2.4 Western Europe Beverage Packaging Market Estimates and Forecasts, by Product Type (2020-2032) (USD Billion)
10.3.2.5 Western Europe Beverage Packaging Market Estimates and Forecasts, by Application (2020-2032) (USD Billion)
10.3.2.6 Germany
10.3.2.6.1 Germany Beverage Packaging Market Estimates and Forecasts, by Material (2020-2032) (USD Billion)
10.3.2.6.2 Germany Beverage Packaging Market Estimates and Forecasts, by Product Type (2020-2032) (USD Billion)
10.3.2.6.3 Germany Beverage Packaging Market Estimates and Forecasts, by Application (2020-2032) (USD Billion)
10.3.2.7 France
10.3.2.7.1 France Beverage Packaging Market Estimates and Forecasts, by Material (2020-2032) (USD Billion)
10.3.2.7.2 France Beverage Packaging Market Estimates and Forecasts, by Product Type (2020-2032) (USD Billion)
10.3.2.7.3 France Beverage Packaging Market Estimates and Forecasts, by Application (2020-2032) (USD Billion)
10.3.2.8 UK
10.3.2.8.1 UK Beverage Packaging Market Estimates and Forecasts, by Material (2020-2032) (USD Billion)
10.3.2.8.2 UK Beverage Packaging Market Estimates and Forecasts, by Product Type (2020-2032) (USD Billion)
10.3.2.8.3 UK Beverage Packaging Market Estimates and Forecasts, by Application (2020-2032) (USD Billion)
10.3.2.9 Italy
10.3.2.9.1 Italy Beverage Packaging Market Estimates and Forecasts, by Material (2020-2032) (USD Billion)
10.3.2.9.2 Italy Beverage Packaging Market Estimates and Forecasts, by Product Type (2020-2032) (USD Billion)
10.3.2.9.3 Italy Beverage Packaging Market Estimates and Forecasts, by Application (2020-2032) (USD Billion)
10.3.2.10 Spain
10.3.2.10.1 Spain Beverage Packaging Market Estimates and Forecasts, by Material (2020-2032) (USD Billion)
10.3.2.10.2 Spain Beverage Packaging Market Estimates and Forecasts, by Product Type (2020-2032) (USD Billion)
10.3.2.10.3 Spain Beverage Packaging Market Estimates and Forecasts, by Application (2020-2032) (USD Billion)
10.3.2.11 Netherlands
10.3.2.11.1 Netherlands Beverage Packaging Market Estimates and Forecasts, by Material (2020-2032) (USD Billion)
10.3.2.11.2 Netherlands Beverage Packaging Market Estimates and Forecasts, by Product Type (2020-2032) (USD Billion)
10.3.2.11.3 Netherlands Beverage Packaging Market Estimates and Forecasts, by Application (2020-2032) (USD Billion)
10.3.2.12 Switzerland
10.3.2.12.1 Switzerland Beverage Packaging Market Estimates and Forecasts, by Material (2020-2032) (USD Billion)
10.3.2.12.2 Switzerland Beverage Packaging Market Estimates and Forecasts, by Product Type (2020-2032) (USD Billion)
10.3.2.12.3 Switzerland Beverage Packaging Market Estimates and Forecasts, by Application (2020-2032) (USD Billion)
10.3.2.13 Austria
10.3.2.13.1 Austria Beverage Packaging Market Estimates and Forecasts, by Material (2020-2032) (USD Billion)
10.3.2.13.2 Austria Beverage Packaging Market Estimates and Forecasts, by Product Type (2020-2032) (USD Billion)
10.3.2.13.3 Austria Beverage Packaging Market Estimates and Forecasts, by Application (2020-2032) (USD Billion)
10.3.2.14 Rest of Western Europe
10.3.2.14.1 Rest of Western Europe Beverage Packaging Market Estimates and Forecasts, by Material (2020-2032) (USD Billion)
10.3.2.14.2 Rest of Western Europe Beverage Packaging Market Estimates and Forecasts, by Product Type (2020-2032) (USD Billion)
10.3.2.14.3 Rest of Western Europe Beverage Packaging Market Estimates and Forecasts, by Application (2020-2032) (USD Billion)
10.4 Asia Pacific
10.4.1 Trends Analysis
10.4.2 Asia Pacific Beverage Packaging Market Estimates and Forecasts, by Country (2020-2032) (USD Billion)
10.4.3 Asia Pacific Beverage Packaging Market Estimates and Forecasts, by Material (2020-2032) (USD Billion)
10.4.4 Asia Pacific Beverage Packaging Market Estimates and Forecasts, by Product Type (2020-2032) (USD Billion)
10.4.5 Asia Pacific Beverage Packaging Market Estimates and Forecasts, by Application (2020-2032) (USD Billion)
10.4.6 China
10.4.6.1 China Beverage Packaging Market Estimates and Forecasts, by Material (2020-2032) (USD Billion)
10.4.6.2 China Beverage Packaging Market Estimates and Forecasts, by Product Type (2020-2032) (USD Billion)
10.4.6.3 China Beverage Packaging Market Estimates and Forecasts, by Application (2020-2032) (USD Billion)
10.4.7 India
10.4.7.1 India Beverage Packaging Market Estimates and Forecasts, by Material (2020-2032) (USD Billion)
10.4.7.2 India Beverage Packaging Market Estimates and Forecasts, by Product Type (2020-2032) (USD Billion)
10.4.7.3 India Beverage Packaging Market Estimates and Forecasts, by Application (2020-2032) (USD Billion)
10.4.8 Japan
10.4.8.1 Japan Beverage Packaging Market Estimates and Forecasts, by Material (2020-2032) (USD Billion)
10.4.8.2 Japan Beverage Packaging Market Estimates and Forecasts, by Product Type (2020-2032) (USD Billion)
10.4.8.3 Japan Beverage Packaging Market Estimates and Forecasts, by Application (2020-2032) (USD Billion)
10.4.9 South Korea
10.4.9.1 South Korea Beverage Packaging Market Estimates and Forecasts, by Material (2020-2032) (USD Billion)
10.4.9.2 South Korea Beverage Packaging Market Estimates and Forecasts, by Product Type (2020-2032) (USD Billion)
10.4.9.3 South Korea Beverage Packaging Market Estimates and Forecasts, by Application (2020-2032) (USD Billion)
10.4.10 Vietnam
10.4.10.1 Vietnam Beverage Packaging Market Estimates and Forecasts, by Material (2020-2032) (USD Billion)
10.4.10.2 Vietnam Beverage Packaging Market Estimates and Forecasts, by Product Type (2020-2032) (USD Billion)
10.4.10.3 Vietnam Beverage Packaging Market Estimates and Forecasts, by Application (2020-2032) (USD Billion)
10.4.11 Singapore
10.4.11.1 Singapore Beverage Packaging Market Estimates and Forecasts, by Material (2020-2032) (USD Billion)
10.4.11.2 Singapore Beverage Packaging Market Estimates and Forecasts, by Product Type (2020-2032) (USD Billion)
10.4.11.3 Singapore Beverage Packaging Market Estimates and Forecasts, by Application (2020-2032) (USD Billion)
10.4.12 Australia
10.4.12.1 Australia Beverage Packaging Market Estimates and Forecasts, by Material (2020-2032) (USD Billion)
10.4.12.2 Australia Beverage Packaging Market Estimates and Forecasts, by Product Type (2020-2032) (USD Billion)
10.4.12.3 Australia Beverage Packaging Market Estimates and Forecasts, by Application (2020-2032) (USD Billion)
10.4.13 Rest of Asia Pacific
10.4.13.1 Rest of Asia Pacific Beverage Packaging Market Estimates and Forecasts, by Material (2020-2032) (USD Billion)
10.4.13.2 Rest of Asia Pacific Beverage Packaging Market Estimates and Forecasts, by Product Type (2020-2032) (USD Billion)
10.4.13.3 Rest of Asia Pacific Beverage Packaging Market Estimates and Forecasts, by Application (2020-2032) (USD Billion)
10.5 Middle East and Africa
10.5.1 Middle East
10.5.1.1 Trends Analysis
10.5.1.2 Middle East Beverage Packaging Market Estimates and Forecasts, by Country (2020-2032) (USD Billion)
10.5.1.3 Middle East Beverage Packaging Market Estimates and Forecasts, by Material (2020-2032) (USD Billion)
10.5.1.4 Middle East Beverage Packaging Market Estimates and Forecasts, by Product Type (2020-2032) (USD Billion)
10.5.1.5 Middle East Beverage Packaging Market Estimates and Forecasts, by Application (2020-2032) (USD Billion)
10.5.1.6 UAE
10.5.1.6.1 UAE Beverage Packaging Market Estimates and Forecasts, by Material (2020-2032) (USD Billion)
10.5.1.6.2 UAE Beverage Packaging Market Estimates and Forecasts, by Product Type (2020-2032) (USD Billion)
10.5.1.6.3 UAE Beverage Packaging Market Estimates and Forecasts, by Application (2020-2032) (USD Billion)
10.5.1.7 Egypt
10.5.1.7.1 Egypt Beverage Packaging Market Estimates and Forecasts, by Material (2020-2032) (USD Billion)
10.5.1.7.2 Egypt Beverage Packaging Market Estimates and Forecasts, by Product Type (2020-2032) (USD Billion)
10.5.1.7.3 Egypt Beverage Packaging Market Estimates and Forecasts, by Application (2020-2032) (USD Billion)
10.5.1.8 Saudi Arabia
10.5.1.8.1 Saudi Arabia Beverage Packaging Market Estimates and Forecasts, by Material (2020-2032) (USD Billion)
10.5.1.8.2 Saudi Arabia Beverage Packaging Market Estimates and Forecasts, by Product Type (2020-2032) (USD Billion)
10.5.1.8.3 Saudi Arabia Beverage Packaging Market Estimates and Forecasts, by Application (2020-2032) (USD Billion)
10.5.1.9 Qatar
10.5.1.9.1 Qatar Beverage Packaging Market Estimates and Forecasts, by Material (2020-2032) (USD Billion)
10.5.1.9.2 Qatar Beverage Packaging Market Estimates and Forecasts, by Product Type (2020-2032) (USD Billion)
10.5.1.9.3 Qatar Beverage Packaging Market Estimates and Forecasts, by Application (2020-2032) (USD Billion)
10.5.1.10 Rest of Middle East
10.5.1.10.1 Rest of Middle East Beverage Packaging Market Estimates and Forecasts, by Material (2020-2032) (USD Billion)
10.5.1.10.2 Rest of Middle East Beverage Packaging Market Estimates and Forecasts, by Product Type (2020-2032) (USD Billion)
10.5.1.10.3 Rest of Middle East Beverage Packaging Market Estimates and Forecasts, by Application (2020-2032) (USD Billion)
10.5.2 Africa
10.5.2.1 Trends Analysis
10.5.2.2 Africa Beverage Packaging Market Estimates and Forecasts, by Country (2020-2032) (USD Billion)
10.5.2.3 Africa Beverage Packaging Market Estimates and Forecasts, by Material (2020-2032) (USD Billion)
10.5.2.4 Africa Beverage Packaging Market Estimates and Forecasts, by Product Type (2020-2032) (USD Billion)
10.5.2.5 Africa Beverage Packaging Market Estimates and Forecasts, by Application (2020-2032) (USD Billion)
10.5.2.6 South Africa
10.5.2.6.1 South Africa Beverage Packaging Market Estimates and Forecasts, by Material (2020-2032) (USD Billion)
10.5.2.6.2 South Africa Beverage Packaging Market Estimates and Forecasts, by Product Type (2020-2032) (USD Billion)
10.5.2.6.3 South Africa Beverage Packaging Market Estimates and Forecasts, by Application (2020-2032) (USD Billion)
10.5.2.7 Nigeria
10.5.2.7.1 Nigeria Beverage Packaging Market Estimates and Forecasts, by Material (2020-2032) (USD Billion)
10.5.2.7.2 Nigeria Beverage Packaging Market Estimates and Forecasts, by Product Type (2020-2032) (USD Billion)
10.5.2.7.3 Nigeria Beverage Packaging Market Estimates and Forecasts, by Application (2020-2032) (USD Billion)
10.5.2.8 Rest of Africa
10.5.2.8.1 Rest of Africa Beverage Packaging Market Estimates and Forecasts, by Material (2020-2032) (USD Billion)
10.5.2.8.2 Rest of Africa Beverage Packaging Market Estimates and Forecasts, by Product Type (2020-2032) (USD Billion)
10.5.2.8.3 Rest of Africa Beverage Packaging Market Estimates and Forecasts, by Application (2020-2032) (USD Billion)
10.6 Latin America
10.6.1 Trends Analysis
10.6.2 Latin America Beverage Packaging Market Estimates and Forecasts, by Country (2020-2032) (USD Billion)
10.6.3 Latin America Beverage Packaging Market Estimates and Forecasts, by Material (2020-2032) (USD Billion)
10.6.4 Latin America Beverage Packaging Market Estimates and Forecasts, by Product Type (2020-2032) (USD Billion)
10.6.5 Latin America Beverage Packaging Market Estimates and Forecasts, by Application (2020-2032) (USD Billion)
10.6.6 Brazil
10.6.6.1 Brazil Beverage Packaging Market Estimates and Forecasts, by Material (2020-2032) (USD Billion)
10.6.6.2 Brazil Beverage Packaging Market Estimates and Forecasts, by Product Type (2020-2032) (USD Billion)
10.6.6.3 Brazil Beverage Packaging Market Estimates and Forecasts, by Application (2020-2032) (USD Billion)
10.6.7 Argentina
10.6.7.1 Argentina Beverage Packaging Market Estimates and Forecasts, by Material (2020-2032) (USD Billion)
10.6.7.2 Argentina Beverage Packaging Market Estimates and Forecasts, by Product Type (2020-2032) (USD Billion)
10.6.7.3 Argentina Beverage Packaging Market Estimates and Forecasts, by Application (2020-2032) (USD Billion)
10.6.8 Colombia
10.6.8.1 Colombia Beverage Packaging Market Estimates and Forecasts, by Material (2020-2032) (USD Billion)
10.6.8.2 Colombia Beverage Packaging Market Estimates and Forecasts, by Product Type (2020-2032) (USD Billion)
10.6.8.3 Colombia Beverage Packaging Market Estimates and Forecasts, by Application (2020-2032) (USD Billion)
10.6.9 Rest of Latin America
10.6.9.1 Rest of Latin America Beverage Packaging Market Estimates and Forecasts, by Material (2020-2032) (USD Billion)
10.6.9.2 Rest of Latin America Beverage Packaging Market Estimates and Forecasts, by Product Type (2020-2032) (USD Billion)
10.6.9.3 Rest of Latin America Beverage Packaging Market Estimates and Forecasts, by Application (2020-2032) (USD Billion)
11. Company Profiles
11.1 Bemis Company, Inc.
11.1.1 Company Overview
11.1.2 Financial
11.1.3 Products/ Services Offered
11.1.4 SWOT Analysis
11.2 Sonoco Products Company
11.2.1 Company Overview
11.2.2 Financial
11.2.3 Products/ Services Offered
11.2.4 SWOT Analysis
11.3 Scholle IP
11.3.1 Company Overview
11.3.2 Financial
11.3.3 Products/ Services Offered
11.3.4 SWOT Analysis
11.4 Mondi
11.4.1 Company Overview
11.4.2 Financial
11.4.3 Products/ Services Offered
11.4.4 SWOT Analysis
11.5 Amcor pl
11.5.1 Company Overview
11.5.2 Financial
11.5.3 Products/ Services Offered
11.5.4 SWOT Analysis
11.6 Reynolds Group Ltd
11.6.1 Company Overview
11.6.2 Financial
11.6.3 Products/ Services Offered
11.6.4 SWOT Analysis
11.7 Tetra Laval International S.A
11.7.1 Company Overview
11.7.2 Financial
11.7.3 Products/ Services Offered
11.7.4 SWOT Analysis
11.8 Crow
11.8.1 Company Overview
11.8.2 Financial
11.8.3 Products/ Servies Offered
11.8.4 SWOT Analysis
11.9 Stora Ens
11.9.1 Company Overview
11.9.2 Financial
11.9.3 Products/ Services Offered
11.9.4 SWOT Analysis
11.10 Ball Corporatio
11.10.1 Company Overview
11.10.2 Financial
11.10.3 Products/ Services Offered
11.10.4 SWOT Analysis
12. Use Cases and Best Practices
13. Conclusion
An accurate research report requires proper strategizing as well as implementation. There are multiple factors involved in the completion of good and accurate research report and selecting the best methodology to compete the research is the toughest part. Since the research reports we provide play a crucial role in any company’s decision-making process, therefore we at SNS Insider always believe that we should choose the best method which gives us results closer to reality. This allows us to reach at a stage wherein we can provide our clients best and accurate investment to output ratio.
Each report that we prepare takes a timeframe of 350-400 business hours for production. Starting from the selection of titles through a couple of in-depth brain storming session to the final QC process before uploading our titles on our website we dedicate around 350 working hours. The titles are selected based on their current market cap and the foreseen CAGR and growth.
The 5 steps process:
Step 1: Secondary Research:
Secondary Research or Desk Research is as the name suggests is a research process wherein, we collect data through the readily available information. In this process we use various paid and unpaid databases which our team has access to and gather data through the same. This includes examining of listed companies’ annual reports, Journals, SEC filling etc. Apart from this our team has access to various associations across the globe across different industries. Lastly, we have exchange relationships with various university as well as individual libraries.
Step 2: Primary Research
When we talk about primary research, it is a type of study in which the researchers collect relevant data samples directly, rather than relying on previously collected data. This type of research is focused on gaining content specific facts that can be sued to solve specific problems. Since the collected data is fresh and first hand therefore it makes the study more accurate and genuine.
We at SNS Insider have divided Primary Research into 2 parts.
Part 1 wherein we interview the KOLs of major players as well as the upcoming ones across various geographic regions. This allows us to have their view over the market scenario and acts as an important tool to come closer to the accurate market numbers. As many as 45 paid and unpaid primary interviews are taken from both the demand and supply side of the industry to make sure we land at an accurate judgement and analysis of the market.
This step involves the triangulation of data wherein our team analyses the interview transcripts, online survey responses and observation of on filed participants. The below mentioned chart should give a better understanding of the part 1 of the primary interview.
Part 2: In this part of primary research the data collected via secondary research and the part 1 of the primary research is validated with the interviews from individual consultants and subject matter experts.
Consultants are those set of people who have at least 12 years of experience and expertise within the industry whereas Subject Matter Experts are those with at least 15 years of experience behind their back within the same space. The data with the help of two main processes i.e., FGDs (Focused Group Discussions) and IDs (Individual Discussions). This gives us a 3rd party nonbiased primary view of the market scenario making it a more dependable one while collation of the data pointers.
Step 3: Data Bank Validation
Once all the information is collected via primary and secondary sources, we run that information for data validation. At our intelligence centre our research heads track a lot of information related to the market which includes the quarterly reports, the daily stock prices, and other relevant information. Our data bank server gets updated every fortnight and that is how the information which we collected using our primary and secondary information is revalidated in real time.
Step 4: QA/QC Process
After all the data collection and validation our team does a final level of quality check and quality assurance to get rid of any unwanted or undesired mistakes. This might include but not limited to getting rid of the any typos, duplication of numbers or missing of any important information. The people involved in this process include technical content writers, research heads and graphics people. Once this process is completed the title gets uploader on our platform for our clients to read it.
Step 5: Final QC/QA Process:
This is the last process and comes when the client has ordered the study. In this process a final QA/QC is done before the study is emailed to the client. Since we believe in giving our clients a good experience of our research studies, therefore, to make sure that we do not lack at our end in any way humanly possible we do a final round of quality check and then dispatch the study to the client.
By Raw Material
By Product Type
Liquid Cartons
Plastic Bottles
Glass Bottles
Cans
Pouches
Others
By Application
Alcoholic
Non-Alcoholic
Request for Segment Customization as per your Business Requirement: Segment Customization Request
North America
US
Canada
Mexico
Europe
Eastern Europe
Poland
Romania
Hungary
Turkey
Rest of Eastern Europe
Western Europe
Germany
France
UK
Italy
Spain
Netherlands
Switzerland
Austria
Rest of Western Europe
Asia-Pacific
China
India
Japan
South Korea
Vietnam
Singapore
Australia
Rest of Asia Pacific
Middle East & Africa
Middle East
UAE
Egypt
Saudi Arabia
Qatar
Rest of the Middle East
Africa
Nigeria
South Africa
Rest of Africa
Latin America
Brazil
Argentina
Colombia
Rest of Latin America
Request for Country Level Research Report: Country Level Customization Request
With the given market data, SNS Insider offers customization as per the company’s specific needs. The following customization options are available for the report:
Product Analysis
Criss-Cross segment analysis (e.g. Product X Application)
Product Matrix which gives a detailed comparison of the product portfolio of each company
Geographic Analysis
Additional countries in any of the regions
Company Information
Detailed analysis and profiling of additional market players (Up to five)
The AI In Packaging Market Size was valued at USD 2100 million in 2023 and is expected to reach USD 5593.62 million by 2031 and grow at a CAGR of 11.5 % over the forecast period 2024-2031.
The Pharmaceutical Glass Ampoules Market Size was valued at USD 3.23 billion in 2023 and is expected to reach USD 5.65 billion by 2031 and grow at a CAGR of 7.2% over the forecast period 2024-2031.
The Alcohol Packaging Market size was valued at USD 75.37 billion in 2023 and is expected to Reach USD 112.97 billion by 2032 and grow at a CAGR of 4.6 % over the forecast period of 2024-2032.
The Flexible Paper Packaging Market size was valued at USD 69.27 billion in 2023 and is estimated to reach USD 117.25 billion by 2031, and is expected to grow at a CAGR of 4.02% over the forecast period of 2024-2031.
Paperboard Folding Carton Market Size was valued at USD 79.13 billion in 2023 and is expected to reach USD 120.78 billion by 2032 and grow at a CAGR of 4.81% by 2024-2032
The Box And Carton Overwrap Film Market size was USD 12.18 billion in 2023 and is expected to Reach USD 16.42 billion by 2031 and grow at a CAGR of 3.8% over the forecast period of 2024-2031.
Hi! Click one of our member below to chat on Phone