image

Battery Metals Market Report Scope & Overview:

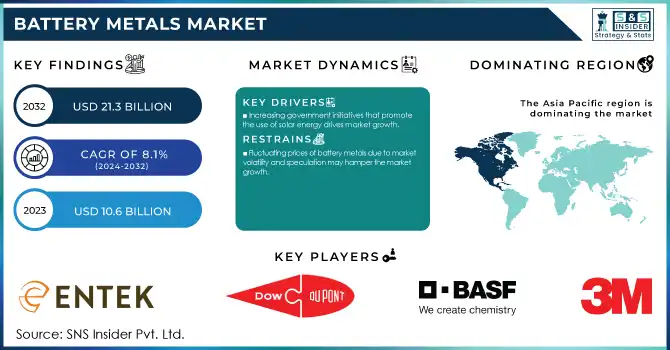
The Battery Metals Market size was USD 10.6 Billion in 2023 and is expected to reach USD 21.3 Billion by 2032 and grow at a CAGR of 8.1% over the forecast period of 2024-2032.

Battery Metals Market Revenue Analysis

Get More Information on Battery Metals Market - Request Sample Report

Rising demand for electric vehicles (EVs) is one of the key drivers fuelling the growth of the battery metals market. With the rising global alarm over climate change, countries across the world have adopted harsher environmental regulations, promoted green technologies, and adopted demanding remediation targets for their carbon emissions. It has resulted in an enormous movement towards electric mobility as a more sustainable option to gasoline and diesel-powered automobiles. Increasing EV adoption is also directly driving demand for high-performance batteries that need key metals such as lithium, cobalt, nickel and graphite. The burnishing of battery metals is only becoming more serious as automakers increase their output of electric cars in response increasingly to both regulatory pressure and consumer desire for low-footprint alternatives. This transition is also aided by continuous improvements in EV battery technology with efficient ranges and fast charging enabling a much wider audience for affordable electric vehicles. The expanding network of EV charging stations and the rising number of EV models available for purchase at different price points are further supporting adoption, which in turn is solidifying the demand for the raw materials needed to fuel these cars.

The FAME scheme provides financial incentives for the adoption and manufacturing of hybrid and electric vehicles. The government has approved a two-year extension of the scheme with an outlay of ₹109 billion (approximately USD 1.3 billion) to further promote EV adoption.

The growth of innovation and demand in the battery metals market is primarily driven by advancements in battery chemistry. These innovations aim to enhance battery performance, energy density, and lifecycle, which are essential for electric vehicles (EVs), renewable energy storage, and portable electronics. One such example is the use of solid-state batteries, as opposed to a liquid electrolyte, which promises to greatly improve safety by minimizing the likelihood of leakages and fires. They also promise higher energy densities, which means more miles per charge for an EV or longer-lasting flywheels for energy storage applications. In addition, advancements in lithium-ion (Li-ion) batteries are improving performance and decreasing the reliance on expensive and scarce materials through the substitution of higher-grade nickel and cobalt. Other innovations that have gained traction involve sodium-ion batteries, which provide a relatively cheaper and widely available substitute to lithium and promoters consider multifaceted utilization in energy storage scenarios. Such technological advancements are improving both battery safety and performance but also playing a significant role in the transition away from traditional energy solutions towards more sustainable and affordable ones.

In 2022, the Indian government announced the National Programme on Advanced Chemistry Cell (ACC) with an outlay of ₹18,100 crore (approximately USD 2.4 billion). This program aims to promote the manufacturing of advanced battery technologies, including lithium-ion batteries, to reduce import dependence and boost domestic production.

Battery Metals Market Dynamics

Drivers

  • Increasing government initiatives that promote the use of solar energy drives market growth. 

One of the most important factors creating demand for Battery Metals over the forecast period is increasing government initiatives to adopt solar energy. Various nations and countries around the world --particularly those in the developed world-- are laying out lofty plans filled with policies, subsidies, and programs to accelerate the rollout of renewable energy and carbon neutrality goals. Such measures include tax credits, grants, feed-in tariffs, and loans at below-market interest rates, which have reduced the costs of solar energy systems for residential, commercial, and industrial users. Furthermore, regulation, especially renewable portfolio standards (RPS) and net metering policies, will force many governments to use renewable energy, thereby making solar energy more popular. As an example, the European Green Deal requires the European Union, as a whole, to reach at least 40% renewable energy by 2030, which will translate into increasing demand for innovative solar technologies such as Battery Metals. In same way, the U.S. Inflation Reduction Act of 2022 contains hundreds of billions in grants and tax credits for the expansion of solar energy. These are because these measures further minimize the financial barriers for consumers while also stimulating the development of advanced solar technologies in the form of battery metals, making them efficient accessible, and eventually pervasive.

Restraint

  • Fluctuating prices of battery metals due to market volatility and speculation may hamper the market growth.

A major challenge of the battery metals market is the fluctuating prices of battery metals that is caused by market volatility and speculation. Battery metals such as lithium, cobalt, nickel and graphite have experienced price fluctuations as a result of supply induced demand gaps, geopolitical tensions and commodity speculation. The fast-growing need for electric vehicles (EVs) and renewable energy storage is putting pressure on supply chains of these metals, often faster than new mining or recycling are ramping up. Thus, any interruption in mining, smelting or transportation, for example by labor strikes, environmental regulations, or political instability, is enough to instantly boost prices significantly. In addition, commodity market investors speculate, and buying and selling on the prediction of the future price of battery metals can result in unrealistic price changes that do not actually correspond with the fundamentals of the market. This uncertainty, in turn, can serve make it harder for manufacturers of EVs and other battery-powered technologies to gauge expected costs and plan for longer stretches of time. Price fluctuations create complexities in procuring raw materials for companies within the industry as they face the risk of taking sudden increases/decreases in prices that may alter their profit margins and pricing strategies. As a result, the changing prices of battery metals create a minimum threshold of instability for both the market and the investment strategies needed to rely on battery technologies to the fullest extent possible.

Opportunities

  • Emerging markets for EVs and renewable energy storage systems in developing countries.

  • Innovations in battery technology, such as solid-state batteries and advanced materials.

  • Expansion of lithium-ion battery recycling initiatives to recover valuable metals.

Battery Metals Market Segmentation Analysis

By Type

The lithium segment held the largest market share around 49% in 2023.  Lithium is the most used metal to produce rechargeable lithium-ion (Li-ion) batteries, which are the most common type of battery found in electric vehicles (EVs), consumer electronics and renewable energy storage systems. Lithium-ion batteries are preferred due to their high energy density, long cycle life, and fairly low weight, characteristics that render them well-suited to applications requiring portable and efficient power sources. As electric vehicle sales soar and those vehicles require high-performance batteries with more energy storage per unit weight lithium has now become a strategic raw material. The worldwide drive for sustainable transportation and green energy solutions has increased the need for lithium even more, as lithium is necessary to small commodities that enable mass adoption of EVs.

By Applications

Starter, Lighting, & Ignition (SLI) held a significant revenue share of around 36% in 2023. This is due to its ubiquitous use and importance for automotive and transportation power storage applications. It not only starts the engine but also helps to power the lighting system and ensure proper ignition. These batteries are present in almost every ICE (internal combustion engine) car and are therefore a vital part of the automotive industry. Still, the global automotive market is currently driven by internal combustion engine (ICE) vehicles in which SLI batteries are used, and this will continue for the foreseeable future. Moreover, as automotive technology advances, the battery Japan Recycle Investment car SLI demand for more complex Steady State Battery vehicle systems such as advanced lighting systems, infotainment systems, airbag and power steering systems, etc. are driving their growth. The growth of the automotive industry and the rising volume of vehicles on the road around the globe have aided in the expansion of the market share of the SLI segment.

Battery Metals Market Regional Outlook

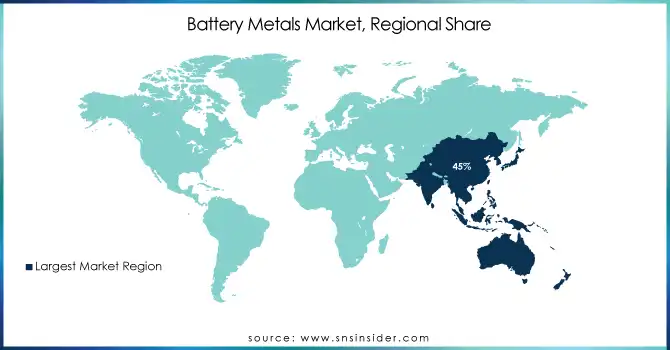
Asia Pacific dominated the Battery Metals Market with the highest revenue share of more than 45% in 2023. The region hosts major manufacturers of electric vehicles (EVs), consumer electronics, and renewable energy systems, driving substantial demand for battery metals. Additionally, Asia Pacific benefits from robust government initiatives and investments in clean energy infrastructure, further propelling market growth. Moreover, the presence of key battery metal mining and processing facilities across the region solidifies its position as a powerhouse in the global battery metals market.

North America is the second largest region in the Battery Metals Market due to the region's robust adoption of electric vehicles (EVs) and renewable energy technologies propels the demand for battery metals like lithium, cobalt, and nickel. Moreover, North America boasts a significant presence of key market players engaged in battery manufacturing and innovation, further driving market growth. Additionally, supportive government policies and investments in sustainable energy infrastructure contribute to the region's prominence in the global battery metals market landscape.

Battery-Metals-Market-Regional-Share

Get Customized Report as per Your Business Requirement - Request For Customized Report

Key Players

  • 3M (Scotchshield Insulation, Novec Dielectric Fluids)

  • BASF SE (Cathode Active Materials, Battery Binders)

  • DowDuPont (BETASEAL Adhesives, Hytrel Resins)

  • Entek (Separators, AGM Battery Materials)

  • Ecopro (High-Nickel Cathode Materials, Battery Recycling Systems)

  • Hitachi Chemical Co. Ltd (Graphite Anodes, Solid-State Electrolytes)

  • Mitsubishi Chemical Corporation (Electrolytes, Carbon Nanotubes)

  • Nippon Denko Co. Ltd (Manganese, Lithium Battery Additives)

  • Solvay (PVDF Binders, Battery Electrolyte Salts)

  • Celgard LLC (Microporous Separators, Polypropylene Separators)

  • LG Chem (Pouch Cells, NCM Cathodes)

  • Samsung SDI (EV Batteries, Cylindrical Cells)

  • Panasonic Corporation (18650 Batteries, Prismatic Cells)

  • Tesla Inc. (4680 Cells, Energy Storage Systems)

  • BYD Company Ltd (Blade Batteries, LFP Batteries)

  • CATL (Contemporary Amperex Technology Co. Ltd) (NMC Batteries, Sodium-Ion Batteries)

  • GS Yuasa Corporation (Lead-Acid Batteries, Li-ion Modules)

  • Umicore (Cobalt Refining, Battery Recycling Solutions)

  • Johnson Matthey (Cathode Materials, Battery Systems)

  • SK Innovation (High-Nickel Cathodes, EV Batteries)

Recent Development:

  • In February 2024, Cirba Solutions, a leading company in battery recycling and battery materials, has entered into a collaboration with EcoPro Co Ltd (EcoPro), a global leader in lithium-ion battery cathode materials, through a signed Memorandum of Understanding (MOU) to enhance innovative aspects of the lithium-ion battery recycling industry.

  • In May 2022, Hitachi Metals, Ltd. (Hitachi Metals) announced the development of technology that enables lithium-ion batteries (LIBs) to have excellent cycle performance and high capacity, even with a reduced amount of cobalt (Co) in the cathode materials.

  • In April 2022, ENTEK has committed to significantly expanding its lithium-ion battery separator production in the United States to meet the urgent need for a sustainable and resilient domestic lithium battery supply chain as mandated by the US Department of Energy.

  • In November 2021, Solvay Ventures, the venture capital arm of Solvay, invested Sepion, a California-based start-up specializing in the development of batteries with Li-metal anodes and liquid electrolytes.

Battery Metals Market Report Scope:

Report Attributes Details
Market Size in 2023 US$ 10.6 Billion
Market Size by 2032 US$ 21.3 Billion
CAGR CAGR of 8.1% From 2024 to 2032
Base Year 2023
Forecast Period 2024-2032
Historical Data 2020-2022
Report Scope & Coverage Market Size, Segments Analysis, Competitive  Landscape, Regional Analysis, DROC & SWOT Analysis, Forecast Outlook
Key Segments • By Type (Lithium, Nickel, Cobalt, and Others)
• By Application (Electric Vehicles, Consumer Electronics, Starter, Lighting, & Ignition (SLI), Energy Storage Systems, and Others)
Regional Analysis/Coverage North America (US, Canada, Mexico), Europe (Eastern Europe [Poland, Romania, Hungary, Turkey, Rest of Eastern Europe] Western Europe] Germany, France, UK, Italy, Spain, Netherlands, Switzerland, Austria, Rest of Western Europe]), Asia Pacific (China, India, Japan, South Korea, Vietnam, Singapore, Australia, Rest of Asia Pacific), Middle East & Africa (Middle East [UAE, Egypt, Saudi Arabia, Qatar, Rest of Middle East], Africa [Nigeria, South Africa, Rest of Africa], Latin America (Brazil, Argentina, Colombia, Rest of Latin America)
Company Profiles 3M, BASF SE, DowDuPont, Entek, Ecopro, Hitachi Chemical Co. Ltd, Mitsubishi Chemical Corporation, Nippon Denko Co. Ltd, Solvay, Celgard LLC, and other players.
DRIVERS • Increasing government initiatives that promote the use of solar energy drives market growth.   
Restraints • Fluctuating prices of battery metals due to market volatility and speculation may hamper the market growth.

Frequently Asked Questions

Ans. The Compound Annual Growth rate for the Battery Metals Market over the forecast period is 8.1%.

Ans. The projected market size for the Battery Metals Market is USD 21.3 Billion by 2032.

Ans: China dominated the Asia Pacific region in the Battery Metals Market with the highest revenue share in 2023.

Ans: The Battery Metals Market is primarily driven by the increasing demand for electric vehicles (EVs) and renewable energy storage solutions, which require essential metals like lithium, cobalt, and nickel for battery manufacturing.

Ans: Challenges for the Battery Metals Market include fluctuating prices due to market volatility, competition for access to raw materials, and addressing environmental and social concerns associated with metal extraction and processing.


Table of Contents:

1. Introduction

1.1 Market Definition

1.2 Scope (Inclusion and Exclusions)

1.3 Research Assumptions

2. Executive Summary

2.1 Market Overview       

2.2 Regional Synopsis

2.3 Competitive Summary

3. Research Methodology

3.1 Top-Down Approach

3.2 Bottom-up Approach

3.3. Data Validation

3.4 Primary Interviews

4. Market Dynamics Impact Analysis

3.1 Market Driving Factors Analysis

3.1.2 Drivers

3.1.2 Restraints

3.1.3 Opportunities

3.1.4 Challenges

3.2 PESTLE Analysis

3.3 Porter’s Five Forces Model

5. Statistical Insights and Trends Reporting

5.1 By Production Capacity and Utilization, by Country, By Type, 2023

5.2 Feedstock Prices, by Country, By Type, 2023

5.3   Regulatory Impact, by l Country, By Type, 2023.

5.4 Environmental Metrics: Emissions Data, Waste Management Practices, and     Sustainability Initiatives, by Region

5.5 Innovation and R&D, Type, 2023

6. Competitive Landscape

6.1 List of Major Companies, By Region

6.2 Market Share Analysis, By Region

6.3 By Product Benchmarking

6.3.1 By Product specifications and features

6.3.2 Pricing

6.4 Strategic Initiatives

6.4.1 Marketing and promotional activities

6.4.2 Distribution and Supply Chain Strategies

6.4.3 Expansion Plans and New Product Launches

6.4.4 Strategic partnerships and collaborations

6.5 Technological Advancements

6.6 Market Positioning and Branding

7. Battery Metals Market Segmentation, By Type

7.1 Chapter Overview

7.2 Lithium

        7.2.1 Lithium Trends Analysis (2020-2032)

7.2.2 Lithium Market Size Estimates and Forecasts to 2032 (USD Billion)

7.3 Nickel

       7.3.1 Nickel Market Trends Analysis (2020-2032)

       7.3.2 Nickel Market Size Estimates and Forecasts to 2032 (USD Billion)

7.4 Cobalt

        7.4.1 Cobalt Trends Analysis (2020-2032)

7.4.2 Cobalt Market Size Estimates and Forecasts to 2032 (USD Billion)

7.5 Others

       7.5.1 Others Market Trends Analysis (2020-2032)

       7.5.2 Others Market Size Estimates and Forecasts to 2032 (USD Billion)

8. Battery Metals Market Segmentation, by Application

8.1 Chapter Overview

8.2 Electric Vehicles

        8.2.1 Electric Vehicles Market Trends Analysis (2020-2032)

8.2.2 Electric Vehicles Market Size Estimates and Forecasts to 2032 (USD Billion)

8.3 Consumer Electronics

      8.3.1 Consumer Electronics Market Trends Analysis (2020-2032)

      8.3.2 Consumer Electronics Market Size Estimates and Forecasts to 2032 (USD Billion)

8.4 Starter, Lighting, & Ignition (SLI)

        8.4.1 Starter, Lighting, & Ignition (SLI) Market Trends Analysis (2020-2032)

8.4.2 Starter, Lighting, & Ignition (SLI) Market Size Estimates and Forecasts to 2032 (USD Billion)

8.5 Energy Storage Systems

      8.5.1 Energy Storage Systems Market Trends Analysis (2020-2032)

      8.5.2 Energy Storage Systems Market Size Estimates and Forecasts to 2032 (USD Billion)

8.6 Others

        8.6.1 Others Market Trends Analysis (2020-2032)

8.6.2 Others Market Size Estimates and Forecasts to 2032 (USD Billion

9. Regional Analysis

9.1 Chapter Overview

9.2 North America

9.2.1 Trends Analysis

9.2.2 North America Battery Metals Market Estimates and Forecasts, by Country (2020-2032) (USD Billion)

9.2.3 North America Battery Metals Market Estimates and Forecasts, By Type (2020-2032) (USD Billion) 

9.2.4 North America Battery Metals Market Estimates and Forecasts, by Application (2020-2032) (USD Billion)

9.2.5 USA

9.2.5.1 USA Battery Metals Market Estimates and Forecasts, By Type (2020-2032) (USD Billion)

9.2.5.2 USA Battery Metals Market Estimates and Forecasts, by Application (2020-2032) (USD Billion)

9.2.6 Canada

9.2.6.1 Canada Battery Metals Market Estimates and Forecasts, By Type (2020-2032) (USD Billion)

9.2.6.2 Canada Battery Metals Market Estimates and Forecasts, by Application (2020-2032) (USD Billion)

9.2.7 Mexico

9.2.7.1 Mexico Battery Metals Market Estimates and Forecasts, By Type (2020-2032) (USD Billion)

9.2.7.2 Mexico Battery Metals Market Estimates and Forecasts, by Application (2020-2032) (USD Billion)

9.3 Europe

9.3.1 Eastern Europe

9.3.1.1 Trends Analysis

9.3.1.2 Eastern Europe Battery Metals Market Estimates and Forecasts, by Country (2020-2032) (USD Billion)

9.3.1.3 Eastern Europe Battery Metals Market Estimates and Forecasts, By Type (2020-2032) (USD Billion) 

9.3.1.4 Eastern Europe Battery Metals Market Estimates and Forecasts, by Application (2020-2032) (USD Billion)

9.3.1.5 Poland

9.3.1.5.1 Poland Battery Metals Market Estimates and Forecasts, By Type (2020-2032) (USD Billion)

9.3.1.5.2 Poland Battery Metals Market Estimates and Forecasts, by Application (2020-2032) (USD Billion)

9.3.1.6 Romania

9.3.1.6.1 Romania Battery Metals Market Estimates and Forecasts, By Type (2020-2032) (USD Billion)

9.3.1.6.2 Romania Battery Metals Market Estimates and Forecasts, by Application (2020-2032) (USD Billion)

9.3.1.7 Hungary

9.3.1.7.1 Hungary Battery Metals Market Estimates and Forecasts, By Type (2020-2032) (USD Billion)

9.3.1.7.2 Hungary Battery Metals Market Estimates and Forecasts, by Application (2020-2032) (USD Billion)

9.3.1.8 Turkey

9.3.1.8.1 Turkey Battery Metals Market Estimates and Forecasts, By Type (2020-2032) (USD Billion)

9.3.1.8.2 Turkey Battery Metals Market Estimates and Forecasts, by Application (2020-2032) (USD Billion)

9.3.1.9 Rest of Eastern Europe

9.3.1.9.1 Rest of Eastern Europe Battery Metals Market Estimates and Forecasts, By Type (2020-2032) (USD Billion)

9.3.1.9.2 Rest of Eastern Europe Battery Metals Market Estimates and Forecasts, by Application (2020-2032) (USD Billion)

9.3.2 Western Europe

9.3.2.1 Trends Analysis

9.3.2.2 Western Europe Battery Metals Market Estimates and Forecasts, by Country (2020-2032) (USD Billion)

9.3.2.3 Western Europe Battery Metals Market Estimates and Forecasts, By Type (2020-2032) (USD Billion) 

9.3.2.4 Western Europe Battery Metals Market Estimates and Forecasts, by Application (2020-2032) (USD Billion)

9.3.2.5 Germany

9.3.2.5.1 Germany Battery Metals Market Estimates and Forecasts, By Type (2020-2032) (USD Billion)

9.3.2.5.2 Germany Battery Metals Market Estimates and Forecasts, by Application (2020-2032) (USD Billion)

9.3.2.6 France

9.3.2.6.1 France Battery Metals Market Estimates and Forecasts, By Type (2020-2032) (USD Billion)

9.3.2.6.2 France Battery Metals Market Estimates and Forecasts, by Application (2020-2032) (USD Billion)

9.3.2.7 UK

9.3.2.7.1 UK Battery Metals Market Estimates and Forecasts, By Type (2020-2032) (USD Billion)

9.3.2.7.2 UK Battery Metals Market Estimates and Forecasts, by Application (2020-2032) (USD Billion)

9.3.2.8 Italy

9.3.2.8.1 Italy Battery Metals Market Estimates and Forecasts, By Type (2020-2032) (USD Billion)

9.3.2.8.2 Italy Battery Metals Market Estimates and Forecasts, by Application (2020-2032) (USD Billion)

9.3.2.9 Spain

9.3.2.9.1 Spain Battery Metals Market Estimates and Forecasts, By Type (2020-2032) (USD Billion)

9.3.2.9.2 Spain Battery Metals Market Estimates and Forecasts, by Application (2020-2032) (USD Billion)

9.3.2.10 Netherlands

9.3.2.10.1 Netherlands Battery Metals Market Estimates and Forecasts, By Type (2020-2032) (USD Billion)

9.3.2.10.2 Netherlands Battery Metals Market Estimates and Forecasts, by Application (2020-2032) (USD Billion)

9.3.2.11 Switzerland

9.3.2.11.1 Switzerland Battery Metals Market Estimates and Forecasts, By Type (2020-2032) (USD Billion)

9.3.2.11.2 Switzerland Battery Metals Market Estimates and Forecasts, by Application (2020-2032) (USD Billion)

9.3.2.12 Austria

9.3.2.12.1 Austria Battery Metals Market Estimates and Forecasts, By Type (2020-2032) (USD Billion)

9.3.2.12.2 Austria Battery Metals Market Estimates and Forecasts, by Application (2020-2032) (USD Billion)

9.3.2.13 Rest of Western Europe

9.3.2.13.1 Rest of Western Europe Battery Metals Market Estimates and Forecasts, By Type (2020-2032) (USD Billion)

9.3.2.13.2 Rest of Western Europe Battery Metals Market Estimates and Forecasts, by Application (2020-2032) (USD Billion)

9.4 Asia Pacific

9.4.1 Trends Analysis

9.4.2 Asia Pacific Battery Metals Market Estimates and Forecasts, by Country (2020-2032) (USD Billion)

9.4.3 Asia Pacific Battery Metals Market Estimates and Forecasts, By Type (2020-2032) (USD Billion) 

9.4.4 Asia Pacific Battery Metals Market Estimates and Forecasts, by Application (2020-2032) (USD Billion)

9.4.5 China

9.4.5.1 China Battery Metals Market Estimates and Forecasts, By Type (2020-2032) (USD Billion)

9.4.5.2 China Battery Metals Market Estimates and Forecasts, by Application (2020-2032) (USD Billion)

9.4.6 India

9.4.5.1 India Battery Metals Market Estimates and Forecasts, By Type (2020-2032) (USD Billion)

9.4.5.2 India Battery Metals Market Estimates and Forecasts, by Application (2020-2032) (USD Billion)

9.4.5 Japan

9.4.5.1 Japan Battery Metals Market Estimates and Forecasts, By Type (2020-2032) (USD Billion)

9.4.5.2 Japan Battery Metals Market Estimates and Forecasts, by Application (2020-2032) (USD Billion)

9.4.6 South Korea

9.4.6.1 South Korea Battery Metals Market Estimates and Forecasts, By Type (2020-2032) (USD Billion)

9.4.6.2 South Korea Battery Metals Market Estimates and Forecasts, by Application (2020-2032) (USD Billion)

9.4.7 Vietnam

9.4.7.1 Vietnam Battery Metals Market Estimates and Forecasts, By Type (2020-2032) (USD Billion)

9.2.7.2 Vietnam Battery Metals Market Estimates and Forecasts, by Application (2020-2032) (USD Billion)

9.4.8 Singapore

9.4.8.1 Singapore Battery Metals Market Estimates and Forecasts, By Type (2020-2032) (USD Billion)

9.4.8.2 Singapore Battery Metals Market Estimates and Forecasts, by Application (2020-2032) (USD Billion)

9.4.9 Australia

9.4.9.1 Australia Battery Metals Market Estimates and Forecasts, By Type (2020-2032) (USD Billion)

9.4.9.2 Australia Battery Metals Market Estimates and Forecasts, by Application (2020-2032) (USD Billion)

9.4.10 Rest of Asia Pacific

9.4.10.1 Rest of Asia Pacific Battery Metals Market Estimates and Forecasts, By Type (2020-2032) (USD Billion)

9.4.10.2 Rest of Asia Pacific Battery Metals Market Estimates and Forecasts, by Application (2020-2032) (USD Billion)

9.5 Middle East and Africa

9.5.1 Middle East

9.5.1.1 Trends Analysis

9.5.1.2 Middle East Battery Metals Market Estimates and Forecasts, by Country (2020-2032) (USD Billion)

9.5.1.3 Middle East Battery Metals Market Estimates and Forecasts, By Type (2020-2032) (USD Billion) 

9.5.1.4 Middle East Battery Metals Market Estimates and Forecasts, by Application (2020-2032) (USD Billion)

9.5.1.5 UAE

9.5.1.5.1 UAE Battery Metals Market Estimates and Forecasts, By Type (2020-2032) (USD Billion)

9.5.1.5.2 UAE Battery Metals Market Estimates and Forecasts, by Application (2020-2032) (USD Billion)

9.5.1.6 Egypt

9.5.1.6.1 Egypt Battery Metals Market Estimates and Forecasts, By Type (2020-2032) (USD Billion)

9.5.1.6.2 Egypt Battery Metals Market Estimates and Forecasts, by Application (2020-2032) (USD Billion)

9.5.1.7 Saudi Arabia

9.5.1.7.1 Saudi Arabia Battery Metals Market Estimates and Forecasts, By Type (2020-2032) (USD Billion)

9.5.1.7.2 Saudi Arabia Battery Metals Market Estimates and Forecasts, by Application (2020-2032) (USD Billion)

9.5.1.8 Qatar

9.5.1.8.1 Qatar Battery Metals Market Estimates and Forecasts, By Type (2020-2032) (USD Billion)

9.5.1.8.2 Qatar Battery Metals Market Estimates and Forecasts, by Application (2020-2032) (USD Billion)

9.5.1.9 Rest of Middle East

9.5.1.9.1 Rest of Middle East Battery Metals Market Estimates and Forecasts, By Type (2020-2032) (USD Billion)

9.5.1.9.2 Rest of Middle East Battery Metals Market Estimates and Forecasts, by Application (2020-2032) (USD Billion)

9.5.2 Africa

9.5.2.1 Trends Analysis

9.5.2.2 Africa Battery Metals Market Estimates and Forecasts, by Country (2020-2032) (USD Billion)

9.5.2.3 Africa Battery Metals Market Estimates and Forecasts, By Type (2020-2032) (USD Billion) 

9.5.2.4 Africa Battery Metals Market Estimates and Forecasts, by Application (2020-2032) (USD Billion)

9.5.2.5 South Africa

9.5.2.5.1 South Africa Battery Metals Market Estimates and Forecasts, By Type (2020-2032) (USD Billion)

9.5.2.5.2 South Africa Battery Metals Market Estimates and Forecasts, by Application (2020-2032) (USD Billion)

9.5.2.6 Nigeria

9.5.2.6.1 Nigeria Battery Metals Market Estimates and Forecasts, By Type (2020-2032) (USD Billion)

9.5.2.6.2 Nigeria Battery Metals Market Estimates and Forecasts, by Application (2020-2032) (USD Billion)

9.6 Latin America

9.6.1 Trends Analysis

9.6.2 Latin America Battery Metals Market Estimates and Forecasts, by Country (2020-2032) (USD Billion)

9.6.3 Latin America Battery Metals Market Estimates and Forecasts, By Type (2020-2032) (USD Billion) 

9.6.4 Latin America Battery Metals Market Estimates and Forecasts, by Application (2020-2032) (USD Billion)

9.6.5 Brazil

9.6.5.1 Brazil Battery Metals Market Estimates and Forecasts, By Type (2020-2032) (USD Billion)

9.6.5.2 Brazil Battery Metals Market Estimates and Forecasts, by Application (2020-2032) (USD Billion)

9.6.6 Argentina

9.6.6.1 Argentina Battery Metals Market Estimates and Forecasts, By Type (2020-2032) (USD Billion)

9.6.6.2 Argentina Battery Metals Market Estimates and Forecasts, by Application (2020-2032) (USD Billion)

9.6.7 Colombia

9.6.7.1 Colombia Battery Metals Market Estimates and Forecasts, By Type (2020-2032) (USD Billion)

9.6.7.2 Colombia Battery Metals Market Estimates and Forecasts, by Application (2020-2032) (USD Billion)

9.6.8 Rest of Latin America

9.6.8.1 Rest of Latin America Battery Metals Market Estimates and Forecasts, By Type (2020-2032) (USD Billion)

9.6.8.2 Rest of Latin America Battery Metals Market Estimates and Forecasts, by Application (2020-2032) (USD Billion)

10. Company Profiles

           10.1     3M

                          10.1.1 Company Overview

10.1.2 Financial

10.1.3 By Product / Services Offered

10.1.4 SWOT Analysis

           10.2      BASF SE

                           10.2.1 Company Overview

10.2.2 Financial

10.2.3 By Product / Services Offered

10.2.4 SWOT Analysis

10.3 DowDuPont

              10.3.1 Company Overview

10.3.2 Financial

10.3.3 By Product / Services Offered

10.3.4 SWOT Analysis

10.4 Entek

             10.4.1 Company Overview

10.4.2 Financial

10.4.3 By Product / Services Offered

10.4.4 SWOT Analysis

10.5 Hitachi Chemical Co. Ltd

             10.5.1 Company Overview

10.5.2 Financial

10.5.3 By Product / Services Offered

10.5.4 SWOT Analysis

10.6 Mitsubishi Chemical Corporation

             10.6.1 Company Overview

10.6.2 Financial

10.6.3 By Product / Services Offered

10.6.4 SWOT Analysis

10.7 Nippon Denko Co. Ltd

             10.7.1 Company Overview

10.7.2 Financial

10.7.3 By Product / Services Offered

10.7.4 SWOT Analysis

10.8 Solvay

             10.8.1 Company Overview

10.8.2 Financial

10.8.3 By Product / Services Offered

10.8.4 SWOT Analysis

10.9 Celgard LLC

             10.9.1 Company Overview

10.9.2 Financial

10.9.3 By Product / Services Offered

10.9.4 SWOT Analysis

10.10 Ecopro

             10.10.1 Company Overview

10.10.2 Financial

10.10.3 By Product / Services Offered

10.10.4 SWOT Analysis

11. Use Cases and Best Practices

12. Conclusion

An accurate research report requires proper strategizing as well as implementation. There are multiple factors involved in the completion of good and accurate research report and selecting the best methodology to compete the research is the toughest part. Since the research reports we provide play a crucial role in any company’s decision-making process, therefore we at SNS Insider always believe that we should choose the best method which gives us results closer to reality. This allows us to reach at a stage wherein we can provide our clients best and accurate investment to output ratio.

Each report that we prepare takes a timeframe of 350-400 business hours for production. Starting from the selection of titles through a couple of in-depth brain storming session to the final QC process before uploading our titles on our website we dedicate around 350 working hours. The titles are selected based on their current market cap and the foreseen CAGR and growth.


The 5 steps process:

Step 1: Secondary Research:

Secondary Research or Desk Research is as the name suggests is a research process wherein, we collect data through the readily available information. In this process we use various paid and unpaid databases which our team has access to and gather data through the same. This includes examining of listed companies’ annual reports, Journals, SEC filling etc. Apart from this our team has access to various associations across the globe across different industries. Lastly, we have exchange relationships with various university as well as individual libraries.

Secondary Research

Step 2: Primary Research

When we talk about primary research, it is a type of study in which the researchers collect relevant data samples directly, rather than relying on previously collected data.  This type of research is focused on gaining content specific facts that can be sued to solve specific problems. Since the collected data is fresh and first hand therefore it makes the study more accurate and genuine.

We at SNS Insider have divided Primary Research into 2 parts.

Part 1 wherein we interview the KOLs of major players as well as the upcoming ones across various geographic regions. This allows us to have their view over the market scenario and acts as an important tool to come closer to the accurate market numbers. As many as 45 paid and unpaid primary interviews are taken from both the demand and supply side of the industry to make sure we land at an accurate judgement and analysis of the market.

This step involves the triangulation of data wherein our team analyses the interview transcripts, online survey responses and observation of on filed participants. The below mentioned chart should give a better understanding of the part 1 of the primary interview.

Primary Research

Part 2: In this part of primary research the data collected via secondary research and the part 1 of the primary research is validated with the interviews from individual consultants and subject matter experts.

Consultants are those set of people who have at least 12 years of experience and expertise within the industry whereas Subject Matter Experts are those with at least 15 years of experience behind their back within the same space. The data with the help of two main processes i.e., FGDs (Focused Group Discussions) and IDs (Individual Discussions). This gives us a 3rd party nonbiased primary view of the market scenario making it a more dependable one while collation of the data pointers.

Step 3: Data Bank Validation

Once all the information is collected via primary and secondary sources, we run that information for data validation. At our intelligence centre our research heads track a lot of information related to the market which includes the quarterly reports, the daily stock prices, and other relevant information. Our data bank server gets updated every fortnight and that is how the information which we collected using our primary and secondary information is revalidated in real time.

Data Bank Validation

Step 4: QA/QC Process

After all the data collection and validation our team does a final level of quality check and quality assurance to get rid of any unwanted or undesired mistakes. This might include but not limited to getting rid of the any typos, duplication of numbers or missing of any important information. The people involved in this process include technical content writers, research heads and graphics people. Once this process is completed the title gets uploader on our platform for our clients to read it.

Step 5: Final QC/QA Process:

This is the last process and comes when the client has ordered the study. In this process a final QA/QC is done before the study is emailed to the client. Since we believe in giving our clients a good experience of our research studies, therefore, to make sure that we do not lack at our end in any way humanly possible we do a final round of quality check and then dispatch the study to the client.

Key Segments

By Type

  • Lithium

  • Nickel

  • Cobalt

  • Others

By Application

  • Electric Vehicles

  • Consumer Electronics

  • Starter, Lighting, & Ignition (SLI)

  • Energy Storage Systems

  • Others

Request for Segment Customization as per your Business Requirement: Segment Customization Request

Regional Coverage:

North America

  • US

  • Canada

  • Mexico

Europe

  • Eastern Europe

    • Poland

    • Romania

    • Hungary

    • Turkey

    • Rest of Eastern Europe

  • Western Europe

    • Germany

    • France

    • UK

    • Italy

    • Spain

    • Netherlands

    • Switzerland

    • Austria

    • Rest of Western Europe

Asia Pacific

  • China

  • India

  • Japan

  • South Korea

  • Vietnam

  • Singapore

  • Australia

  • Rest of Asia Pacific

Middle East & Africa

  • Middle East

    • UAE

    • Egypt

    • Saudi Arabia

    • Qatar

    • Rest of Middle East

  • Africa

    • Nigeria

    • South Africa

    • Rest of Africa

  • Latin America

  • Brazil

  • Argentina

  • Colombia

  • Rest of Latin America

Request for Country Level Research Report: Country Level Customization Request

Available Customization

With the given market data, SNS Insider offers customization as per the company’s specific needs. The following customization options are available for the report:

  • Product Analysis

  • Criss-Cross segment analysis (e.g. Product X Application)

  • Product Matrix which gives a detailed comparison of product portfolio of each company

  • Geographic Analysis

  • Additional countries in any of the regions

  • Company Information

  • Detailed analysis and profiling of additional market players (Up to five)


  •            5000 (33% Discount)


  •            8950 (40% Discount)


  •            3050 (23% Discount)

Start a Conversation

Hi! Click one of our member below to chat on Phone