B2B E-Commerce Market Report Scope & Overview:
The B2B E-Commerce Market was valued at USD 23219.38 billion in 2024 and is expected to reach USD 82,881.41 billion by 2032, growing at a CAGR of 17.24% from 2025-2032. The report provides insights into logistics & supply chain, financial & investment trends, customer behavior & experience, technology adoption, and transaction & order patterns.

Get more information on B2B E-Commerce Market - Request Sample Report
Markets are driven by the need for digital transformation, automation, and increased demand for the smoothness of procurement processes. Companies apply AI, cloud platforms, and data analytics to optimize business operations with engaged customer activities.

B2B E-Commerce Market Size and Forecast:
-
Market Size in 2024: USD 23,219.38 Billion
-
Market Size by 2032: USD 82,881.41 Billion
-
CAGR: 17.24% from 2025 to 2032
-
Base Year: 2024
-
Forecast Period: 2025–2032
-
Historical Data: 2021–2023
B2B E-Commerce Market Highlights:
-
Businesses are accelerating digital adoption to modernize procurement, enhance efficiency, reduce costs, and streamline B2B transactions.
-
AI and automation enable real-time procurement tracking, data-driven decision-making, and efficient supplier interaction.
-
Cloud-based solutions integrate e-commerce platforms with ERP and CRM systems, improving inventory management and workflows.
-
AI-powered tools offer personalized product recommendations, dynamic pricing, and predictive analytics for optimized operations.
-
Self-service portals empower buyers to manage orders and purchasing cycles independently, increasing agility.
-
Legacy system challenges create integration issues, operational bottlenecks, high costs, and data management complexities, slowing adoption.
-
AI-driven solutions, including chatbots and automated support, enhance customer engagement and improve response times.
B2B E-Commerce Market Drivers:
-
Businesses Accelerate Digital Adoption to Streamline Procurement, Enhance Efficiency, Reduce Costs, and Transform B2B Transactions with AI and Automation.
Businesses are using digital platforms to modernize procurement, increase operational efficiency, and save on costs. Automated systems, which track procurements in real time, replace traditional methods with data-driven decision-making and efficient supplier interaction. Cloud-based solutions allow companies to integrate e-commerce platforms with ERP and CRM systems, providing better inventory management and streamlined workflows. Additionally, AI-powered tools enhance personalization, such as providing recommendations on the product to be bought and dynamic pricing models. With more emphasis being put on AI, Microsoft and IMDA agreed in November 2023 to upskill 2,000 SMEs by 2025, boosting the AI and data capabilities of SMEs. The shift toward self-service portals is becoming more effective as buyers compare options and then manage orders for themselves to manage purchasing cycles optimally. As companies speed ahead toward agility and scaling, B2B e-commerce adoption is increased and revolutions in transactions and supply chains.
B2B E-Commerce Market Restraints:
-
Legacy System Challenges Slow B2B E-Commerce Adoption by Creating Integration Issues, Operational Bottlenecks, High Costs, and Data Management Complexities.
Many large organizations that have implemented modern e-commerce solutions face challenging difficulties in integrating them with existing ERP, CRM, and supply chain systems. Legacy infrastructure also often lacks flexibility in supporting real-time data synchronization, automated workflows, and smooth transaction processing, which creates inefficiencies in the process. Integration between traditional and digital also causes operational bottlenecks, increases implementation costs, and creates prolonged transition periods.
Furthermore, companies using old software may not be able to integrate their data management, which will not allow them to take full advantage of advanced analytics and AI-driven insights. This will require a lot of investment in system upgrades, middleware solutions, and IT expertise to overcome these integration challenges. Without seamless connectivity, companies may experience delays in digital transformation, slowing the overall growth of B2B e-commerce adoption.
B2B E-Commerce Market Opportunities:
-
AI-Powered Personalization Enhances B2B E-Commerce with Smart Recommendations, Dynamic Pricing, Predictive Analytics, and Automated Customer Engagement.
Businesses are increasingly leveraging AI and machine learning to deliver personalized experiences, optimize pricing strategies, and enhance customer engagement. AI-powered algorithms analyze vast amounts of data to provide tailored product recommendations based on purchase history, industry trends, and customer behavior. Dynamic pricing models allow businesses to adjust rates in real time, ensuring a competitive advantage and improved profit margins. Predictive analytics further streamline procurement by forecasting demand, reducing inventory costs, and minimizing supply chain disruptions. In November 2024, Shopify reported a 26% revenue increase, attributing the growth to AI-powered tools like the Sidekick assistant, which aids merchants with sales reports and task automation. Additionally, AI-driven chatbots and automated support systems enhance customer interactions, providing instant assistance and improving response times.
B2B E-Commerce Market Segment Analysis:
By Deployment
The Intermediary-oriented segment dominated the B2B e-commerce market in 2024 with a 60% revenue share due to its ability to streamline transactions, offer diverse product selections, and facilitate bulk purchasing. The Supplier-oriented segment is expected to grow at the fastest CAGR of 18.87% from 2024-2032, driven by increasing direct supplier-to-business transactions, cost advantages, and the growing preference for eliminating middlemen to enhance efficiency and profit margins.

By Product Category
Home & Kitchen dominated the B2B e-commerce market in 2024 with a 22% revenue share due to high consumer demand, bulk procurement by retailers, and increasing online wholesale transactions. The Clothing segment is expected to grow at the fastest CAGR of 22.18% from 2024-2032, driven by rising demand for fashion products, rapid digitalization in the apparel industry, and the expansion of online B2B marketplaces catering to retailers and distributors.
By Channel
The Marketplace Sales segment dominated the B2B e-commerce market in 2024 with a 61% revenue share due to its wide product variety, competitive pricing, and ability to connect multiple buyers and sellers efficiently. The Direct Sales segment is expected to grow at the fastest CAGR of 18.04% from 2024-2032, driven by businesses seeking greater control over pricing, customer relationships, and streamlined supply chains to enhance profitability and operational efficiency.
B2B E-Commerce Market Regional Analysis:
North America B2B E-Commerce Market Trends:
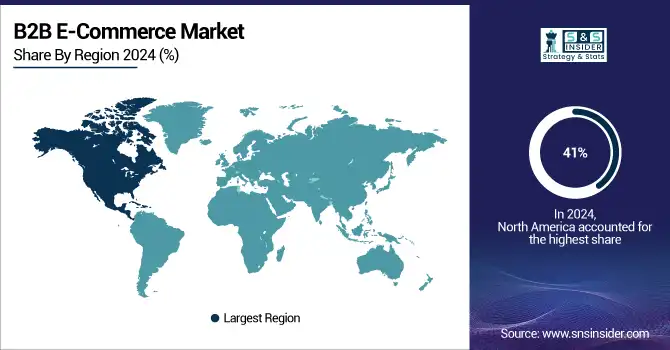
In 2024, North America dominated the B2B e-commerce market with a 41% revenue share, driven by advanced digital infrastructure, high internet penetration, and widespread adoption of automation in procurement. Established enterprises increasingly invested in AI-driven platforms, enhancing efficiency and streamlining supply chains. Additionally, strong regulatory frameworks and a mature e-commerce ecosystem enabled seamless digital transactions, reinforcing the region’s leadership in B2B e-commerce.
Get Customized Report as per Your Business Requirement - Enquiry Now
Asia-Pacific B2B E-Commerce Market Trends:
Asia Pacific is expected to grow at the fastest CAGR of 19.13% from 2025 to 2032, fueled by rapid industrialization, increasing smartphone adoption, and a growing number of small and medium enterprises shifting to digital platforms. Government initiatives supporting digital transformation and cross-border trade expansion are further accelerating market growth. With rising demand for scalable, cost-effective e-commerce solutions, the region is poised for significant B2B e-commerce expansion.
Europe B2B E-Commerce Market Trends:
Europe is witnessing steady growth in B2B e-commerce, supported by robust digital infrastructure, high enterprise adoption of automated procurement, and a strong focus on cross-border trade within the EU. Countries such as Germany, the UK, and France are leading in digital transformation initiatives. Regulatory compliance, secure payment systems, and widespread use of AI-driven solutions are enhancing efficiency, driving seamless transactions, and strengthening the region’s position in the global B2B e-commerce landscape.
Latin America B2B E-Commerce Market Trends:
Latin America is gradually expanding its B2B e-commerce market, with Brazil, Mexico, and Argentina emerging as key players. Increasing smartphone penetration, digital payment adoption, and government support for online trade are driving growth. SMEs are increasingly leveraging cost-effective digital platforms, while large enterprises invest in AI and automation to improve supply chain efficiency, contributing to a rising trend in online B2B transactions.
Middle East & Africa B2B E-Commerce Market Trends:
The Middle East and Africa region is experiencing growing B2B e-commerce adoption, led by countries like the UAE, Saudi Arabia, and South Africa. Investments in digital infrastructure, rising internet penetration, and supportive government policies are fueling online trade. Businesses are increasingly adopting scalable, AI-powered platforms and automated procurement solutions, enhancing efficiency and accelerating the region’s integration into the global B2B e-commerce ecosystem.
B2B E-Commerce Market Key Players:
-
Alibaba (Industrial Machinery, Apparel)
-
Amazon (Office Supplies, Electronics)
-
IndiaMART (Industrial Supplies, Medical Equipment)
-
Shopify (E-commerce Platform, Payment Solutions)
-
BigCommerce (E-commerce Platform, B2B Edition)
-
Adobe Commerce (E-commerce Platform, Cloud Solutions)
-
WooCommerce (E-commerce Plugin, Payment Integrations)
-
Commercetools (E-commerce Platform, API Services)
-
Ferguson (Plumbing Supplies, HVAC Equipment)
-
Flipkart (Electronics, Home Appliances)
-
Grainger (Industrial Supplies, Safety Products)
-
TradeIndia (Industrial Supplies, Handicrafts)
-
DHgate.com (Consumer Electronics, Fashion Accessories)
-
Ninjacart (Fresh Produce, Agricultural Products)
-
OpenCart (E-commerce Platform, Extensions)
-
Pepperi (Sales Automation Software, Mobile CRM)
-
Quill Corp (Office Supplies, Furniture)
-
Udaan (Apparel, Electronics)
-
Berlin Packaging (Glass Bottles, Plastic Containers)
-
CS-Cart (E-commerce Platform, Multi-Vendor Marketplace)
-
Curbell Plastics, Inc. (Plastic Sheets, Rods)
-
eWorldTrade (Textiles, Food & Beverage)
-
Autoglobaltrade (Automobiles, Vehicle Parts)
B2B E-Commerce Market Competitive Landscape:
Alibaba.com, established in 1999, is a leading global B2B e-commerce platform connecting suppliers and buyers worldwide. The company offers digital trade solutions, including wholesale marketplaces, cloud computing, and logistics services. Alibaba.com empowers businesses of all sizes to engage in international trade efficiently and cost-effectively.
-
In June 2024, Alibaba.com announced a collaboration with UEFA EURO 2024™, becoming the official B2B e-commerce partner in the U.S. and China. This partnership aims to provide small and medium-sized enterprises (SMEs) with opportunities to leverage increased demand during the tournament.
Amazon, established in 1994, is a global e-commerce and technology giant offering online retail, cloud computing, digital streaming, and AI-driven services. The company provides platforms for B2C and B2B transactions, logistics solutions, and innovative technology, enabling businesses and consumers worldwide to access products and services efficiently.
-
In June 2024, Amazon Business introduced new technologies, including the Amazon Business App Center, to enhance procurement efficiency for business customers. These innovations aim to provide a more convenient and personalized buying experience, helping businesses save time and reduce costs.
Flipkart, established in 2007, is a leading Indian e-commerce platform offering a wide range of products, including electronics, fashion, and home goods. The company provides B2C and B2B solutions, efficient logistics, and digital payment options, driving online retail growth and transforming the e-commerce landscape in India.
-
In October 2024, Flipkart reaffirmed its commitment to strengthening the e-commerce ecosystem by empowering MSMEs and artisans, fostering B2B growth, and enhancing market access for small businesses.
| Report Attributes | Details |
|---|---|
| Market Size in 2024 | USD 23219.38 Billion |
| Market Size by 2032 | USD 82,881.41 Billion |
| CAGR | CAGR of 17.24% From 2025 to 2032 |
| Base Year | 2024 |
| Forecast Period | 2025-2032 |
| Historical Data | 2021-2023 |
| Report Scope & Coverage | Market Size, Segments Analysis, Competitive Landscape, Regional Analysis, DROC & SWOT Analysis, Forecast Outlook |
| Key Segments | • By Product Category (Home & Kitchen, Consumer Electronics, Industrial & Science, Healthcare, Clothing, Beauty & Personal Care, Sports Apparel, Books & Stationery, Automotive, Others) • By Deployment (Supplier-oriented, Buyer-oriented, Intermediary-oriented) • By Channel (Direct Sales, Marketplace Sales) |
| Regional Analysis/Coverage | North America (US, Canada, Mexico), Europe (Eastern Europe [Poland, Romania, Hungary, Turkey, Rest of Eastern Europe] Western Europe] Germany, France, UK, Italy, Spain, Netherlands, Switzerland, Austria, Rest of Western Europe]), Asia Pacific (China, India, Japan, South Korea, Vietnam, Singapore, Australia, Rest of Asia Pacific), Middle East & Africa (Middle East [UAE, Egypt, Saudi Arabia, Qatar, Rest of Middle East], Africa [Nigeria, South Africa, Rest of Africa], Latin America (Brazil, Argentina, Colombia, Rest of Latin America) |
| Company Profiles | Alibaba, Amazon, IndiaMART, Shopify, BigCommerce, Adobe Commerce, WooCommerce, Commercetools, Ferguson, Flipkart, Grainger, TradeIndia, DHgate.com, Ninjacart, OpenCart, Pepperi, Quill Corp, Udaan, Berlin Packaging, CS-Cart, Curbell Plastics, Inc., eWorldTrade, Autoglobaltrade. |
