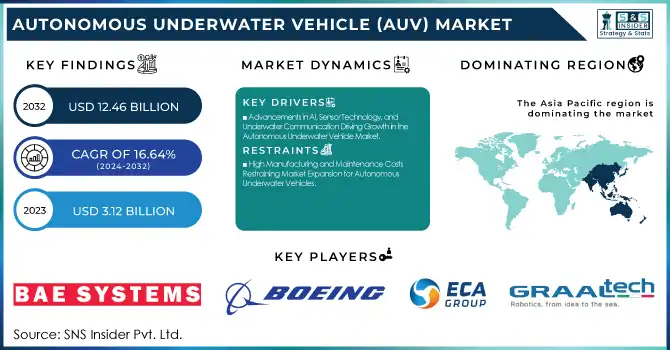
The Autonomous Underwater Vehicle (AUV) Market Size was valued at USD 3.12 Billion in 2023 and is expected to reach USD 12.46 Billion by 2032 and grow at a CAGR of 16.64% over the forecast period 2024-2032. The Autonomous Underwater Vehicle (AUV) Market is growing rapidly, driven by advancements in AI, navigation, and underwater communication. AUVs are essential for defense, oil & gas, oceanography, and environmental monitoring, supporting mine countermeasures, surveillance, and subsea inspections.
To Get more information on Autonomous Underwater Vehicle (AUV) Market - Request Free Sample Report
Technological innovations in collision avoidance, imaging, and propulsion enhance efficiency, while government investments in defense and marine research fuel demand. AUVs aid sustainability efforts, deep-sea exploration, and climate studies. With increasing public and private investments, advancements in battery technology and wireless communication are set to drive market expansion, boosting demand for cost-effective, high-performance AUVs in the coming years.
Advancements in AI, Sensor Technology, and Underwater Communication Driving Growth in the Autonomous Underwater Vehicle Market
The Autonomous Underwater Vehicle (AUV) market is experiencing significant growth due to advancements in artificial intelligence (AI), sensor technology, and underwater communication. AI-driven autonomy enhances real-time decision-making, improving AUV efficiency for applications such as defense surveillance, subsea inspections, and oceanographic research. Cutting-edge sensors, including high-resolution sonar and inertial navigation systems, improve data collection and operational accuracy. Meanwhile, wireless underwater communication technologies enable seamless data transmission, reducing dependency on costly tethered systems. These innovations make AUVs more effective in deep-sea exploration, oil & gas pipeline monitoring, and naval operations. As AI and sensor capabilities advance further, the market is expected to witness wider adoption across industries, reinforcing demand for smart, autonomous underwater vehicles.
Restraint:
High Manufacturing and Maintenance Costs Restraining Market Expansion for Autonomous Underwater Vehicles
Despite growing demand, high manufacturing and maintenance costs pose a significant challenge to the widespread adoption of AUVs. Advanced AUVs require cutting-edge technologies such as AI-powered navigation, collision avoidance systems, and high-precision sensors, which drive up production costs. Additionally, maintenance expenses, including battery replacements, pressure-resistant materials, and software updates, contribute to overall operational costs. Many industries, particularly in emerging markets, hesitate to invest in AUVs due to these financial constraints. Smaller organizations and research institutes often struggle with the high upfront investment required to deploy AUV technology. Furthermore, repairs and servicing in deep-sea environments present logistical and financial challenges. These cost-related barriers limit market expansion, especially in budget-sensitive sectors, slowing adoption rates. To overcome this restraint, manufacturers must focus on cost-efficient production methods, improved battery life, and modular AUV designs that reduce long-term maintenance costs and enhance affordability.
Increasing Demand for AUVs in Climate Change Research and Marine Biodiversity Studies Presents Growth Opportunities
The rising focus on climate change research and marine biodiversity conservation is creating new growth opportunities for Autonomous Underwater Vehicles (AUVs). Governments, research institutions, and environmental agencies are investing in AUVs for ocean monitoring, deep-sea exploration, and ecosystem assessments. AUVs enable researchers to track ocean temperature changes, study coral reef health, and observe deep-sea species without human intervention. With growing concerns over rising sea levels, ocean acidification, and biodiversity loss, AUVs offer a sustainable and efficient solution for long-term environmental monitoring. Additionally, advancements in eco-friendly propulsion systems and energy-efficient AUV designs support sustainability initiatives. The increasing availability of government funding and grants for marine research further accelerates adoption. As climate studies gain prominence, AUV manufacturers have a unique opportunity to develop specialized models tailored for environmental monitoring, thereby expanding their market presence in the research and sustainability sectors.
The complexity of deep-sea navigation and underwater communication remains a major technical challenge for Autonomous Underwater Vehicles (AUVs). Unlike aerial or land-based autonomous systems, AUVs operate in harsh underwater environments where GPS signals are unavailable, requiring advanced inertial navigation systems and acoustic positioning technologies. However, these systems struggle with accuracy over long distances, leading to potential mission failures or deviations. Additionally, underwater communication is highly restricted due to signal absorption, interference, and limited bandwidth, making real-time control and data transmission difficult. These constraints impact defense, oil & gas exploration, and scientific research applications, where precise navigation and reliable data retrieval are crucial. To address these challenges, manufacturers must innovate next-generation navigation algorithms, hybrid acoustic-optical communication systems, and AI-driven predictive analytics. Overcoming these limitations will be essential for unlocking the full potential of AUVs in deep-sea exploration and commercial applications.
By Payload Type
The Inertial Navigation System (INS) segment held the largest revenue share in the Autonomous Underwater Vehicle (AUV) market in 2023, driven by the increasing demand for accurate underwater positioning and navigation. Since GPS signals cannot penetrate underwater environments, AUVs rely on INS technology, which combines accelerometers, gyroscopes, and magnetometers to maintain precise navigation without external references. Leading companies are actively developing advanced INS solutions to enhance AUV capabilities. In 2023, Teledyne Marine introduced an upgraded version of its TSS Inertial Navigation System, improving real-time tracking for deep-sea operations. Similarly, Kongsberg Maritime launched a high-performance INS system for military and commercial AUV applications, enhancing long-endurance missions.
The Cameras segment is expected to grow at the highest CAGR during the forecast period, driven by increasing demand for high-resolution imaging in AUVs. Modern underwater missions require detailed visual data for inspections, surveillance, and environmental research, pushing manufacturers to develop cutting-edge imaging technologies. Companies are launching advanced underwater cameras with AI-powered image processing and enhanced low-light performance. In 2023, Sonardyne International introduced a new generation of compact, high-resolution underwater cameras tailored for AUV integration, enabling real-time oceanographic and security surveillance. Blue Robotics also released an upgraded low-light underwater camera, improving deep-sea exploration capabilities.
By Shape
The torpedo-shaped Autonomous Underwater Vehicle (AUV) segment held the largest revenue share in 2023, driven by its hydrodynamic efficiency, high-speed capability, and extended operational range. Torpedo-shaped AUVs are widely used in defense, oil & gas, and oceanographic research due to their ability to cover long distances with minimal energy consumption. Leading companies have introduced cutting-edge torpedo-style AUVs to enhance mission capabilities. In 2023, Boeing expanded its Echo Voyager series, launching an upgraded version with enhanced endurance and AI-driven navigation for military reconnaissance. Similarly, Kongsberg Maritime introduced an advanced HUGIN Endurance AUV, designed for deep-sea exploration and long-duration seabed mapping.
These developments are crucial for mine countermeasures, underwater surveillance, and subsea infrastructure inspections, where torpedo AUVs provide superior maneuverability and operational range. Additionally, integration with AI-based autonomy, improved propulsion systems, and advanced sonar imaging is making torpedo-shaped AUVs more versatile, reinforcing their dominance in the rapidly expanding global AUV market.
By Application
The defense segment held the largest revenue share in the Autonomous Underwater Vehicle (AUV) market in 2023, driven by the increasing adoption of AUVs for naval surveillance, mine countermeasures (MCM), and anti-submarine warfare (ASW). Militaries worldwide are investing in autonomous underwater technologies to enhance maritime security and intelligence-gathering capabilities. Leading defense companies are actively developing and deploying next-generation torpedo-shaped AUVs for underwater reconnaissance. In 2023, BAE Systems introduced an advanced Talisman AUV, designed for covert naval operations and underwater mine detection. Similarly, L3Harris Technologies launched an upgraded version of the Iver4 AUV, featuring AI-powered autonomous navigation and real-time data transmission for deep-sea military missions. These advancements are critical for modern naval forces seeking unmanned, cost-effective, and high-endurance underwater solutions.
The scientific research segment is projected to grow at the highest CAGR in the forecasted period, driven by the increasing need for deep-sea exploration, climate change studies, and oceanographic research. AUVs play a crucial role in mapping the seafloor, studying marine ecosystems, and monitoring environmental changes, as they provide unmanned, long-duration underwater data collection capabilities. Research institutions and oceanographic agencies are investing in advanced AUVs with high-precision sensors and imaging systems. In 2023, Fugro launched the Blue Essence AUV, designed for seabed mapping and geological surveys. Likewise, Hydromea introduced the Exray AUV, featuring swarm robotics technology for real-time underwater research applications. These innovations are vital for marine biodiversity assessments, underwater archaeology, and polar ice studies, as they offer cost-effective, high-resolution ocean monitoring.
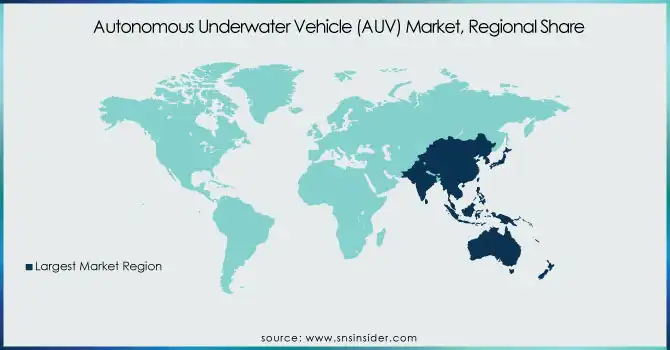
The Asia Pacific region led the Autonomous Underwater Vehicle (AUV) market in 2023, accounting for a significant market share due to rising defense investments, increasing underwater exploration activities, and advancements in marine research. Countries like China, India, Japan, and South Korea are actively deploying AUVs for naval surveillance, deep-sea mining, and offshore energy sector applications. China has been rapidly expanding its unmanned underwater capabilities, with developments such as the Haiyan AUV, designed for long-endurance reconnaissance and oceanographic studies. Similarly, India's DRDO (Defence Research and Development Organisation) has been working on indigenous AUV technologies for coastal defense and underwater mine detection. The growth in offshore oil & gas activities, along with increasing government initiatives for marine biodiversity and climate change research, has further strengthened the region’s dominance in the market.
The North American region is the fastest-growing market for Autonomous Underwater Vehicles (AUVs) in 2023, with an estimated high CAGR, driven by strong defense funding, rapid technological innovation, and increasing commercial applications. The U.S. Navy has been aggressively investing in unmanned maritime systems, with major contracts awarded to companies like Boeing, Lockheed Martin, and General Dynamics for advanced AUVs such as the Orca XLUUV (Extra Large Unmanned Underwater Vehicle). Additionally, the growing offshore wind energy sector in the United States and Canada is fueling demand for AUVs in seabed mapping, subsea infrastructure inspections, and marine environmental assessments. Furthermore, organizations like NOAA (National Oceanic and Atmospheric Administration) are increasingly utilizing AUVs for deep-sea exploration and climate research. With strong government and private sector investments, along with ongoing innovation in AI-driven autonomy, advanced sensors, and long-endurance propulsion, North America is positioned as the fastest-growing region in the AUV market.
Get Customized Report as per Your Business Requirement - Enquiry Now
Some of the major players in the Autonomous Underwater Vehicle Market are:
BAE Systems (Talisman M, Talisman L)
Boeing (Echo Voyager, Echo Seeker)
ECA Group (A18D AUV, A9-E AUV)
Graal Tech (Manta AUV, Flounder AUV)
Atlas Elektronik (SeaCat, SeaOtter MkII)
Bluefin Robotics (Bluefin-12, Bluefin-21)
Boston Engineering Corporation (BIOSwimmer, GhostSwimmer)
Fugro (Fugro Blue Essence, Fugro Blue Shadow)
Hydromea (Exray AUV, LUMA Wireless Optical Modem)
International Submarine Engineering (Explorer AUV, Arctic Explorer AUV)
In November 2024, BAE Systems completed initial in-water trials of its Herne extra-large autonomous underwater vehicle (XLAUV), demonstrating capabilities in intelligence, surveillance, and reconnaissance missions.
In January 2025, Ocean Infinity, a marine technology company, announced plans to deploy underwater drones to resume the search for Malaysia Airlines flight MH370, which disappeared almost 11 years ago.
| Report Attributes | Details |
|---|---|
| Market Size in 2023 | USD 3.12 Billion |
| Market Size by 2032 | USD 12.46 Billion |
| CAGR | CAGR of 16.64 % From 2024 to 2032 |
| Base Year | 2023 |
| Forecast Period | 2024-2032 |
| Historical Data | 2020-2022 |
| Report Scope & Coverage | Market Size, Segments Analysis, Competitive Landscape, Regional Analysis, DROC & SWOT Analysis, Forecast Outlook |
| Key Segments | • By Type (Shallow AUVs [up to 100 m], Medium AUVs [up to 1,000 m], Large AUVs [>1,000 m]) • By Payload Type (Cameras, Sensors, Inertial Navigation System, Others) • By Shape (Torpedo, Streamlined Rectangular Style, Laminar Flow Body, Multi-hull Vehicle) • By Technology (Collision Avoidance, Navigation, Imaging, Communication, Propulsion) • By Application (Scientific Research, Defense, Oil & Gas Industry) |
| Regional Analysis/Coverage | North America (US, Canada, Mexico), Europe (Eastern Europe [Poland, Romania, Hungary, Turkey, Rest of Eastern Europe] Western Europe] Germany, France, UK, Italy, Spain, Netherlands, Switzerland, Austria, Rest of Western Europe]), Asia Pacific (China, India, Japan, South Korea, Vietnam, Singapore, Australia, Rest of Asia Pacific), Middle East & Africa (Middle East [UAE, Egypt, Saudi Arabia, Qatar, Rest of Middle East], Africa [Nigeria, South Africa, Rest of Africa], Latin America (Brazil, Argentina, Colombia, Rest of Latin America) |
| Company Profiles | Bae Systems, Boeing, Eca Group, Graal Tech, ECA GROUP, Atlas Elektronik, Bluefin Robotics, Boston Engineering Corporation, Fugro, Hydromea, International Submarine Engineering |
Ans: The Autonomous Underwater Vehicle (AUV) Market is expected to grow at a CAGR of 16.64%.
Ans: Autonomous Underwater Vehicle (AUV) Market size was USD 3.12 billion in 2023 and is expected to Reach USD 12.46 billion by 2032.
Ans: The anticipated expansion of the Internet via 5G is fueling demand for underwater cables, driving the Autonomous Underwater Vehicle (AUV) Market.
Ans: The inertial navigation system segment by payload type dominates the autonomous underwater vehicle (AUV) market.
Ans: Asia Pacific dominates the Autonomous Underwater Vehicle (AUV) Market.
1. Introduction
1.1 Market Definition
1.2 Scope (Inclusion and Exclusions)
1.3 Research Assumptions
2. Executive Summary
2.1 Market Overview
2.2 Regional Synopsis
2.3 Competitive Summary
3. Research Methodology
3.1 Top-Down Approach
3.2 Bottom-up Approach
3.3. Data Validation
3.4 Primary Interviews
4. Market Dynamics Impact Analysis
4.1 Market Driving Factors Analysis
4.1.1 Drivers
4.1.2 Restraints
4.1.3 Opportunities
4.1.4 Challenges
4.2 PESTLE Analysis
4.3 Porter’s Five Forces Model
5. Statistical Insights and Trends Reporting
5.1 Investment & Funding Statistics
5.2 Operational & Performance Metrics
5.3 Demand & Procurement Data
5.4 Environmental & Sustainability Impact
6. Competitive Landscape
6.1 List of Major Companies, By Region
6.2 Market Share Analysis, By Region
6.3 Product Benchmarking
6.3.1 Product specifications and features
6.3.2 Pricing
6.4 Strategic Initiatives
6.4.1 Marketing and promotional activities
6.4.2 Distribution and supply chain strategies
6.4.3 Expansion plans and new product launches
6.4.4 Strategic partnerships and collaborations
6.5 Technological Advancements
6.6 Market Positioning and Branding
7. Autonomous Underwater Vehicle Market Segmentation, By Application
7.1 Chapter Overview
7.2 Scientific Research
7.2.1 Scientific Research Market Trends Analysis (2020-2032)
7.2.2 Scientific Research Market Size Estimates and Forecasts to 2032 (USD Billion)
7.3 Defense
7.3.1 Defense Market Trends Analysis (2020-2032)
7.3.2 Defense Market Size Estimates and Forecasts to 2032 (USD Billion)
7.4 Oil & Gas Industry
7.4.1 Oil & Gas Industry Market Trends Analysis (2020-2032)
7.4.2 Oil & Gas Industry Market Size Estimates and Forecasts to 2032 (USD Billion)
8. Autonomous Underwater Vehicle Market Segmentation, By Type
8.1 Chapter Overview
8.2 Shallow AUVs (up to 100 m)
8.2.1 Shallow AUVs (up to 100 m) Market Trends Analysis (2020-2032)
8.2.2 Shallow AUVs (up to 100 m) Market Size Estimates And Forecasts To 2032 (USD Billion)
8.3 Medium AUVs (up to 1,000m)
8.3.1 Medium AUVs (up to 1,000m) Market Trends Analysis (2020-2032)
8.3.2 Medium AUVs (up to 1,000m) Market Size Estimates And Forecasts To 2032 (USD Billion)
8.3 Large AUVs (>1,000m)
8.3.1 Large AUVs (>1,000m) Market Trends Analysis (2020-2032)
8.3.2 Large AUVs (>1,000m) Market Size Estimates And Forecasts To 2032 (USD Billion)
9. Autonomous Underwater Vehicle Market Segmentation, By Payload Type
9.1 Chapter Overview
9.2 Cameras
9.2.1 Cameras Market Trends Analysis (2020-2032)
9.2.2 Cameras Market Size Estimates And Forecasts To 2032 (USD Billion)
9.3 Sensors
9.3.1 Sensors Market Trends Analysis (2020-2032)
9.3.2 Sensors Market Size Estimates And Forecasts To 2032 (USD Billion)
9.4 Inertial Navigation System
9.4.1 Inertial Navigation System Market Trends Analysis (2020-2032)
9.4.2 Inertial Navigation System Market Size Estimates And Forecasts To 2032 (USD Billion)
9.5 Others
9.5.1 Others Market Trends Analysis (2020-2032)
9.5.2 Others Market Size Estimates And Forecasts To 2032 (USD Billion)
10. Autonomous Underwater Vehicle Market Segmentation, By Shape
10.1 Chapter Overview
10.2 Torpedo
10.2.1 Torpedo Market Trends Analysis (2020-2032)
10.2.2 Torpedo Market Size Estimates And Forecasts To 2032 (USD Billion)
10.3 Streamlined Rectangular Style
10.3.1 Streamlined Rectangular Style Market Trends Analysis (2020-2032)
10.3.2 Streamlined Rectangular Style Market Size Estimates And Forecasts To 2032 (USD Billion)
10.4 Laminar Flow Body
10.4.1 Laminar Flow Body Market Trends Analysis (2020-2032)
10.4.2 Laminar Flow Body Market Size Estimates And Forecasts To 2032 (USD Billion)
10.5 Multi-hull Vehicle
10.5.1 Multi-hull Vehicle Market Trends Analysis (2020-2032)
10.5.2 Multi-hull Vehicle Market Size Estimates And Forecasts To 2032 (USD Billion)
11. Autonomous Underwater Vehicle Market Segmentation, By Technology
11.1 Chapter Overview
11.2 Collision Avoidance
11.2.1 Collision Avoidance Market Trends Analysis (2020-2032)
11.2.2 Collision Avoidance Market Size Estimates And Forecasts To 2032 (USD Billion)
11.3 Navigation
11.3.1 Navigation Market Trends Analysis (2020-2032)
11.3.2 Navigation Market Size Estimates And Forecasts To 2032 (USD Billion)
11.4 Imaging
11.4.1 Imaging Market Trends Analysis (2020-2032)
11.4.2 Imaging Market Size Estimates And Forecasts To 2032 (USD Billion)
11.5 Communication
11.5.1 Communication Market Trends Analysis (2020-2032)
11.5.2 Communication Market Size Estimates And Forecasts To 2032 (USD Billion)
11.6 Propulsion
11.6.1 Propulsion Market Trends Analysis (2020-2032)
11.6.2 Propulsion Market Size Estimates And Forecasts To 2032 (USD Billion)
12. Regional Analysis
12.1 Chapter Overview
12.2 North America
12.2.1 Trends Analysis
12.2.2 North America Autonomous Underwater Vehicle Market Estimates And Forecasts, By Country (2020-2032) (USD Billion)
12.2.3 North America Autonomous Underwater Vehicle Market Estimates And Forecasts, By Application (2020-2032) (USD Billion)
12.2.4 North America Autonomous Underwater Vehicle Market Estimates And Forecasts, By Type (2020-2032) (USD Billion)
12.2.5 North America Autonomous Underwater Vehicle Market Estimates And Forecasts, By Payload Type (2020-2032) (USD Billion)
12.2.6 North America Autonomous Underwater Vehicle Market Estimates And Forecasts, By Shape (2020-2032) (USD Billion)
12.2.7 North America Autonomous Underwater Vehicle Market Estimates And Forecasts, By Technology(2020-2032) (USD Billion)
12.2.8 USA
12.2.8.1 USA Autonomous Underwater Vehicle Market Estimates And Forecasts, By Application (2020-2032) (USD Billion)
12.2.8.2 USA Autonomous Underwater Vehicle Market Estimates And Forecasts, By Type (2020-2032) (USD Billion)
12.2.8.3 USA Autonomous Underwater Vehicle Market Estimates And Forecasts, By Payload Type (2020-2032) (USD Billion)
12.2.8.4 USA Autonomous Underwater Vehicle Market Estimates And Forecasts, By Shape (2020-2032) (USD Billion)
12.2.8.5 USA Autonomous Underwater Vehicle Market Estimates And Forecasts, By Technology(2020-2032) (USD Billion)
12.2.9 Canada
12.2.9.1 Canada Autonomous Underwater Vehicle Market Estimates And Forecasts, By Application (2020-2032) (USD Billion)
12.2.9.2 Canada Autonomous Underwater Vehicle Market Estimates And Forecasts, By Type (2020-2032) (USD Billion)
12.2.9.3 Canada Autonomous Underwater Vehicle Market Estimates And Forecasts, By Payload Type (2020-2032) (USD Billion)
12.2.9.4 Canada Autonomous Underwater Vehicle Market Estimates And Forecasts, By Shape (2020-2032) (USD Billion)
12.2.9.5 Canada Autonomous Underwater Vehicle Market Estimates And Forecasts, By Technology(2020-2032) (USD Billion)
12.2.10 Mexico
12.2.10.1 Mexico Autonomous Underwater Vehicle Market Estimates And Forecasts, By Application (2020-2032) (USD Billion)
12.2.10.2 Mexico Autonomous Underwater Vehicle Market Estimates And Forecasts, By Type (2020-2032) (USD Billion)
12.2.10.3 Mexico Autonomous Underwater Vehicle Market Estimates And Forecasts, By Payload Type (2020-2032) (USD Billion)
12.2.10.4 Mexico Autonomous Underwater Vehicle Market Estimates And Forecasts, By Shape (2020-2032) (USD Billion)
12.2.10.5 Mexico Autonomous Underwater Vehicle Market Estimates And Forecasts, By Technology(2020-2032) (USD Billion)
12.3 Europe
12.3.1 Eastern Europe
12.3.1.1 Trends Analysis
12.3.1.2 Eastern Europe Autonomous Underwater Vehicle Market Estimates And Forecasts, By Country (2020-2032) (USD Billion)
12.3.1.3 Eastern Europe Autonomous Underwater Vehicle Market Estimates And Forecasts, By Application (2020-2032) (USD Billion)
12.3.1.4 Eastern Europe Autonomous Underwater Vehicle Market Estimates And Forecasts, By Type (2020-2032) (USD Billion)
12.3.1.5 Eastern Europe Autonomous Underwater Vehicle Market Estimates And Forecasts, By Payload Type (2020-2032) (USD Billion)
12.3.1.6 Eastern Europe Autonomous Underwater Vehicle Market Estimates And Forecasts, By Shape (2020-2032) (USD Billion)
12.3.1.7 Eastern Europe Autonomous Underwater Vehicle Market Estimates And Forecasts, By Technology(2020-2032) (USD Billion)
12.3.1.8 Poland
12.3.1.8.1 Poland Autonomous Underwater Vehicle Market Estimates And Forecasts, By Application (2020-2032) (USD Billion)
12.3.1.8.2 Poland Autonomous Underwater Vehicle Market Estimates And Forecasts, By Type (2020-2032) (USD Billion)
12.3.1.8.3 Poland Autonomous Underwater Vehicle Market Estimates And Forecasts, By Payload Type (2020-2032) (USD Billion)
12.3.1.8.4 Poland Autonomous Underwater Vehicle Market Estimates And Forecasts, By Shape (2020-2032) (USD Billion)
12.3.1.8.5 Poland Autonomous Underwater Vehicle Market Estimates And Forecasts, By Technology(2020-2032) (USD Billion)
12.3.1.9 Romania
12.3.1.9.1 Romania Autonomous Underwater Vehicle Market Estimates And Forecasts, By Application (2020-2032) (USD Billion)
12.3.1.9.2 Romania Autonomous Underwater Vehicle Market Estimates And Forecasts, By Type (2020-2032) (USD Billion)
12.3.1.9.3 Romania Autonomous Underwater Vehicle Market Estimates And Forecasts, By Payload Type (2020-2032) (USD Billion)
12.3.1.9.4 Romania Autonomous Underwater Vehicle Market Estimates And Forecasts, By Shape (2020-2032) (USD Billion)
12.3.1.9.5 Romania Autonomous Underwater Vehicle Market Estimates And Forecasts, By Technology(2020-2032) (USD Billion)
12.3.1.10 Hungary
12.3.1.10.1 Hungary Autonomous Underwater Vehicle Market Estimates And Forecasts, By Application (2020-2032) (USD Billion)
12.3.1.10.2 Hungary Autonomous Underwater Vehicle Market Estimates And Forecasts, By Type (2020-2032) (USD Billion)
12.3.1.10.3 Hungary Autonomous Underwater Vehicle Market Estimates And Forecasts, By Payload Type (2020-2032) (USD Billion)
12.3.1.10.4 Hungary Autonomous Underwater Vehicle Market Estimates And Forecasts, By Shape (2020-2032) (USD Billion)
12.3.1.10.5 Hungary Autonomous Underwater Vehicle Market Estimates And Forecasts, By Technology(2020-2032) (USD Billion)
12.3.1.11 Turkey
12.3.1.11.1 Turkey Autonomous Underwater Vehicle Market Estimates And Forecasts, By Application (2020-2032) (USD Billion)
12.3.1.11.2 Turkey Autonomous Underwater Vehicle Market Estimates And Forecasts, By Type (2020-2032) (USD Billion)
12.3.1.11.3 Turkey Autonomous Underwater Vehicle Market Estimates And Forecasts, By Payload Type (2020-2032) (USD Billion)
12.3.1.11.4 Turkey Autonomous Underwater Vehicle Market Estimates And Forecasts, By Shape (2020-2032) (USD Billion)
12.3.1.11.5 Turkey Autonomous Underwater Vehicle Market Estimates And Forecasts, By Technology(2020-2032) (USD Billion)
12.3.1.12 Rest Of Eastern Europe
12.3.1.12.1 Rest Of Eastern Europe Autonomous Underwater Vehicle Market Estimates And Forecasts, By Application (2020-2032) (USD Billion)
12.3.1.12.2 Rest Of Eastern Europe Autonomous Underwater Vehicle Market Estimates And Forecasts, By Type (2020-2032) (USD Billion)
12.3.1.12.3 Rest Of Eastern Europe Autonomous Underwater Vehicle Market Estimates And Forecasts, By Payload Type (2020-2032) (USD Billion)
12.3.1.12.4 Rest Of Eastern Europe Autonomous Underwater Vehicle Market Estimates And Forecasts, By Shape (2020-2032) (USD Billion)
12.3.1.12.5 Rest Of Eastern Europe Autonomous Underwater Vehicle Market Estimates And Forecasts, By Technology(2020-2032) (USD Billion)
12.3.2 Western Europe
12.3.2.1 Trends Analysis
12.3.2.2 Western Europe Autonomous Underwater Vehicle Market Estimates And Forecasts, By Country (2020-2032) (USD Billion)
12.3.2.3 Western Europe Autonomous Underwater Vehicle Market Estimates And Forecasts, By Application (2020-2032) (USD Billion)
12.3.2.4 Western Europe Autonomous Underwater Vehicle Market Estimates And Forecasts, By Type (2020-2032) (USD Billion)
12.3.2.5 Western Europe Autonomous Underwater Vehicle Market Estimates And Forecasts, By Payload Type (2020-2032) (USD Billion)
12.3.2.6 Western Europe Autonomous Underwater Vehicle Market Estimates And Forecasts, By Shape (2020-2032) (USD Billion)
12.3.2.7 Western Europe Autonomous Underwater Vehicle Market Estimates And Forecasts, By Technology(2020-2032) (USD Billion)
12.3.2.8 Germany
12.3.2.8.1 Germany Autonomous Underwater Vehicle Market Estimates And Forecasts, By Application (2020-2032) (USD Billion)
12.3.2.8.2 Germany Autonomous Underwater Vehicle Market Estimates And Forecasts, By Type (2020-2032) (USD Billion)
12.3.2.8.3 Germany Autonomous Underwater Vehicle Market Estimates And Forecasts, By Payload Type (2020-2032) (USD Billion)
12.3.2.8.4 Germany Autonomous Underwater Vehicle Market Estimates And Forecasts, By Shape (2020-2032) (USD Billion)
12.3.2.8.5 Germany Autonomous Underwater Vehicle Market Estimates And Forecasts, By Technology(2020-2032) (USD Billion)
12.3.2.9 France
12.3.2.9.1 France Autonomous Underwater Vehicle Market Estimates And Forecasts, By Application (2020-2032) (USD Billion)
12.3.2.9.2 France Autonomous Underwater Vehicle Market Estimates And Forecasts, By Type (2020-2032) (USD Billion)
12.3.2.9.3 France Autonomous Underwater Vehicle Market Estimates And Forecasts, By Payload Type (2020-2032) (USD Billion)
12.3.2.9.4 France Autonomous Underwater Vehicle Market Estimates And Forecasts, By Shape (2020-2032) (USD Billion)
12.3.2.9.5 France Autonomous Underwater Vehicle Market Estimates And Forecasts, By Technology(2020-2032) (USD Billion)
12.3.2.10 UK
12.3.2.10.1 UK Autonomous Underwater Vehicle Market Estimates And Forecasts, By Application (2020-2032) (USD Billion)
12.3.2.10.2 UK Autonomous Underwater Vehicle Market Estimates And Forecasts, By Type (2020-2032) (USD Billion)
12.3.2.10.3 UK Autonomous Underwater Vehicle Market Estimates And Forecasts, By Payload Type (2020-2032) (USD Billion)
12.3.2.10.4 UK Autonomous Underwater Vehicle Market Estimates And Forecasts, By Shape (2020-2032) (USD Billion)
12.3.2.10.5 UK Autonomous Underwater Vehicle Market Estimates And Forecasts, By Technology(2020-2032) (USD Billion)
12.3.2.11 Italy
12.3.2.11.1 Italy Autonomous Underwater Vehicle Market Estimates And Forecasts, By Application (2020-2032) (USD Billion)
12.3.2.11.2 Italy Autonomous Underwater Vehicle Market Estimates And Forecasts, By Type (2020-2032) (USD Billion)
12.3.2.11.3 Italy Autonomous Underwater Vehicle Market Estimates And Forecasts, By Payload Type (2020-2032) (USD Billion)
12.3.2.11.4 Italy Autonomous Underwater Vehicle Market Estimates And Forecasts, By Shape (2020-2032) (USD Billion)
12.3.2.11.5 Italy Autonomous Underwater Vehicle Market Estimates And Forecasts, By Technology(2020-2032) (USD Billion)
12.3.2.12 Spain
12.3.2.12.1 Spain Autonomous Underwater Vehicle Market Estimates And Forecasts, By Application (2020-2032) (USD Billion)
12.3.2.12.2 Spain Autonomous Underwater Vehicle Market Estimates And Forecasts, By Type (2020-2032) (USD Billion)
12.3.2.12.3 Spain Autonomous Underwater Vehicle Market Estimates And Forecasts, By Payload Type (2020-2032) (USD Billion)
12.3.2.12.4 Spain Autonomous Underwater Vehicle Market Estimates And Forecasts, By Shape (2020-2032) (USD Billion)
12.3.2.12.5 Spain Autonomous Underwater Vehicle Market Estimates And Forecasts, By Technology(2020-2032) (USD Billion)
12.3.2.13 Netherlands
12.3.2.13.1 Netherlands Autonomous Underwater Vehicle Market Estimates And Forecasts, By Application (2020-2032) (USD Billion)
12.3.2.13.2 Netherlands Autonomous Underwater Vehicle Market Estimates And Forecasts, By Type (2020-2032) (USD Billion)
12.3.2.13.3 Netherlands Autonomous Underwater Vehicle Market Estimates And Forecasts, By Payload Type (2020-2032) (USD Billion)
12.3.2.13.4 Netherlands Autonomous Underwater Vehicle Market Estimates And Forecasts, By Shape (2020-2032) (USD Billion)
12.3.2.13.5 Netherlands Autonomous Underwater Vehicle Market Estimates And Forecasts, By Technology(2020-2032) (USD Billion)
12.3.2.14 Switzerland
12.3.2.14.1 Switzerland Autonomous Underwater Vehicle Market Estimates And Forecasts, By Application (2020-2032) (USD Billion)
12.3.2.14.2 Switzerland Autonomous Underwater Vehicle Market Estimates And Forecasts, By Type (2020-2032) (USD Billion)
12.3.2.14.3 Switzerland Autonomous Underwater Vehicle Market Estimates And Forecasts, By Payload Type (2020-2032) (USD Billion)
12.3.2.14.4 Switzerland Autonomous Underwater Vehicle Market Estimates And Forecasts, By Shape (2020-2032) (USD Billion)
12.3.2.12.5 Switzerland Autonomous Underwater Vehicle Market Estimates And Forecasts, By Technology(2020-2032) (USD Billion)
12.3.2.15 Austria
12.3.2.15.1 Austria Autonomous Underwater Vehicle Market Estimates And Forecasts, By Application (2020-2032) (USD Billion)
12.3.2.15.2 Austria Autonomous Underwater Vehicle Market Estimates And Forecasts, By Type (2020-2032) (USD Billion)
12.3.2.15.3 Austria Autonomous Underwater Vehicle Market Estimates And Forecasts, By Payload Type (2020-2032) (USD Billion)
12.3.2.15.4 Austria Autonomous Underwater Vehicle Market Estimates And Forecasts, By Shape (2020-2032) (USD Billion)
12.3.2.15.5 Austria Autonomous Underwater Vehicle Market Estimates And Forecasts, By Technology(2020-2032) (USD Billion)
12.3.2.16 Rest Of Western Europe
12.3.2.16.1 Rest Of Western Europe Autonomous Underwater Vehicle Market Estimates And Forecasts, By Application (2020-2032) (USD Billion)
12.3.2.16.2 Rest Of Western Europe Autonomous Underwater Vehicle Market Estimates And Forecasts, By Type (2020-2032) (USD Billion)
12.3.2.16.3 Rest Of Western Europe Autonomous Underwater Vehicle Market Estimates And Forecasts, By Payload Type (2020-2032) (USD Billion)
12.3.2.16.4 Rest Of Western Europe Autonomous Underwater Vehicle Market Estimates And Forecasts, By Shape (2020-2032) (USD Billion)
12.3.2.16.5 Rest Of Western Europe Autonomous Underwater Vehicle Market Estimates And Forecasts, By Technology(2020-2032) (USD Billion)
12.4 Asia Pacific
12.4.1 Trends Analysis
12.4.2 Asia Pacific Autonomous Underwater Vehicle Market Estimates And Forecasts, By Country (2020-2032) (USD Billion)
12.4.3 Asia Pacific Autonomous Underwater Vehicle Market Estimates And Forecasts, By Application (2020-2032) (USD Billion)
12.4.4 Asia Pacific Autonomous Underwater Vehicle Market Estimates And Forecasts, By Type (2020-2032) (USD Billion)
12.4.5 Asia Pacific Autonomous Underwater Vehicle Market Estimates And Forecasts, By Payload Type (2020-2032) (USD Billion)
12.4.6 Asia Pacific Autonomous Underwater Vehicle Market Estimates And Forecasts, By Shape (2020-2032) (USD Billion)
12.4.7 Asia Pacific Autonomous Underwater Vehicle Market Estimates And Forecasts, By Technology(2020-2032) (USD Billion)
12.4.8 China
12.4.8.1 China Autonomous Underwater Vehicle Market Estimates And Forecasts, By Application (2020-2032) (USD Billion)
12.4.8.2 China Autonomous Underwater Vehicle Market Estimates And Forecasts, By Type (2020-2032) (USD Billion)
12.4.8.3 China Autonomous Underwater Vehicle Market Estimates And Forecasts, By Payload Type (2020-2032) (USD Billion)
12.4.8.4 China Autonomous Underwater Vehicle Market Estimates And Forecasts, By Shape (2020-2032) (USD Billion)
12.4.8.5 China Autonomous Underwater Vehicle Market Estimates And Forecasts, By Technology(2020-2032) (USD Billion)
12.4.9 India
12.4.9.1 India Autonomous Underwater Vehicle Market Estimates And Forecasts, By Application (2020-2032) (USD Billion)
12.4.9.2 India Autonomous Underwater Vehicle Market Estimates And Forecasts, By Type (2020-2032) (USD Billion)
12.4.9.3 India Autonomous Underwater Vehicle Market Estimates And Forecasts, By Payload Type (2020-2032) (USD Billion)
12.4.9.4 India Autonomous Underwater Vehicle Market Estimates And Forecasts, By Shape (2020-2032) (USD Billion)
12.4.9.5 India Autonomous Underwater Vehicle Market Estimates And Forecasts, By Technology(2020-2032) (USD Billion)
12.4.10 Japan
12.4.10.1 Japan Autonomous Underwater Vehicle Market Estimates And Forecasts, By Application (2020-2032) (USD Billion)
12.4.10.2 Japan Autonomous Underwater Vehicle Market Estimates And Forecasts, By Type (2020-2032) (USD Billion)
12.4.10.3 Japan Autonomous Underwater Vehicle Market Estimates And Forecasts, By Payload Type (2020-2032) (USD Billion)
12.4.10.4 Japan Autonomous Underwater Vehicle Market Estimates And Forecasts, By Shape (2020-2032) (USD Billion)
12.4.10.5 Japan Autonomous Underwater Vehicle Market Estimates And Forecasts, By Technology(2020-2032) (USD Billion)
12.4.11 South Korea
12.4.11.1 South Korea Autonomous Underwater Vehicle Market Estimates And Forecasts, By Application (2020-2032) (USD Billion)
12.4.11.2 South Korea Autonomous Underwater Vehicle Market Estimates And Forecasts, By Type (2020-2032) (USD Billion)
12.4.11.3 South Korea Autonomous Underwater Vehicle Market Estimates And Forecasts, By Payload Type (2020-2032) (USD Billion)
12.4.11.4 South Korea Autonomous Underwater Vehicle Market Estimates And Forecasts, By Shape (2020-2032) (USD Billion)
12.4.11.5 South Korea Autonomous Underwater Vehicle Market Estimates And Forecasts, By Technology(2020-2032) (USD Billion)
12.4.12 Vietnam
12.4.12.1 Vietnam Autonomous Underwater Vehicle Market Estimates And Forecasts, By Application (2020-2032) (USD Billion)
12.4.12.2 Vietnam Autonomous Underwater Vehicle Market Estimates And Forecasts, By Type (2020-2032) (USD Billion)
12.4.12.3 Vietnam Autonomous Underwater Vehicle Market Estimates And Forecasts, By Payload Type (2020-2032) (USD Billion)
12.4.12.4 Vietnam Autonomous Underwater Vehicle Market Estimates And Forecasts, By Shape (2020-2032) (USD Billion)
12.4.12.5 Vietnam Autonomous Underwater Vehicle Market Estimates And Forecasts, By Technology(2020-2032) (USD Billion)
12.4.13 Singapore
12.4.13.1 Singapore Autonomous Underwater Vehicle Market Estimates And Forecasts, By Application (2020-2032) (USD Billion)
12.4.13.2 Singapore Autonomous Underwater Vehicle Market Estimates And Forecasts, By Type (2020-2032) (USD Billion)
12.4.13.3 Singapore Autonomous Underwater Vehicle Market Estimates And Forecasts, By Payload Type (2020-2032) (USD Billion)
12.4.13.4 Singapore Autonomous Underwater Vehicle Market Estimates And Forecasts, By Shape (2020-2032) (USD Billion)
12.4.13.5 Singapore Autonomous Underwater Vehicle Market Estimates And Forecasts, By Technology(2020-2032) (USD Billion)
12.4.14 Australia
12.4.14.1 Australia Autonomous Underwater Vehicle Market Estimates And Forecasts, By Application (2020-2032) (USD Billion)
12.4.14.2 Australia Autonomous Underwater Vehicle Market Estimates And Forecasts, By Type (2020-2032) (USD Billion)
12.4.14.3 Australia Autonomous Underwater Vehicle Market Estimates And Forecasts, By Payload Type (2020-2032) (USD Billion)
12.4.14.4 Australia Autonomous Underwater Vehicle Market Estimates And Forecasts, By Shape (2020-2032) (USD Billion)
12.4.14.5 Australia Autonomous Underwater Vehicle Market Estimates And Forecasts, By Technology(2020-2032) (USD Billion)
12.4.15 Rest Of Asia Pacific
12.4.15.1 Rest Of Asia Pacific Autonomous Underwater Vehicle Market Estimates And Forecasts, By Application (2020-2032) (USD Billion)
12.4.15.2 Rest Of Asia Pacific Autonomous Underwater Vehicle Market Estimates And Forecasts, By Type (2020-2032) (USD Billion)
12.4.15.3 Rest Of Asia Pacific Autonomous Underwater Vehicle Market Estimates And Forecasts, By Payload Type (2020-2032) (USD Billion)
12.4.15.4 Rest Of Asia Pacific Autonomous Underwater Vehicle Market Estimates And Forecasts, By Shape (2020-2032) (USD Billion)
12.4.15.5 Rest Of Asia Pacific Autonomous Underwater Vehicle Market Estimates And Forecasts, By Technology(2020-2032) (USD Billion)
12.5 Middle East And Africa
12.5.1 Middle East
12.5.1.1 Trends Analysis
12.5.1.2 Middle East Autonomous Underwater Vehicle Market Estimates And Forecasts, By Country (2020-2032) (USD Billion)
12.5.1.3 Middle East Autonomous Underwater Vehicle Market Estimates And Forecasts, By Application (2020-2032) (USD Billion)
12.5.1.4 Middle East Autonomous Underwater Vehicle Market Estimates And Forecasts, By Type (2020-2032) (USD Billion)
12.5.1.5 Middle East Autonomous Underwater Vehicle Market Estimates And Forecasts, By Payload Type (2020-2032) (USD Billion)
12.5.1.6 Middle East Autonomous Underwater Vehicle Market Estimates And Forecasts, By Shape (2020-2032) (USD Billion)
12.5.1.7 Middle East Autonomous Underwater Vehicle Market Estimates And Forecasts, By Technology(2020-2032) (USD Billion)
12.5.1.8 UAE
12.5.1.8.1 UAE Autonomous Underwater Vehicle Market Estimates And Forecasts, By Application (2020-2032) (USD Billion)
12.5.1.8.2 UAE Autonomous Underwater Vehicle Market Estimates And Forecasts, By Type (2020-2032) (USD Billion)
12.5.1.8.3 UAE Autonomous Underwater Vehicle Market Estimates And Forecasts, By Payload Type (2020-2032) (USD Billion)
12.5.1.8.4 UAE Autonomous Underwater Vehicle Market Estimates And Forecasts, By Shape (2020-2032) (USD Billion)
12.5.1.8.5 UAE Autonomous Underwater Vehicle Market Estimates And Forecasts, By Technology(2020-2032) (USD Billion)
12.5.1.9 Egypt
12.5.1.9.1 Egypt Autonomous Underwater Vehicle Market Estimates And Forecasts, By Application (2020-2032) (USD Billion)
12.5.1.9.2 Egypt Autonomous Underwater Vehicle Market Estimates And Forecasts, By Type (2020-2032) (USD Billion)
12.5.1.9.3 Egypt Autonomous Underwater Vehicle Market Estimates And Forecasts, By Payload Type (2020-2032) (USD Billion)
12.5.1.9.4 Egypt Autonomous Underwater Vehicle Market Estimates And Forecasts, By Shape (2020-2032) (USD Billion)
12.5.1.9.5 Egypt Autonomous Underwater Vehicle Market Estimates And Forecasts, By Technology(2020-2032) (USD Billion)
12.5.1.10 Saudi Arabia
12.5.1.10.1 Saudi Arabia Autonomous Underwater Vehicle Market Estimates And Forecasts, By Application (2020-2032) (USD Billion)
12.5.1.10.2 Saudi Arabia Autonomous Underwater Vehicle Market Estimates And Forecasts, By Type (2020-2032) (USD Billion)
12.5.1.10.3 Saudi Arabia Autonomous Underwater Vehicle Market Estimates And Forecasts, By Payload Type (2020-2032) (USD Billion)
12.5.1.10.4 Saudi Arabia Autonomous Underwater Vehicle Market Estimates And Forecasts, By Shape (2020-2032) (USD Billion)
12.5.1.10.5 Saudi Arabia Autonomous Underwater Vehicle Market Estimates And Forecasts, By Technology(2020-2032) (USD Billion)
12.5.1.11 Qatar
12.5.1.11.1 Qatar Autonomous Underwater Vehicle Market Estimates And Forecasts, By Application (2020-2032) (USD Billion)
12.5.1.11.2 Qatar Autonomous Underwater Vehicle Market Estimates And Forecasts, By Type (2020-2032) (USD Billion)
12.5.1.11.3 Qatar Autonomous Underwater Vehicle Market Estimates And Forecasts, By Payload Type (2020-2032) (USD Billion)
12.5.1.11.4 Qatar Autonomous Underwater Vehicle Market Estimates And Forecasts, By Shape (2020-2032) (USD Billion)
12.5.1.11.5 Qatar Autonomous Underwater Vehicle Market Estimates And Forecasts, By Technology(2020-2032) (USD Billion)
12.5.1.12 Rest Of Middle East
12.5.1.12.1 Rest Of Middle East Autonomous Underwater Vehicle Market Estimates And Forecasts, By Application (2020-2032) (USD Billion)
12.5.1.12.2 Rest Of Middle East Autonomous Underwater Vehicle Market Estimates And Forecasts, By Type (2020-2032) (USD Billion)
12.5.1.12.3 Rest Of Middle East Autonomous Underwater Vehicle Market Estimates And Forecasts, By Payload Type (2020-2032) (USD Billion)
12.5.1.12.4 Rest Of Middle East Autonomous Underwater Vehicle Market Estimates And Forecasts, By Shape (2020-2032) (USD Billion)
12.5.1.12.5 Rest Of Middle East Autonomous Underwater Vehicle Market Estimates And Forecasts, By Technology(2020-2032) (USD Billion)
12.5.2 Africa
12.5.2.1 Trends Analysis
12.5.2.2 Africa Autonomous Underwater Vehicle Market Estimates And Forecasts, By Country (2020-2032) (USD Billion)
12.5.2.3 Africa Autonomous Underwater Vehicle Market Estimates And Forecasts, By Application (2020-2032) (USD Billion)
12.5.2.4 Africa Autonomous Underwater Vehicle Market Estimates And Forecasts, By Type (2020-2032) (USD Billion)
12.5.2.5 Africa Autonomous Underwater Vehicle Market Estimates And Forecasts, By Payload Type (2020-2032) (USD Billion)
12.5.2.6 Africa Autonomous Underwater Vehicle Market Estimates And Forecasts, By Shape (2020-2032) (USD Billion)
12.5.2.7 Africa Autonomous Underwater Vehicle Market Estimates And Forecasts, By Technology(2020-2032) (USD Billion)
12.5.2.8 South Africa
12.5.2.8.1 South Africa Autonomous Underwater Vehicle Market Estimates And Forecasts, By Application (2020-2032) (USD Billion)
12.5.2.8.2 South Africa Autonomous Underwater Vehicle Market Estimates And Forecasts, By Type (2020-2032) (USD Billion)
12.5.2.8.3 South Africa Autonomous Underwater Vehicle Market Estimates And Forecasts, By Payload Type (2020-2032) (USD Billion)
12.5.2.8.4 South Africa Autonomous Underwater Vehicle Market Estimates And Forecasts, By Shape (2020-2032) (USD Billion)
12.5.2.8.5 South Africa Autonomous Underwater Vehicle Market Estimates And Forecasts, By Technology(2020-2032) (USD Billion)
12.5.2.9 Nigeria
12.5.2.9.1 Nigeria Autonomous Underwater Vehicle Market Estimates And Forecasts, By Application (2020-2032) (USD Billion)
12.5.2.9.2 Nigeria Autonomous Underwater Vehicle Market Estimates And Forecasts, By Type (2020-2032) (USD Billion)
12.5.2.9.3 Nigeria Autonomous Underwater Vehicle Market Estimates And Forecasts, By Payload Type (2020-2032) (USD Billion)
12.5.2.9.4 Nigeria Autonomous Underwater Vehicle Market Estimates And Forecasts, By Shape (2020-2032) (USD Billion)
12.5.2.9.5 Nigeria Autonomous Underwater Vehicle Market Estimates And Forecasts, By Technology(2020-2032) (USD Billion)
12.5.2.10 Rest Of Africa
12.5.2.10.1 Rest Of Africa Autonomous Underwater Vehicle Market Estimates And Forecasts, By Application (2020-2032) (USD Billion)
12.5.2.10.2 Rest Of Africa Autonomous Underwater Vehicle Market Estimates And Forecasts, By Type (2020-2032) (USD Billion)
12.5.2.10.3 Rest Of Africa Autonomous Underwater Vehicle Market Estimates And Forecasts, By Payload Type (2020-2032) (USD Billion)
12.5.2.10.4 Rest Of Africa Autonomous Underwater Vehicle Market Estimates And Forecasts, By Shape (2020-2032) (USD Billion)
12.5.2.10.5 Rest Of Africa Autonomous Underwater Vehicle Market Estimates And Forecasts, By Technology(2020-2032) (USD Billion)
12.6 Latin America
12.6.1 Trends Analysis
12.6.2 Latin America Autonomous Underwater Vehicle Market Estimates And Forecasts, By Country (2020-2032) (USD Billion)
12.6.3 Latin America Autonomous Underwater Vehicle Market Estimates And Forecasts, By Application (2020-2032) (USD Billion)
12.6.4 Latin America Autonomous Underwater Vehicle Market Estimates And Forecasts, By Type (2020-2032) (USD Billion)
12.6.5 Latin America Autonomous Underwater Vehicle Market Estimates And Forecasts, By Payload Type (2020-2032) (USD Billion)
12.6.6 Latin America Autonomous Underwater Vehicle Market Estimates And Forecasts, By Shape (2020-2032) (USD Billion)
12.6.7 Latin America Autonomous Underwater Vehicle Market Estimates And Forecasts, By Technology(2020-2032) (USD Billion)
12.6.8 Brazil
12.6.8.1 Brazil Autonomous Underwater Vehicle Market Estimates And Forecasts, By Application (2020-2032) (USD Billion)
12.6.8.2 Brazil Autonomous Underwater Vehicle Market Estimates And Forecasts, By Type (2020-2032) (USD Billion)
12.6.8.3 Brazil Autonomous Underwater Vehicle Market Estimates And Forecasts, By Payload Type (2020-2032) (USD Billion)
12.6.8.4 Brazil Autonomous Underwater Vehicle Market Estimates And Forecasts, By Shape (2020-2032) (USD Billion)
12.6.8.5 Brazil Autonomous Underwater Vehicle Market Estimates And Forecasts, By Technology(2020-2032) (USD Billion)
12.6.9 Argentina
12.6.9.1 Argentina Autonomous Underwater Vehicle Market Estimates And Forecasts, By Application (2020-2032) (USD Billion)
12.6.9.2 Argentina Autonomous Underwater Vehicle Market Estimates And Forecasts, By Type (2020-2032) (USD Billion)
12.6.9.3 Argentina Autonomous Underwater Vehicle Market Estimates And Forecasts, By Payload Type (2020-2032) (USD Billion)
12.6.9.4 Argentina Autonomous Underwater Vehicle Market Estimates And Forecasts, By Shape (2020-2032) (USD Billion)
12.6.9.5 Argentina Autonomous Underwater Vehicle Market Estimates And Forecasts, By Technology(2020-2032) (USD Billion)
12.6.10 Colombia
12.6.10.1 Colombia Autonomous Underwater Vehicle Market Estimates And Forecasts, By Application (2020-2032) (USD Billion)
12.6.10.2 Colombia Autonomous Underwater Vehicle Market Estimates And Forecasts, By Type (2020-2032) (USD Billion)
12.6.10.3 Colombia Autonomous Underwater Vehicle Market Estimates And Forecasts, By Payload Type (2020-2032) (USD Billion)
12.6.10.4 Colombia Autonomous Underwater Vehicle Market Estimates And Forecasts, By Shape (2020-2032) (USD Billion)
12.6.10.5 Colombia Autonomous Underwater Vehicle Market Estimates And Forecasts, By Technology(2020-2032) (USD Billion)
12.6.11 Rest Of Latin America
12.6.11.1 Rest Of Latin America Autonomous Underwater Vehicle Market Estimates And Forecasts, By Application (2020-2032) (USD Billion)
12.6.11.2 Rest Of Latin America Autonomous Underwater Vehicle Market Estimates And Forecasts, By Type (2020-2032) (USD Billion)
12.6.11.3 Rest Of Latin America Autonomous Underwater Vehicle Market Estimates And Forecasts, By Payload Type (2020-2032) (USD Billion)
12.6.11.4 Rest Of Latin America Autonomous Underwater Vehicle Market Estimates And Forecasts, By Shape (2020-2032) (USD Billion)
12.6.11.5 Rest Of Latin America Autonomous Underwater Vehicle Market Estimates And Forecasts, By Technology(2020-2032) (USD Billion)
13. Company Profiles
13.1 BAE Systems
13.1.1 Company Overview
13.1.2 Financial
13.1.3 Products/ Services Offered
13.1.4 SWOT Analysis
13.2 Boeing
13.2.1 Company Overview
13.2.2 Financial
13.2.3 Products/ Services Offered
13.2.4 SWOT Analysis
13.3 ECA Group
13.3.1 Company Overview
13.3.2 Financial
13.3.3 Products/ Services Offered
13.3.4 SWOT Analysis
13.4 Graal Tech
13.4.1 Company Overview
13.4.2 Financial
13.4.3 Products/ Services Offered
13.4.4 SWOT Analysis
13.5 Atlas Elektronik
13.5.1 Company Overview
13.5.2 Financial
13.5.3 Products/ Services Offered
13.5.4 SWOT Analysis
13.6 Bluefin Robotics
13.6.1 Company Overview
13.6.2 Financial
13.6.3 Products/ Services Offered
13.6.4 SWOT Analysis
13.7 Boston Engineering Corporation
13.7.1 Company Overview
13.7.2 Financial
13.7.3 Products/ Services Offered
13.7.4 SWOT Analysis
13.8 Fugro
13.8.1 Company Overview
13.8.2 Financial
13.8.3 Products/ Services Offered
13.8.4 SWOT Analysis
13.9 Hydromea
13.9.1 Company Overview
13.9.2 Financial
13.9.3 Products/ Services Offered
13.9.4 SWOT Analysis
13.10 International Submarine Engineering
13.10.1 Company Overview
13.10.2 Financial
13.10.3 Products/ Services Offered
13.10.4 SWOT Analysis
14. Use Cases and Best Practices
15. Conclusion
An accurate research report requires proper strategizing as well as implementation. There are multiple factors involved in the completion of good and accurate research report and selecting the best methodology to compete the research is the toughest part. Since the research reports we provide play a crucial role in any company’s decision-making process, therefore we at SNS Insider always believe that we should choose the best method which gives us results closer to reality. This allows us to reach at a stage wherein we can provide our clients best and accurate investment to output ratio.
Each report that we prepare takes a timeframe of 350-400 business hours for production. Starting from the selection of titles through a couple of in-depth brain storming session to the final QC process before uploading our titles on our website we dedicate around 350 working hours. The titles are selected based on their current market cap and the foreseen CAGR and growth.
The 5 steps process:
Step 1: Secondary Research:
Secondary Research or Desk Research is as the name suggests is a research process wherein, we collect data through the readily available information. In this process we use various paid and unpaid databases which our team has access to and gather data through the same. This includes examining of listed companies’ annual reports, Journals, SEC filling etc. Apart from this our team has access to various associations across the globe across different industries. Lastly, we have exchange relationships with various university as well as individual libraries.

Step 2: Primary Research
When we talk about primary research, it is a type of study in which the researchers collect relevant data samples directly, rather than relying on previously collected data. This type of research is focused on gaining content specific facts that can be sued to solve specific problems. Since the collected data is fresh and first hand therefore it makes the study more accurate and genuine.
We at SNS Insider have divided Primary Research into 2 parts.
Part 1 wherein we interview the KOLs of major players as well as the upcoming ones across various geographic regions. This allows us to have their view over the market scenario and acts as an important tool to come closer to the accurate market numbers. As many as 45 paid and unpaid primary interviews are taken from both the demand and supply side of the industry to make sure we land at an accurate judgement and analysis of the market.
This step involves the triangulation of data wherein our team analyses the interview transcripts, online survey responses and observation of on filed participants. The below mentioned chart should give a better understanding of the part 1 of the primary interview.

Part 2: In this part of primary research the data collected via secondary research and the part 1 of the primary research is validated with the interviews from individual consultants and subject matter experts.
Consultants are those set of people who have at least 12 years of experience and expertise within the industry whereas Subject Matter Experts are those with at least 15 years of experience behind their back within the same space. The data with the help of two main processes i.e., FGDs (Focused Group Discussions) and IDs (Individual Discussions). This gives us a 3rd party nonbiased primary view of the market scenario making it a more dependable one while collation of the data pointers.
Step 3: Data Bank Validation
Once all the information is collected via primary and secondary sources, we run that information for data validation. At our intelligence centre our research heads track a lot of information related to the market which includes the quarterly reports, the daily stock prices, and other relevant information. Our data bank server gets updated every fortnight and that is how the information which we collected using our primary and secondary information is revalidated in real time.

Step 4: QA/QC Process
After all the data collection and validation our team does a final level of quality check and quality assurance to get rid of any unwanted or undesired mistakes. This might include but not limited to getting rid of the any typos, duplication of numbers or missing of any important information. The people involved in this process include technical content writers, research heads and graphics people. Once this process is completed the title gets uploader on our platform for our clients to read it.
Step 5: Final QC/QA Process:
This is the last process and comes when the client has ordered the study. In this process a final QA/QC is done before the study is emailed to the client. Since we believe in giving our clients a good experience of our research studies, therefore, to make sure that we do not lack at our end in any way humanly possible we do a final round of quality check and then dispatch the study to the client.
By Type
Shallow AUVs (up to 100 m)
Medium AUVs (up to 1,000m)
Large AUVs (>1,000m)
By Payload Type
Cameras
Sensors
Inertial Navigation System
Others
By Shape
Torpedo
Streamlined Rectangular Style
Laminar Flow Body
Multi-hull Vehicle
By Technology
Collision Avoidance
Navigation
Imaging
Communication
Propulsion
By Application
Scientific Research
Defense
Oil & Gas Industry
Request for Segment Customization as per your Business Requirement: Segment Customization Request
Regional Coverage:
North America
US
Canada
Mexico
Europe
Eastern Europe
Poland
Romania
Hungary
Turkey
Rest of Eastern Europe
Western Europe
Germany
France
UK
Italy
Spain
Netherlands
Switzerland
Austria
Rest of Western Europe
Asia Pacific
China
India
Japan
South Korea
Vietnam
Singapore
Australia
Rest of Asia Pacific
Middle East & Africa
Middle East
UAE
Egypt
Saudi Arabia
Qatar
Rest of Middle East
Africa
Nigeria
South Africa
Rest of Africa
Latin America
Brazil
Argentina
Colombia
Rest of Latin America
Request for Country Level Research Report: Country Level Customization Request
Available Customization
With the given market data, SNS Insider offers customization as per the company’s specific needs. The following customization options are available for the report:
Detailed Volume Analysis
Criss-Cross segment analysis (e.g. Product X Application)
Competitive Product Benchmarking
Geographic Analysis
Additional countries in any of the regions
Customized Data Representation
Detailed analysis and profiling of additional market players
The Thin Film Battery Market Size was valued at USD 0.45 Billion in 2023 and is expected to grow at a CAGR of 22.99% to reach USD 2.92 Billion by 2032.
The RFID Tags Market Size was valued at USD 12.42 Billion in 2023 and is expected to grow at a CAGR of 9.91% to reach USD 29.05 Billion by 2032.
The Industrial PC Market Size was USD 5.5 Billion in 2023 and is expected to reach USD 9.4 Billion by 2032 and grow at a CAGR of 5.9% by 2024-2032.
The Counterfeit Money Detection Market was valued at USD 3.55 billion in 2023 and is expected to reach USD 5.46 billion by 2032, growing at a CAGR of 4.90% from 2024 to 2032.
The Fire Protection System Market Size was valued at USD 67.35 billion in 2023, is projected to grow at 6.25% CAGR to reach USD 116.17 billion by 2032.
The 5G Device Testing Market was valued at USD 1.40 billion in 2023 and is expected to reach USD 2.59 billion by 2032, growing at a CAGR of 7.10% over the forecast period 2024-2032.

Hi! Click one of our member below to chat on Phone
© 2025 All Rights Reserved by SNS Insider Pvt Ltd


