image

Autonomous Data Platform Market Report Scope & Overview:
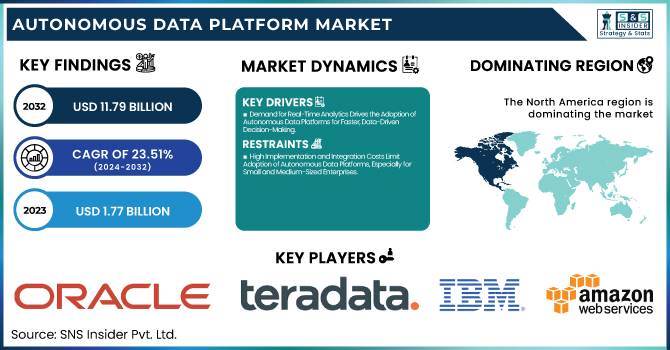
Autonomous Data Platform Market was valued at USD 1.77 billion in 2023 and is expected to reach USD 11.79 billion by 2032, growing at a CAGR of 23.51% from 2024-2032 

This growth is driven by key factors such as cross-platform integration, which supports effortless data handling across different systems. Trends in investment and funding are driving innovation, while AI-driven insights are improving decision-making. In addition, innovation and patent advancements spur the growth of the market through the provision of innovative solutions. Automation and data handling optimization result in cost savings, which are major advantages for adoption in numerous industries. The market is likely to see exponential growth as enterprises look for more scalable and intelligent data platforms for increased performance.

U.S. Autonomous Data Platform Market was valued at USD 0.46 billion in 2023 and is expected to reach USD 3.08 billion by 2032, growing at a CAGR of 23.45% from 2024-2032. The expansion of the U.S. Autonomous Data Platform Market is brought about by mounting demand for insights driven by data, analytics supported by AI, and automation by industries. Business enterprises look towards better decision-making abilities and budget-friendly data administration solutions, thereby autonomous platforms presenting simplified, expandable, and efficient alternatives. In addition, massive investments in AI, cross-platform advancements, and increasing requirements for real-time analysis are fueling adoption, making autonomous data platforms a must-have for contemporary business and digital transformation.

Market Dynamics

Drivers

  • Demand for Real-Time Analytics Drives the Adoption of Autonomous Data Platforms for Faster, Data-Driven Decision-Making.

The growing need for businesses to make rapid, data-based decisions has fueled the demand for real-time analytics solutions. Autonomous data platforms are well suited to fulfill this requirement by offering real-time insights without any human intervention. In the current competitive business environment, organizations need to process enormous amounts of data in real-time to react quickly to market changes, customer requirements, and operational issues. These platforms make data processing more efficient by automatically detecting patterns and trends, facilitating quicker decision-making. With digital transformation sweeping businesses, being able to make data analysis decisions on the fly, without any lag, is critical. Autonomous systems make a huge difference by cutting out manual labor, enabling businesses to tap into their data's full value and remain nimble in a rapidly changing landscape.

Restraints

  • High Implementation and Integration Costs Limit Adoption of Autonomous Data Platforms, Especially for Small and Medium-Sized Enterprises.

The use of autonomous data platforms usually involves a high-cost factor, mainly because of the large amount of money involved in setting up the system and integrating it. For small and medium-sized enterprises (SMEs), investing in such systems can be a big problem since the cost of these sophisticated solutions may be beyond their budgetary strength. Moreover, the integration of autonomous platforms with current IT infrastructure and legacy systems is potentially lengthy and complicated. The process of integrating these could involve specialized resources, again increasing the overall expense. Consequently, most companies may fear committing to such technology, particularly taking into account long-term cost sustainability. The combination of these costs and integration challenges can hold back the mass adoption of autonomous data platforms, especially by smaller organizations.

Opportunities

  • AI and Machine Learning Integration in Autonomous Data Platforms Enhances Data Insights, Predictive Analytics, and Decision-Making.

AI and machine learning integration within autonomous data platforms has a huge potential for companies to get greater insights out of their data. These technologies allow platforms to process large sets of data more effectively, spot patterns, and offer predictive analysis that can inform business decisions. Through the use of AI, these platforms can also enhance decision-making by streamlining complex tasks and making real-time recommendations. Machine learning builds on this by refining the accuracy of predictions as the system learns from new data over time. This capability to provide sophisticated, actionable insights enables businesses to remain competitive in fast-paced markets. As companies look for smarter solutions to handle their data, the implementation of AI and machine learning-driven autonomous platforms will transform industries with significant growth opportunities in the market.

Challenges

  • Ensuring Data Accuracy, Consistency, and Completeness in Autonomous Data Platforms is Critical for Reliable Insights and Decision-Making

Maintaining the accuracy, consistency, and completeness of data processed by autonomous data platforms is a complex task. As these platforms handle vast amounts of data from various sources, ensuring high-quality data becomes a critical factor for reliable insights. Poor-quality or inconsistent data can lead to inaccurate analysis, which, in turn, affects decision-making and business outcomes. Moreover, data from different systems and formats may not always align, causing issues in processing and interpretation. This can result in errors that compromise the platform’s effectiveness. Ensuring that data is cleaned, standardized, and validated before being processed by autonomous platforms requires significant effort and sophisticated tools. The inability to consistently manage and maintain high-quality data could limit the potential of autonomous platforms, hindering their growth in the market.

Segment Analysis

By Component

The Platform segment led the Autonomous Data Platform Market with the largest revenue share of around 70% in 2023. This is mainly because the demand for strong, scalable, and effective platforms that allow organizations to process, analyze, and handle huge sets of data independently is on the rise. These platforms provide imperative features such as real-time analytics, integration with AI, and automation, which give firms quicker decision-making ability and efficiency in operations, leading to their rapid adoption across sectors.

The Services segment is expected to grow at the fastest CAGR of approximately 24.93% during 2024-2032. The growth is spurred by the increasing need for consulting, implementation, and support services related to autonomous data platforms. With increasing adoption of these platforms by organizations, there is greater demand for specialized guidance in deployment, customization, and optimization. Support and maintenance services on a continuous basis also ensure seamless functioning and scalability of these platforms, driving the segment's high growth.

By Deployment

The On-premise segment held the largest revenue share of approximately 54% in 2023 in the Autonomous Data Platform Market. This is due to the option of large companies and organizations in highly regulated sectors for keeping total control over their data and infrastructure. On-premise solutions provide more security, customization, and adherence to strict regulatory compliance. They also provide stronger data privacy and performance, which makes them a top priority for organizations handling sensitive data.

The Cloud segment is anticipated to grow the fastest CAGR of approximately 24.45% during the period of 2024-2032. This is boosted by the rising demand for cloud-based options due to their flexibility, scalability, and affordability. Autonomous data platforms on the cloud enable enterprises to process huge amounts of data without investing in large-scale infrastructure. Furthermore, the trends toward remote work, digital transformation, and real-time analytics also boost the requirement for cloud-based platforms.

By Enterprise Size

The Large Enterprises segment led the Autonomous Data Platform Market with the largest revenue share of approximately 62% in 2023. Large businesses have usually immense data processing demands and intricate infrastructure needs, which prompt them to adopt autonomous data platforms early. The scalability, increased security, and automation such platforms offer help such organizations. Moreover, they tend to have the means and know-how to handle the integration and implementation of such sophisticated technologies, propelling their huge market share.

The SMEs segment will grow at the fastest CAGR of around 24.86% during 2024-2032. This growth is fueled by the rising affordability and availability of autonomous data platforms for smaller companies. With cloud-based solutions becoming increasingly common, SMEs are able to use these platforms without incurring substantial initial investments in infrastructure. Moreover, the requirement of real-time analytics and operational agility in SMEs is escalating, which is fueling their adoption of economical, automated data management solutions.

By End Use

The BFSI (Banking, Financial Services, and Insurance) segment dominated the Autonomous Data Platform Market with the highest revenue share of about 22% in 2023. This dominance is driven by the sector’s need for robust data management and analytics capabilities to handle vast amounts of financial data. Autonomous platforms help BFSI organizations enhance fraud detection, risk management, customer insights, and regulatory compliance, while improving operational efficiency and decision-making, making them crucial in this industry.

The Retail segment is expected to grow at the fastest CAGR of about 26.28% from 2024-2032. This growth is fueled by the increasing volume of customer data and the growing need for personalized experiences in retail. Autonomous data platforms enable retailers to analyze real-time customer behavior, optimize inventory, and enhance supply chain efficiency. As the retail sector embraces digital transformation, the demand for autonomous data solutions to improve customer engagement and operational efficiency will continue to rise.

Regional Analysis

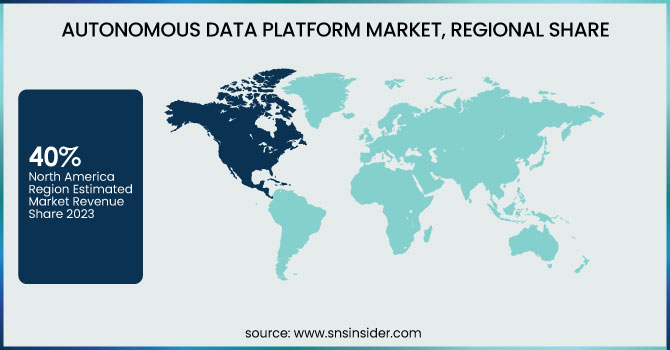
The North America region led the Autonomous Data Platform Market with the largest revenue percentage of around 40% in 2023. This leadership is due to the region's early adoption of cutting-edge technologies, powerful presence of prominent market players, and growing demand for automation in managing data across industries like BFSI, healthcare, and retail. Additionally, North America benefits from a well-established IT infrastructure, high investment in research and development, and a favorable regulatory environment, further driving market growth.

The Asia Pacific region is expected to grow at the fastest CAGR of approximately 25.20% during 2024-2032. This high growth is driven by the digital transformation projects in the region expanding, rising cloud technology adoption, and mounting demand for data-driven decision-making in sectors such as manufacturing, retail, and healthcare. Further, the emergence of SMEs and government initiatives to invest in technology infrastructure support the rising use of autonomous data platforms in the rapidly growing region.

Key Players

  • Oracle Corporation [Oracle Autonomous Database, Oracle Cloud Infrastructure]

  • Teradata [Teradata Vantage, Teradata IntelliCloud]

  • IBM Corporation [IBM Db2, IBM Cloud Pak for Data]

  • Amazon Web Services, Inc. [Amazon Redshift, AWS Data Pipeline]

  • Hewlett Packard Enterprise Development LP [HPE Ezmeral, HPE GreenLake]

  • Qubole, Inc. [Qubole Data Service, Qubole AI]

  • Cloudera, Inc. [Cloudera Data Platform, Cloudera Data Science Workbench]

  • Gemini Data [Gemini Data Cloud, Gemini Data Lake]

  • Denodo Technologies [Denodo Platform, Denodo Data Virtualization]

  • Alteryx, Inc. [Alteryx Designer, Alteryx Server]

  • Snowflake Inc. [Snowflake Data Cloud, Snowflake Data Marketplace]

  • Microsoft Corporation [Azure Synapse Analytics, Azure Data Factory]

  • Google LLC [BigQuery, Google Cloud Dataproc]

  • SAP SE [SAP Data Intelligence, SAP HANA Cloud]

  • Databricks [Databricks Unified Analytics Platform, Databricks Delta Lake]

  • Vertica [Vertica in Enterprise, Vertica in Eon Mode]

  • Informatica [Informatica Intelligent Cloud Services, Informatica Data Quality]

  • Hitachi Vantara [Hitachi Lumada DataOps, Hitachi Vantara Data Integration]

  • Domo, Inc. [Domo Business Cloud, Domo Data Governance]

  • Qlik [Qlik Sense, Qlik Data Integration]

Recent Developments:

  • In March 2025, AWS announced new advancements during AWS Pi Day, including Amazon Bedrock for generative AI, SageMaker Unified Studio, and Amazon S3 Tables, enhancing data integration and multi-agent collaboration for analytics and AI workloads.

  • In September 2024, Oracle announced the upcoming release of its Intelligent Data Lake as part of the Oracle Data Intelligence Platform, set for limited availability in 2025. This solution will offer a unified developer experience, integrating data orchestration, analytics, and AI.

Autonomous Data Platform Market Report Scope:

Report Attributes Details
Market Size in 2023 USD 1.77 Billion
Market Size by 2032 USD 11.79 Billion
CAGR CAGR of 23.51% From 2024 to 2032
Base Year 2023
Forecast Period 2024-2032
Historical Data 2020-2022
Report Scope & Coverage Market Size, Segments Analysis, Competitive  Landscape, Regional Analysis, DROC & SWOT Analysis, Forecast Outlook
Key Segments • By Component (Platform, Services)
• By Deployment (On-premise, Cloud)
• By Enterprise Size (Large Enterprises, SMEs)
• By End Use (BFSI, Healthcare, Retail, Manufacturing, IT and Telecom, Government, Others)
Regional Analysis/Coverage North America (US, Canada, Mexico), Europe (Eastern Europe [Poland, Romania, Hungary, Turkey, Rest of Eastern Europe] Western Europe] Germany, France, UK, Italy, Spain, Netherlands, Switzerland, Austria, Rest of Western Europe]), Asia Pacific (China, India, Japan, South Korea, Vietnam, Singapore, Australia, Rest of Asia Pacific), Middle East & Africa (Middle East [UAE, Egypt, Saudi Arabia, Qatar, Rest of Middle East], Africa [Nigeria, South Africa, Rest of Africa], Latin America (Brazil, Argentina, Colombia, Rest of Latin America)
Company Profiles Oracle Corporation, Teradata, IBM Corporation, Amazon Web Services, Inc., Hewlett Packard Enterprise Development LP, Qubole, Inc., Cloudera, Inc., Gemini Data, Denodo Technologies, Alteryx, Inc., Snowflake Inc., Microsoft Corporation, Google LLC, SAP SE, Databricks, Vertica, Informatica, Hitachi Vantara, Domo, Inc., Qlik

Frequently Asked Questions

ANS: Autonomous Data Platform Market was valued at USD 1.77 billion in 2023 and is expected to reach USD 11.79 billion by 2032, growing at a CAGR of 23.51% from 2024-2032.

ANS: The Platform segment dominated with a revenue share of about 70% in 2023.

ANS: The Services segment is expected to grow at a CAGR of 24.93% from 2024-2032.

ANS: The Cloud segment is expected to grow at a CAGR of 24.45% from 2024-2032.

ANS: The Asia Pacific region is expected to grow at a CAGR of 25.20% from 2024-2032.

Table of Contents

1. Introduction

1.1 Market Definition

1.2 Scope (Inclusion and Exclusions)

1.3 Research Assumptions

2. Executive Summary

2.1 Market Overview

2.2 Regional Synopsis

2.3 Competitive Summary

3. Research Methodology

3.1 Top-Down Approach

3.2 Bottom-up Approach

3.3. Data Validation

3.4 Primary Interviews

4. Market Dynamics Impact Analysis

4.1 Market Driving Factors Analysis

4.1.1 Drivers

4.1.2 Restraints

4.1.3 Opportunities

4.1.4 Challenges

4.2 PESTLE Analysis

4.3 Porter’s Five Forces Model

5. Statistical Insights and Trends Reporting

5.1 Cross-Platform Integration

5.2 Investment and Funding Trends

5.3 Innovation and Patents

5.4 Cost Savings

5.5 AI-Powered Insights

6. Competitive Landscape

6.1 List of Major Companies, By Region

6.2 Market Share Analysis, By Region

6.3 Product Benchmarking

6.3.1 Product specifications and features

6.3.2 Pricing

6.4 Strategic Initiatives

6.4.1 Marketing and promotional activities

6.4.2 Distribution and supply chain strategies

6.4.3 Expansion plans and new product launches

6.4.4 Strategic partnerships and collaborations

6.5 Technological Advancements

6.6 Market Positioning and Branding

7. Autonomous Data Platform Market Segmentation, By Component

7.1 Chapter Overview

7.2 Platform

7.2.1 Platform Market Trends Analysis (2020-2032)

7.2.2 Platform Market Size Estimates and Forecasts to 2032 (USD Billion)

7.3 Services

7.3.1 Services Market Trends Analysis (2020-2032)

7.3.2 Services Market Size Estimates and Forecasts to 2032 (USD Billion)

8. Autonomous Data Platform Market Segmentation, By Deployment

8.1 Chapter Overview

8.2 On-premise

8.2.1 On-premise Market Trends Analysis (2020-2032)

8.2.2 On-premise Market Size Estimates and Forecasts to 2032 (USD Billion)

8.3 Cloud

8.3.1 Cloud Market Trends Analysis (2020-2032)

8.3.2 Cloud Market Size Estimates and Forecasts to 2032 (USD Billion)

9. Autonomous Data Platform Market Segmentation, By End Use

9.1 Chapter Overview

9.2 BFSI

9.2.1 BFSI Market Trends Analysis (2020-2032)

9.2.2 BFSI Market Size Estimates and Forecasts to 2032 (USD Billion)

9.3 Healthcare

9.3.1 Healthcare Market Trends Analysis (2020-2032)

9.3.2 Healthcare Market Size Estimates and Forecasts to 2032 (USD Billion)

9.4 Retail

               9.4.1 Retail Market Trends Analysis (2020-2032)

9.4.2 Retail Market Size Estimates and Forecasts to 2032 (USD Billion)

9.5 Manufacturing

9.5.1 Manufacturing Market Trends Analysis (2020-2032)

9.5.2 Manufacturing Market Size Estimates and Forecasts to 2032 (USD Billion)

9.6 IT and Telecom

9.6.1 IT and Telecom Market Trends Analysis (2020-2032)

9.6.2 IT and Telecom Market Size Estimates and Forecasts to 2032 (USD Billion)

9.7 Government

9.7.1 Government Market Trends Analysis (2020-2032)

9.7.2 Government Market Size Estimates and Forecasts to 2032 (USD Billion)

9.8 Others

9.8.1 Others Market Trends Analysis (2020-2032)

9.8.2 Others Market Size Estimates and Forecasts to 2032 (USD Billion)

10. Autonomous Data Platform Market Segmentation, By Enterprise Size

10.1 Chapter Overview

10.2 Large Enterprises

10.2.1 Large Enterprises Market Trends Analysis (2020-2032)

10.2.2 Large Enterprises Market Size Estimates and Forecasts to 2032 (USD Billion)

10.3 SMEs

10.3.1 SMEs Market Trends Analysis (2020-2032)

10.3.2 SMEs Market Size Estimates and Forecasts to 2032 (USD Billion)

11. Regional Analysis

11.1 Chapter Overview

11.2 North America

11.2.1 Trends Analysis

11.2.2 North America Autonomous Data Platform Market Estimates and Forecasts, by Country (2020-2032) (USD Billion)

11.2.3 North America Autonomous Data Platform Market Estimates and Forecasts, By Component (2020-2032) (USD Billion) 

11.2.4 North America Autonomous Data Platform Market Estimates and Forecasts, By Deployment (2020-2032) (USD Billion)

11.2.5 North America Autonomous Data Platform Market Estimates and Forecasts, By End Use (2020-2032) (USD Billion)

11.2.6 North America Autonomous Data Platform Market Estimates and Forecasts, By Enterprise Size (2020-2032) (USD Billion)

11.2.7 USA

11.2.7.1 USA Autonomous Data Platform Market Estimates and Forecasts, By Component (2020-2032) (USD Billion)

11.2.7.2 USA Autonomous Data Platform Market Estimates and Forecasts, By Deployment (2020-2032) (USD Billion)

11.2.7.3 USA Autonomous Data Platform Market Estimates and Forecasts, By End Use (2020-2032) (USD Billion)

11.2.7.4 USA Autonomous Data Platform Market Estimates and Forecasts, By Enterprise Size (2020-2032) (USD Billion)

11.2.8 Canada

11.2.8.1 Canada Autonomous Data Platform Market Estimates and Forecasts, By Component (2020-2032) (USD Billion)

11.2.8.2 Canada Autonomous Data Platform Market Estimates and Forecasts, By Deployment (2020-2032) (USD Billion)

11.2.8.3 Canada Autonomous Data Platform Market Estimates and Forecasts, By End Use (2020-2032) (USD Billion)

11.2.8.4 Canada Autonomous Data Platform Market Estimates and Forecasts, By Enterprise Size (2020-2032) (USD Billion)

11.2.9 Mexico

11.2.9.1 Mexico Autonomous Data Platform Market Estimates and Forecasts, By Component (2020-2032) (USD Billion)

11.2.9.2 Mexico Autonomous Data Platform Market Estimates and Forecasts, By Deployment (2020-2032) (USD Billion)

11.2.9.3 Mexico Autonomous Data Platform Market Estimates and Forecasts, By End Use (2020-2032) (USD Billion)

11.2.9.4 Mexico Autonomous Data Platform Market Estimates and Forecasts, By Enterprise Size (2020-2032) (USD Billion)

11.3 Europe

11.3.1 Eastern Europe

11.3.1.1 Trends Analysis

11.3.1.2 Eastern Europe Autonomous Data Platform Market Estimates and Forecasts, by Country (2020-2032) (USD Billion)

11.3.1.3 Eastern Europe Autonomous Data Platform Market Estimates and Forecasts, By Component (2020-2032) (USD Billion) 

11.3.1.4 Eastern Europe Autonomous Data Platform Market Estimates and Forecasts, By Deployment (2020-2032) (USD Billion)

11.3.1.5 Eastern Europe Autonomous Data Platform Market Estimates and Forecasts, By End Use (2020-2032) (USD Billion)

11.3.1.6 Eastern Europe Autonomous Data Platform Market Estimates and Forecasts, By Enterprise Size (2020-2032) (USD Billion)

11.3.1.7 Poland

11.3.1.7.1 Poland Autonomous Data Platform Market Estimates and Forecasts, By Component (2020-2032) (USD Billion)

11.3.1.7.2 Poland Autonomous Data Platform Market Estimates and Forecasts, By Deployment (2020-2032) (USD Billion)

11.3.1.7.3 Poland Autonomous Data Platform Market Estimates and Forecasts, By End Use (2020-2032) (USD Billion)

11.3.1.7.4 Poland Autonomous Data Platform Market Estimates and Forecasts, By Enterprise Size (2020-2032) (USD Billion)

11.3.1.8 Romania

11.3.1.8.1 Romania Autonomous Data Platform Market Estimates and Forecasts, By Component (2020-2032) (USD Billion)

11.3.1.8.2 Romania Autonomous Data Platform Market Estimates and Forecasts, By Deployment (2020-2032) (USD Billion)

11.3.1.8.3 Romania Autonomous Data Platform Market Estimates and Forecasts, By End Use (2020-2032) (USD Billion)

11.3.1.8.4 Romania Autonomous Data Platform Market Estimates and Forecasts, By Enterprise Size (2020-2032) (USD Billion)

11.3.1.9 Hungary

11.3.1.9.1 Hungary Autonomous Data Platform Market Estimates and Forecasts, By Component (2020-2032) (USD Billion)

11.3.1.9.2 Hungary Autonomous Data Platform Market Estimates and Forecasts, By Deployment (2020-2032) (USD Billion)

11.3.1.9.3 Hungary Autonomous Data Platform Market Estimates and Forecasts, By End Use (2020-2032) (USD Billion)

11.3.1.9.4 Hungary Autonomous Data Platform Market Estimates and Forecasts, By Enterprise Size (2020-2032) (USD Billion)

11.3.1.10 Turkey

11.3.1.10.1 Turkey Autonomous Data Platform Market Estimates and Forecasts, By Component (2020-2032) (USD Billion)

11.3.1.10.2 Turkey Autonomous Data Platform Market Estimates and Forecasts, By Deployment (2020-2032) (USD Billion)

11.3.1.10.3 Turkey Autonomous Data Platform Market Estimates and Forecasts, By End Use (2020-2032) (USD Billion)

11.3.1.10.4 Turkey Autonomous Data Platform Market Estimates and Forecasts, By Enterprise Size (2020-2032) (USD Billion)

11.3.1.11 Rest of Eastern Europe

11.3.1.11.1 Rest of Eastern Europe Autonomous Data Platform Market Estimates and Forecasts, By Component (2020-2032) (USD Billion)

11.3.1.11.2 Rest of Eastern Europe Autonomous Data Platform Market Estimates and Forecasts, By Deployment (2020-2032) (USD Billion)

11.3.1.11.3 Rest of Eastern Europe Autonomous Data Platform Market Estimates and Forecasts, By End Use (2020-2032) (USD Billion)

11.3.1.11.4 Rest of Eastern Europe Autonomous Data Platform Market Estimates and Forecasts, By Enterprise Size (2020-2032) (USD Billion)

11.3.2 Western Europe

11.3.2.1 Trends Analysis

11.3.2.2 Western Europe Autonomous Data Platform Market Estimates and Forecasts, by Country (2020-2032) (USD Billion)

11.3.2.3 Western Europe Autonomous Data Platform Market Estimates and Forecasts, By Component (2020-2032) (USD Billion) 

11.3.2.4 Western Europe Autonomous Data Platform Market Estimates and Forecasts, By Deployment (2020-2032) (USD Billion)

11.3.2.5 Western Europe Autonomous Data Platform Market Estimates and Forecasts, By End Use (2020-2032) (USD Billion)

11.3.2.6 Western Europe Autonomous Data Platform Market Estimates and Forecasts, By Enterprise Size (2020-2032) (USD Billion)

11.3.2.7 Germany

11.3.2.7.1 Germany Autonomous Data Platform Market Estimates and Forecasts, By Component (2020-2032) (USD Billion)

11.3.2.7.2 Germany Autonomous Data Platform Market Estimates and Forecasts, By Deployment (2020-2032) (USD Billion)

11.3.2.7.3 Germany Autonomous Data Platform Market Estimates and Forecasts, By End Use (2020-2032) (USD Billion)

11.3.2.7.4 Germany Autonomous Data Platform Market Estimates and Forecasts, By Enterprise Size (2020-2032) (USD Billion)

11.3.2.8 France

11.3.2.8.1 France Autonomous Data Platform Market Estimates and Forecasts, By Component (2020-2032) (USD Billion)

11.3.2.8.2 France Autonomous Data Platform Market Estimates and Forecasts, By Deployment (2020-2032) (USD Billion)

11.3.2.8.3 France Autonomous Data Platform Market Estimates and Forecasts, By End Use (2020-2032) (USD Billion)

11.3.2.8.4 France Autonomous Data Platform Market Estimates and Forecasts, By Enterprise Size (2020-2032) (USD Billion)

11.3.2.9 UK

11.3.2.9.1 UK Autonomous Data Platform Market Estimates and Forecasts, By Component (2020-2032) (USD Billion)

11.3.2.9.2 UK Autonomous Data Platform Market Estimates and Forecasts, By Deployment (2020-2032) (USD Billion)

11.3.2.9.3 UK Autonomous Data Platform Market Estimates and Forecasts, By End Use (2020-2032) (USD Billion)

11.3.2.9.4 UK Autonomous Data Platform Market Estimates and Forecasts, By Enterprise Size (2020-2032) (USD Billion)

11.3.2.10 Italy

11.3.2.10.1 Italy Autonomous Data Platform Market Estimates and Forecasts, By Component (2020-2032) (USD Billion)

11.3.2.10.2 Italy Autonomous Data Platform Market Estimates and Forecasts, By Deployment (2020-2032) (USD Billion)

11.3.2.10.3 Italy Autonomous Data Platform Market Estimates and Forecasts, By End Use (2020-2032) (USD Billion)

11.3.2.10.4 Italy Autonomous Data Platform Market Estimates and Forecasts, By Enterprise Size (2020-2032) (USD Billion)

11.3.2.11 Spain

11.3.2.11.1 Spain Autonomous Data Platform Market Estimates and Forecasts, By Component (2020-2032) (USD Billion)

11.3.2.11.2 Spain Autonomous Data Platform Market Estimates and Forecasts, By Deployment (2020-2032) (USD Billion)

11.3.2.11.3 Spain Autonomous Data Platform Market Estimates and Forecasts, By End Use (2020-2032) (USD Billion)

11.3.2.11.4 Spain Autonomous Data Platform Market Estimates and Forecasts, By Enterprise Size (2020-2032) (USD Billion)

11.3.2.12 Netherlands

11.3.2.12.1 Netherlands Autonomous Data Platform Market Estimates and Forecasts, By Component (2020-2032) (USD Billion)

11.3.2.12.2 Netherlands Autonomous Data Platform Market Estimates and Forecasts, By Deployment (2020-2032) (USD Billion)

11.3.2.12.3 Netherlands Autonomous Data Platform Market Estimates and Forecasts, By End Use (2020-2032) (USD Billion)

11.3.2.12.4 Netherlands Autonomous Data Platform Market Estimates and Forecasts, By Enterprise Size (2020-2032) (USD Billion)

11.3.2.13 Switzerland

11.3.2.13.1 Switzerland Autonomous Data Platform Market Estimates and Forecasts, By Component (2020-2032) (USD Billion)

11.3.2.13.2 Switzerland Autonomous Data Platform Market Estimates and Forecasts, By Deployment (2020-2032) (USD Billion)

11.3.2.13.3 Switzerland Autonomous Data Platform Market Estimates and Forecasts, By End Use (2020-2032) (USD Billion)

11.3.2.13.4 Switzerland Autonomous Data Platform Market Estimates and Forecasts, By Enterprise Size (2020-2032) (USD Billion)

11.3.2.14 Austria

11.3.2.14.1 Austria Autonomous Data Platform Market Estimates and Forecasts, By Component (2020-2032) (USD Billion)

11.3.2.14.2 Austria Autonomous Data Platform Market Estimates and Forecasts, By Deployment (2020-2032) (USD Billion)

11.3.2.14.3 Austria Autonomous Data Platform Market Estimates and Forecasts, By End Use (2020-2032) (USD Billion)

11.3.2.14.4 Austria Autonomous Data Platform Market Estimates and Forecasts, By Enterprise Size (2020-2032) (USD Billion)

11.3.2.15 Rest of Western Europe

11.3.2.15.1 Rest of Western Europe Autonomous Data Platform Market Estimates and Forecasts, By Component (2020-2032) (USD Billion)

11.3.2.15.2 Rest of Western Europe Autonomous Data Platform Market Estimates and Forecasts, By Deployment (2020-2032) (USD Billion)

11.3.2.15.3 Rest of Western Europe Autonomous Data Platform Market Estimates and Forecasts, By End Use (2020-2032) (USD Billion)

11.3.2.15.4 Rest of Western Europe Autonomous Data Platform Market Estimates and Forecasts, By Enterprise Size (2020-2032) (USD Billion)

11.4 Asia Pacific

11.4.1 Trends Analysis

11.4.2 Asia Pacific Autonomous Data Platform Market Estimates and Forecasts, by Country (2020-2032) (USD Billion)

11.4.3 Asia Pacific Autonomous Data Platform Market Estimates and Forecasts, By Component (2020-2032) (USD Billion) 

11.4.4 Asia Pacific Autonomous Data Platform Market Estimates and Forecasts, By Deployment (2020-2032) (USD Billion)

11.4.5 Asia Pacific Autonomous Data Platform Market Estimates and Forecasts, By End Use (2020-2032) (USD Billion)

11.4.6 Asia Pacific Autonomous Data Platform Market Estimates and Forecasts, By Enterprise Size (2020-2032) (USD Billion)

11.4.7 China

11.4.7.1 China Autonomous Data Platform Market Estimates and Forecasts, By Component (2020-2032) (USD Billion)

11.4.7.2 China Autonomous Data Platform Market Estimates and Forecasts, By Deployment (2020-2032) (USD Billion)

11.4.7.3 China Autonomous Data Platform Market Estimates and Forecasts, By End Use (2020-2032) (USD Billion)

11.4.7.4 China Autonomous Data Platform Market Estimates and Forecasts, By Enterprise Size (2020-2032) (USD Billion)

11.4.8 India

11.4.8.1 India Autonomous Data Platform Market Estimates and Forecasts, By Component (2020-2032) (USD Billion)

11.4.8.2 India Autonomous Data Platform Market Estimates and Forecasts, By Deployment (2020-2032) (USD Billion)

11.4.8.3 India Autonomous Data Platform Market Estimates and Forecasts, By End Use (2020-2032) (USD Billion)

11.4.8.4 India Autonomous Data Platform Market Estimates and Forecasts, By Enterprise Size (2020-2032) (USD Billion)

11.4.9 Japan

11.4.9.1 Japan Autonomous Data Platform Market Estimates and Forecasts, By Component (2020-2032) (USD Billion)

11.4.9.2 Japan Autonomous Data Platform Market Estimates and Forecasts, By Deployment (2020-2032) (USD Billion)

11.4.9.3 Japan Autonomous Data Platform Market Estimates and Forecasts, By End Use (2020-2032) (USD Billion)

11.4.9.4 Japan Autonomous Data Platform Market Estimates and Forecasts, By Enterprise Size (2020-2032) (USD Billion)

11.4.10 South Korea

11.4.10.1 South Korea Autonomous Data Platform Market Estimates and Forecasts, By Component (2020-2032) (USD Billion)

11.4.10.2 South Korea Autonomous Data Platform Market Estimates and Forecasts, By Deployment (2020-2032) (USD Billion)

11.4.10.3 South Korea Autonomous Data Platform Market Estimates and Forecasts, By End Use (2020-2032) (USD Billion)

11.4.10.4 South Korea Autonomous Data Platform Market Estimates and Forecasts, By Enterprise Size (2020-2032) (USD Billion)

11.4.11 Vietnam

11.4.11.1 Vietnam Autonomous Data Platform Market Estimates and Forecasts, By Component (2020-2032) (USD Billion)

11.4.11.2 Vietnam Autonomous Data Platform Market Estimates and Forecasts, By Deployment (2020-2032) (USD Billion)

11.4.11.3 Vietnam Autonomous Data Platform Market Estimates and Forecasts, By End Use (2020-2032) (USD Billion)

11.4.11.4 Vietnam Autonomous Data Platform Market Estimates and Forecasts, By Enterprise Size (2020-2032) (USD Billion)

11.4.12 Singapore

11.4.12.1 Singapore Autonomous Data Platform Market Estimates and Forecasts, By Component (2020-2032) (USD Billion)

11.4.12.2 Singapore Autonomous Data Platform Market Estimates and Forecasts, By Deployment (2020-2032) (USD Billion)

11.4.12.3 Singapore Autonomous Data Platform Market Estimates and Forecasts, By End Use (2020-2032) (USD Billion)

11.4.12.4 Singapore Autonomous Data Platform Market Estimates and Forecasts, By Enterprise Size (2020-2032) (USD Billion)

11.4.13 Australia

11.4.13.1 Australia Autonomous Data Platform Market Estimates and Forecasts, By Component (2020-2032) (USD Billion)

11.4.13.2 Australia Autonomous Data Platform Market Estimates and Forecasts, By Deployment (2020-2032) (USD Billion)

11.4.13.3 Australia Autonomous Data Platform Market Estimates and Forecasts, By End Use (2020-2032) (USD Billion)

11.4.13.4 Australia Autonomous Data Platform Market Estimates and Forecasts, By Enterprise Size (2020-2032) (USD Billion)

11.4.14 Rest of Asia Pacific

11.4.14.1 Rest of Asia Pacific Autonomous Data Platform Market Estimates and Forecasts, By Component (2020-2032) (USD Billion)

11.4.14.2 Rest of Asia Pacific Autonomous Data Platform Market Estimates and Forecasts, By Deployment (2020-2032) (USD Billion)

11.4.14.3 Rest of Asia Pacific Autonomous Data Platform Market Estimates and Forecasts, By End Use (2020-2032) (USD Billion)

11.4.14.4 Rest of Asia Pacific Autonomous Data Platform Market Estimates and Forecasts, By Enterprise Size (2020-2032) (USD Billion)

11.5 Middle East and Africa

11.5.1 Middle East

11.5.1.1 Trends Analysis

11.5.1.2 Middle East Autonomous Data Platform Market Estimates and Forecasts, by Country (2020-2032) (USD Billion)

11.5.1.3 Middle East Autonomous Data Platform Market Estimates and Forecasts, By Component (2020-2032) (USD Billion) 

11.5.1.4 Middle East Autonomous Data Platform Market Estimates and Forecasts, By Deployment (2020-2032) (USD Billion)

11.5.1.5 Middle East Autonomous Data Platform Market Estimates and Forecasts, By End Use (2020-2032) (USD Billion)

11.5.1.6 Middle East Autonomous Data Platform Market Estimates and Forecasts, By Enterprise Size (2020-2032) (USD Billion)

11.5.1.7 UAE

11.5.1.7.1 UAE Autonomous Data Platform Market Estimates and Forecasts, By Component (2020-2032) (USD Billion)

11.5.1.7.2 UAE Autonomous Data Platform Market Estimates and Forecasts, By Deployment (2020-2032) (USD Billion)

11.5.1.7.3 UAE Autonomous Data Platform Market Estimates and Forecasts, By End Use (2020-2032) (USD Billion)

11.5.1.7.4 UAE Autonomous Data Platform Market Estimates and Forecasts, By Enterprise Size  (2020-2032) (USD Billion)

11.5.1.8 Egypt

11.5.1.8.1 Egypt Autonomous Data Platform Market Estimates and Forecasts, By Component (2020-2032) (USD Billion)

11.5.1.8.2 Egypt Autonomous Data Platform Market Estimates and Forecasts, By Deployment (2020-2032) (USD Billion)

11.5.1.8.3 Egypt Autonomous Data Platform Market Estimates and Forecasts, By End Use (2020-2032) (USD Billion)

11.5.1.8.4 Egypt Autonomous Data Platform Market Estimates and Forecasts, By Enterprise Size (2020-2032) (USD Billion)

11.5.1.9 Saudi Arabia

11.5.1.9.1 Saudi Arabia Autonomous Data Platform Market Estimates and Forecasts, By Component (2020-2032) (USD Billion)

11.5.1.9.2 Saudi Arabia Autonomous Data Platform Market Estimates and Forecasts, By Deployment (2020-2032) (USD Billion)

11.5.1.9.3 Saudi Arabia Autonomous Data Platform Market Estimates and Forecasts, By End Use (2020-2032) (USD Billion)

11.5.1.9.4 Saudi Arabia Autonomous Data Platform Market Estimates and Forecasts, By Enterprise Size (2020-2032) (USD Billion)

11.5.1.10 Qatar

11.5.1.10.1 Qatar Autonomous Data Platform Market Estimates and Forecasts, By Component (2020-2032) (USD Billion)

11.5.1.10.2 Qatar Autonomous Data Platform Market Estimates and Forecasts, By Deployment (2020-2032) (USD Billion)

11.5.1.10.3 Qatar Autonomous Data Platform Market Estimates and Forecasts, By End Use (2020-2032) (USD Billion)

11.5.1.10.4 Qatar Autonomous Data Platform Market Estimates and Forecasts, By Enterprise Size (2020-2032) (USD Billion)

11.5.1.11 Rest of Middle East

11.5.1.11.1 Rest of Middle East Autonomous Data Platform Market Estimates and Forecasts, By Component (2020-2032) (USD Billion)

11.5.1.11.2 Rest of Middle East Autonomous Data Platform Market Estimates and Forecasts, By Deployment (2020-2032) (USD Billion)

11.5.1.11.3 Rest of Middle East Autonomous Data Platform Market Estimates and Forecasts, By End Use (2020-2032) (USD Billion)

11.5.1.11.4 Rest of Middle East Autonomous Data Platform Market Estimates and Forecasts, By Enterprise Size (2020-2032) (USD Billion)

11.5.2 Africa

11.5.2.1 Trends Analysis

11.5.2.2 Africa Autonomous Data Platform Market Estimates and Forecasts, by Country (2020-2032) (USD Billion)

11.5.2.3 Africa Autonomous Data Platform Market Estimates and Forecasts, By Component (2020-2032) (USD Billion) 

11.5.2.4 Africa Autonomous Data Platform Market Estimates and Forecasts, By Deployment (2020-2032) (USD Billion)

11.5.2.5 Africa Autonomous Data Platform Market Estimates and Forecasts, By End Use (2020-2032) (USD Billion)

11.5.2.6 Africa Autonomous Data Platform Market Estimates and Forecasts, By Enterprise Size (2020-2032) (USD Billion)

11.5.2.7 South Africa

11.5.2.7.1 South Africa Autonomous Data Platform Market Estimates and Forecasts, By Component (2020-2032) (USD Billion)

11.5.2.7.2 South Africa Autonomous Data Platform Market Estimates and Forecasts, By Deployment (2020-2032) (USD Billion)

11.5.2.7.3 South Africa Autonomous Data Platform Market Estimates and Forecasts, By End Use (2020-2032) (USD Billion)

11.5.2.7.4 South Africa Autonomous Data Platform Market Estimates and Forecasts, By Enterprise Size (2020-2032) (USD Billion)

11.5.2.8 Nigeria

11.5.2.8.1 Nigeria Autonomous Data Platform Market Estimates and Forecasts, By Component (2020-2032) (USD Billion)

11.5.2.8.2 Nigeria Autonomous Data Platform Market Estimates and Forecasts, By Deployment (2020-2032) (USD Billion)

11.5.2.8.3 Nigeria Autonomous Data Platform Market Estimates and Forecasts, By End Use (2020-2032) (USD Billion)

11.5.2.8.4 Nigeria Autonomous Data Platform Market Estimates and Forecasts, By Enterprise Size (2020-2032) (USD Billion)

11.5.2.9 Rest of Africa

11.5.2.9.1 Rest of Africa Autonomous Data Platform Market Estimates and Forecasts, By Component (2020-2032) (USD Billion)

11.5.2.9.2 Rest of Africa Autonomous Data Platform Market Estimates and Forecasts, By Deployment (2020-2032) (USD Billion)

11.5.2.9.3 Rest of Africa Autonomous Data Platform Market Estimates and Forecasts, By End Use (2020-2032) (USD Billion)

11.5.2.9.4 Rest of Africa Autonomous Data Platform Market Estimates and Forecasts, By Enterprise Size (2020-2032) (USD Billion)

11.6 Latin America

11.6.1 Trends Analysis

11.6.2 Latin America Autonomous Data Platform Market Estimates and Forecasts, by Country (2020-2032) (USD Billion)

11.6.3 Latin America Autonomous Data Platform Market Estimates and Forecasts, By Component (2020-2032) (USD Billion) 

11.6.4 Latin America Autonomous Data Platform Market Estimates and Forecasts, By Deployment (2020-2032) (USD Billion)

11.6.5 Latin America Autonomous Data Platform Market Estimates and Forecasts, By End Use (2020-2032) (USD Billion)

11.6.6 Latin America Autonomous Data Platform Market Estimates and Forecasts, By Enterprise Size (2020-2032) (USD Billion)

11.6.7 Brazil

11.6.7.1 Brazil Autonomous Data Platform Market Estimates and Forecasts, By Component (2020-2032) (USD Billion)

11.6.7.2 Brazil Autonomous Data Platform Market Estimates and Forecasts, By Deployment (2020-2032) (USD Billion)

11.6.7.3 Brazil Autonomous Data Platform Market Estimates and Forecasts, By End Use (2020-2032) (USD Billion)

11.6.7.4 Brazil Autonomous Data Platform Market Estimates and Forecasts, By Enterprise Size (2020-2032) (USD Billion)

11.6.8 Argentina

11.6.8.1 Argentina Autonomous Data Platform Market Estimates and Forecasts, By Component (2020-2032) (USD Billion)

11.6.8.2 Argentina Autonomous Data Platform Market Estimates and Forecasts, By Deployment (2020-2032) (USD Billion)

11.6.8.3 Argentina Autonomous Data Platform Market Estimates and Forecasts, By End Use (2020-2032) (USD Billion)

11.6.8.4 Argentina Autonomous Data Platform Market Estimates and Forecasts, By Enterprise Size (2020-2032) (USD Billion)

11.6.9 Colombia

11.6.9.1 Colombia Autonomous Data Platform Market Estimates and Forecasts, By Component (2020-2032) (USD Billion)

11.6.9.2 Colombia Autonomous Data Platform Market Estimates and Forecasts, By Deployment (2020-2032) (USD Billion)

11.6.9.3 Colombia Autonomous Data Platform Market Estimates and Forecasts, By End Use (2020-2032) (USD Billion)

11.6.9.4 Colombia Autonomous Data Platform Market Estimates and Forecasts, By Enterprise Size (2020-2032) (USD Billion)

11.6.10 Rest of Latin America

11.6.10.1 Rest of Latin America Autonomous Data Platform Market Estimates and Forecasts, By Component (2020-2032) (USD Billion)

11.6.10.2 Rest of Latin America Autonomous Data Platform Market Estimates and Forecasts, By Deployment (2020-2032) (USD Billion)

11.6.10.3 Rest of Latin America Autonomous Data Platform Market Estimates and Forecasts, By End Use (2020-2032) (USD Billion)

11.6.10.4 Rest of Latin America Autonomous Data Platform Market Estimates and Forecasts, By Enterprise Size (2020-2032) (USD Billion)

12. Company Profiles

12.1 Oracle Corporation

12.1.1 Company Overview

12.1.2 Financial

12.1.3 Products/ Services Offered

12.1.4 SWOT Analysis

12.2 Teradata

12.2.1 Company Overview

12.2.2 Financial

12.2.3 Products/ Services Offered

12.2.4 SWOT Analysis

12.3 IBM Corporation

12.3.1 Company Overview

12.3.2 Financial

12.3.3 Products/ Services Offered

12.3.4 SWOT Analysis

12.4 Amazon Web Services, Inc.

12.4.1 Company Overview

12.4.2 Financial

12.4.3 Products/ Services Offered

12.4.4 SWOT Analysis

12.5 Hewlett Packard Enterprise Development LP

12.5.1 Company Overview

12.5.2 Financial

12.5.3 Products/ Services Offered

12.5.4 SWOT Analysis

12.6 Qubole, Inc.

12.6.1 Company Overview

12.6.2 Financial

12.6.3 Products/ Services Offered

12.6.4 SWOT Analysis

12.7 Cloudera, Inc.

12.7.1 Company Overview

12.7.2 Financial

12.7.3 Products/ Services Offered

12.7.4 SWOT Analysis

12.8 Gemini Data

12.8.1 Company Overview

12.8.2 Financial

12.8.3 Products/ Services Offered

12.8.4 SWOT Analysis

12.9 Denodo Technologies

12.9.1 Company Overview

12.9.2 Financial

12.9.3 Products/ Services Offered

12.9.4 SWOT Analysis

12.10 Alteryx, Inc.

12.10.1 Company Overview

12.10.2 Financial

12.10.3 Products/ Services Offered

12.10.4 SWOT Analysis

13. Use Cases and Best Practices

14. Conclusion

An accurate research report requires proper strategizing as well as implementation. There are multiple factors involved in the completion of good and accurate research report and selecting the best methodology to compete the research is the toughest part. Since the research reports we provide play a crucial role in any company’s decision-making process, therefore we at SNS Insider always believe that we should choose the best method which gives us results closer to reality. This allows us to reach at a stage wherein we can provide our clients best and accurate investment to output ratio.

Each report that we prepare takes a timeframe of 350-400 business hours for production. Starting from the selection of titles through a couple of in-depth brain storming session to the final QC process before uploading our titles on our website we dedicate around 350 working hours. The titles are selected based on their current market cap and the foreseen CAGR and growth.


The 5 steps process:

Step 1: Secondary Research:

Secondary Research or Desk Research is as the name suggests is a research process wherein, we collect data through the readily available information. In this process we use various paid and unpaid databases which our team has access to and gather data through the same. This includes examining of listed companies’ annual reports, Journals, SEC filling etc. Apart from this our team has access to various associations across the globe across different industries. Lastly, we have exchange relationships with various university as well as individual libraries.

Secondary Research

Step 2: Primary Research

When we talk about primary research, it is a type of study in which the researchers collect relevant data samples directly, rather than relying on previously collected data.  This type of research is focused on gaining content specific facts that can be sued to solve specific problems. Since the collected data is fresh and first hand therefore it makes the study more accurate and genuine.

We at SNS Insider have divided Primary Research into 2 parts.

Part 1 wherein we interview the KOLs of major players as well as the upcoming ones across various geographic regions. This allows us to have their view over the market scenario and acts as an important tool to come closer to the accurate market numbers. As many as 45 paid and unpaid primary interviews are taken from both the demand and supply side of the industry to make sure we land at an accurate judgement and analysis of the market.

This step involves the triangulation of data wherein our team analyses the interview transcripts, online survey responses and observation of on filed participants. The below mentioned chart should give a better understanding of the part 1 of the primary interview.

Primary Research

Part 2: In this part of primary research the data collected via secondary research and the part 1 of the primary research is validated with the interviews from individual consultants and subject matter experts.

Consultants are those set of people who have at least 12 years of experience and expertise within the industry whereas Subject Matter Experts are those with at least 15 years of experience behind their back within the same space. The data with the help of two main processes i.e., FGDs (Focused Group Discussions) and IDs (Individual Discussions). This gives us a 3rd party nonbiased primary view of the market scenario making it a more dependable one while collation of the data pointers.

Step 3: Data Bank Validation

Once all the information is collected via primary and secondary sources, we run that information for data validation. At our intelligence centre our research heads track a lot of information related to the market which includes the quarterly reports, the daily stock prices, and other relevant information. Our data bank server gets updated every fortnight and that is how the information which we collected using our primary and secondary information is revalidated in real time.

Data Bank Validation

Step 4: QA/QC Process

After all the data collection and validation our team does a final level of quality check and quality assurance to get rid of any unwanted or undesired mistakes. This might include but not limited to getting rid of the any typos, duplication of numbers or missing of any important information. The people involved in this process include technical content writers, research heads and graphics people. Once this process is completed the title gets uploader on our platform for our clients to read it.

Step 5: Final QC/QA Process:

This is the last process and comes when the client has ordered the study. In this process a final QA/QC is done before the study is emailed to the client. Since we believe in giving our clients a good experience of our research studies, therefore, to make sure that we do not lack at our end in any way humanly possible we do a final round of quality check and then dispatch the study to the client.

Key Segments:

By Component

    • Platform

    • Services

By Deployment

    • On-premise

    • Cloud

By Enterprise Size

    • Large Enterprises

    • SMEs

By End Use

    • BFSI

    • Healthcare

    • Retail

    • Manufacturing

    • IT and Telecom

    • Government

    • Others

Request for Segment Customization as per your Business Requirement: Segment Customization Request

Regional Coverage:

North America

  • US

  • Canada

  • Mexico

Europe

  • Eastern Europe

    • Poland

    • Romania

    • Hungary

    • Turkey

    • Rest of Eastern Europe

  • Western Europe

    • Germany

    • France

    • UK

    • Italy

    • Spain

    • Netherlands

    • Switzerland

    • Austria

    • Rest of Western Europe

Asia Pacific

  • China

  • India

  • Japan

  • South Korea

  • Vietnam

  • Singapore

  • Australia

  • Rest of Asia Pacific

Middle East & Africa

  • Middle East

    • UAE

    • Egypt

    • Saudi Arabia

    • Qatar

    • Rest of Middle East

  • Africa

    • Nigeria

    • South Africa

    • Rest of Africa

Latin America

  • Brazil

  • Argentina

  • Colombia

  • Rest of Latin America

Request for Country Level Research Report: Country Level Customization Request

Available Customization

With the given market data, SNS Insider offers customization as per the company’s specific needs. The following customization options are available for the report:

  • Detailed Volume Analysis

  • Criss-Cross segment analysis (e.g. Product X Application)

  • Competitive Product Benchmarking

  • Geographic Analysis

  • Additional countries in any of the regions

  • Customized Data Representation

  • Detailed analysis and profiling of additional market players


  •            5000 (33% Discount)


  •            8950 (40% Discount)


  •            3050 (23% Discount)

Start a Conversation

Hi! Click one of our member below to chat on Phone