To Get More Information on Automotive Virtual Reality Market - Request Sample Report
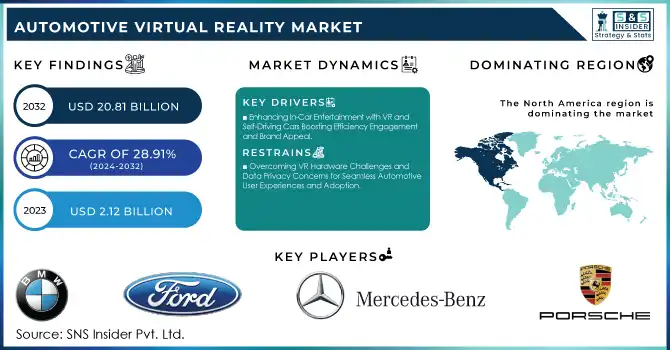
The Automotive Virtual Reality Market Size was valued at USD 2.12 Billion in 2023 and is expected to reach USD 20.81 Billion by 2032 and grow at a CAGR of 28.91% over the forecast period 2024-2032.
Automotive Virtual Reality is immensely influencing different aspects of the automotive industry making the automotive VR market advance with a greater growth rate. The company is reimagining how vehicle design, construction, and customer interaction will look like through the use of VR technology. VR simulations allow automakers to speed up design and test stages and allow engineers to test parts of vehicles virtually before making a physical prototype. It helps you minimize the costs, decrease the time-to-market phase, and reduce the risk of a design error. Moreover, VR is used in assembling lines by simulating a practical scenario to train the employees which, in return enhances the skillsets along with safety. The landscape of automotive virtual reality (VR) is robustly impacted in 2023-2024 as BMW, Ford, and Tesla save 20-30% of the product development time and maximize 50% of cost savings with the usage of VR tools. Technician VR training has become broad, with Ford using VR to train more than 3,000 engineers for testing and assembly line scenarios. Further, there has been a 30% reduction in design mistakes and a 40% quicker time-to-market for new vehicle functionalities aided by VR.
VR is transforming the vehicle buying experience in the consumer space. Virtual parameters such as here now enable VR-based test drives so you can take a stroll down whatever automotive street of your dreams too, which any automotive showroom could now embed for users to be able to explore various models and configure many features of their potential new cars without the need for inventory. In Advanced Driver Assistance Systems (ADAS), virtual reality is used to create driving environments for the testing and development of autonomous functions. So, this helps in the design and buying experience, and it also drives creativity in things such as vehicle safety and driver assistance, which is why VR is so widely adopted in the automotive industry. 10 out of 14 ADAS features in the U.S. surpassed 50% market penetration, with 5 features (including forward collision warning, automatic emergency braking, and pedestrian detection) reaching 91%-94% adoption. Additionally, technologies like lane keeping assistance, adaptive cruise control, and blind-spot warning also gained significant traction, each surpassing 50% penetration in new vehicles.
KEY DRIVERS:
Enhancing In-Car Entertainment with VR and Self-Driving Cars Boosting Efficiency Engagement and Brand Appeal
Growing emphasis on improving in-vehicle entertainment systems is one of the major factors boosting the growth of the automotive virtual reality market. Since today's consumers expect more, automakers are using VR to reshape in-car entertainment, especially in passenger, self-driving cars where people can enjoy media in transit. Self-driving cars are predicted to reduce traffic congestion by up to 11%, improve fuel efficiency by as much as 20%, and lower insurance premiums by up to 40% due to their enhanced safety features. Their ability to communicate with each other and their 360-degree sensor systems also minimize blind spots and enable quicker reaction times compared to human drivers. With VR, unique entertainment experiences such as 360-degree virtual tours, interactive games, and simulations can provide passengers with a fully immersive environment. This is very appealing with its tech-savvy users and families and helps brands stand out. Higher speed 5G connectivity makes VR in-car entertainment even more interesting by enabling high-quality streaming and real-time interaction in vehicles, increasing VR integration demand.
Revolutionizing Car Shopping with VR Showrooms Enhancing Customer Engagement and Boosting Conversion Rates by 40%
The growing demand for VR in automotive showrooms and dealerships for marketing and branding is another major driver for the market. Virtual reality technology provides potential buyers the ability to get a feel for varying car models, colors, and configurations in a virtual space, creating an engaging and unforgettable shopping experience. VR reduces the burden of carrying cars in a showroom or dealership as it allows the customer to see a larger variety of options without the need to have these physical models at hand. VR can also improve brand engagement by allowing a user to “test drive” and/or inspect the features of a particular car in a virtual environment. This is particularly well suited for luxury and electric vehicles, where VR can deliver the sophisticated technology and special characteristics of the vehicle excitingly. As consumers increasingly demand personalized and digitally oriented experiences, the auto industry is adapting to these expectations, and the market to support VR-accessible showrooms has increased. VR technology allows customers to explore different car models, colors, and features in a virtual environment, eliminating the need for physical models on-site. This immersive experience has been shown to boost conversion rates by 40%, as it encourages deeper engagement through personalized and interactive elements.
RESTRAIN:
Overcoming VR Hardware Challenges and Data Privacy Concerns for Seamless Automotive User Experiences and Adoption
The automotive VR market is still constrained because of the requirement for advanced technologies in the associated hardware to develop seamless high-definition user experiences. Effective use of VR in automotive applications invariably necessitates high-resolution displays, low latency, and realistic graphics from these devices. That would make sense, considering several VR headsets and components available today continue struggling in areas like consistent performance, motion tracking, and field-of-view. This motion sickness and discomfort can deter users from adopting these technologies that are necessary to get the ball rolling. Data privacy and security concerns around VR technology in vehicles are another challenge. With the potential of gathering user information and integrating with various systems already present in the car, VR may create a vast chasm of data vulnerability and privacy concerns. Automakers are faced with the challenge of addressing these risks by implementing thorough data protection measures, which can be fairly time-consuming and complex. But for the industry as a whole, this balance between an immersive VR experience and user privacy is still tricky.
BY TECHNOLOGY
Advanced driver assistance systems (ADAS) segment accounted for 35% of the automotive virtual reality market in 2023 and are estimated to show the fastest CAGR between 2024 and 2032. The presence of AR and VR technologies across the ADAS technology segment is based on the importance of ADAS in offering enhanced vehicle safety, performance, and driving experience through VR-enabled simulations and testing environments. VR aids the development and refinement of advanced driver assistance systems features such as collision avoidance, lane-keeping assistance, and adaptive cruise control, allowing manufacturers to test these features in highly controlled settings As automotive manufacturers work to construct more intelligent and safer vehicles, VR can play a pivotal factor in growing and refining ADAS functions. With these VR simulations, a single ADAS component can be tested thousands of times in extensive sessions because there is no risk to driver safety and no liability to be dealt with resulting from a malfunction. The benefits of VR on ADAS development also fundamentally help systems related to autonomous driving as well. By allowing algorithms to practice in thousands of different potential driving scenarios, many of which may never be encountered in the real world but are critical for a safe driving AI, such as difficult weather or rare occurrences, these artificial, VR simulations are key aspects of the training process that do not require physical test vehicles.
BY COMPONENT
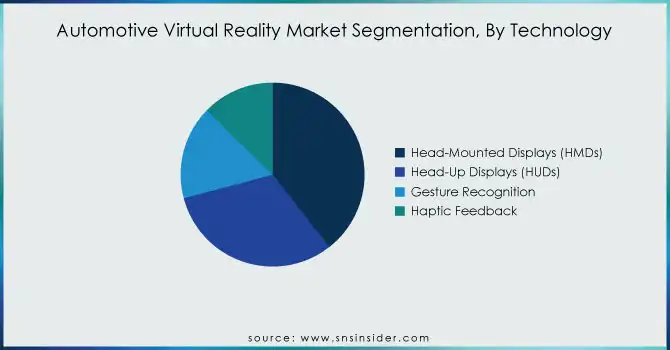
Head-Mounted Displays (HMDs), held a 39% market share in 2023. HMDs also leverage the depth of immersion for more complex simulations in the automotive sector along with the more traditional in-vehicle experiences that benefit from the in-vehicle spatial awareness that HMDs provide. HMDs are used by engineers, designers, and even consumers to interact with virtual models, hold design review sessions, and conduct immersive training sessions. This versatility translates to HMDs being a near-market leading value proposition due to the wide range of applications they support, from vehicle prototyping to immersive driver training.
The Head-Up Displays (HUDs) are anticipated to exhibit the fastest compound annual growth rate throughout the forecast period from 2024 to 2032. As vehicles increasingly employ various advanced safety and navigation technologies, HUDs provide an effective method to convey critical data, such as speed, navigation prompts, and ADAS alerts, directly in the driver’s line of site. This helps minimize driver distraction and makes it safer, which is why HUDs are increasingly found in passenger and commercial vehicles. The increasing emphasis on improving the user experience within the vehicle with advanced features and the evolving augmented reality technology is stimulating the demand for HUDs and is expected to grow at a very high rate during the forecast timeframe in the automobile VR market.
BY APPLICATION
In 2023, hardware led the automotive virtual reality market with a market share of 52%. Hardware will dominate the market due to the necessity of delivering VR automotive experiences through VR devices (headsets, sensors, and display systems). Such hardware is pivotal in facilitating applications such as vehicle design, in-vehicle infotainment, ADAS testing, and customer engagement, making it a foundation of the automotive VR ecosystem. This segment still drives the adoption of virtual reality technologies in the automotive industry, as car makers and suppliers spend big bucks on VR hardware.
The content segment is likely to have the fastest CAGR during the forecast period from 2024 to 2032. As VR hardware grows more approachable and omnipresent, the need for complementary interactive content that enriches the VR experience is exploding. VR content creation simulates immersive placements, builds 3D models for vehicle design, and lays out virtual environments for customer engagements and training. The significant and increasing demand for immersive, personalized content to supplement virtual reality hardware and software solutions is driving the content segment in automotive VR.
BY VEHICLE TYPE
In 2023, the Passenger Cars segment held the largest share of the automotive virtual reality market with a revenue share of 55.2% and is also anticipated to expand at the highest CAGR from 2024 to 2032. Passenger cars have a dominant presence in the VR market primarily owing to the rising penetration of VR applications to improve the driving experience, safety features, and in-car entertainment. VR is being used by Automakers for designing, testing, and running simulations to create consumer-friendly models of passenger vehicles, making them capable of offering advanced features. VR also plays an important part in the development of ADAS and autonomous driving technologies, both of which are increasing demand for passenger cars. With the consumer desire for not only personalization but also immersive experiences associated with VR technology, we can unlock strong growth from the passenger car segment. This demand will also translate to VR-enabled features supporting virtual test drives, personalized vehicle configurations, and Digital Showroom experiences, which makes VR an ideal of way for car buyers’ retention and engagement. As a result, VR use in the automotive sector is predominantly related to passenger cars, driving the growth of the segment at a fast pace.
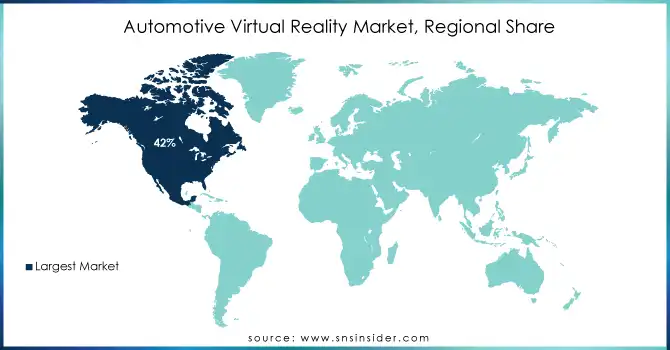
In 2023, North America dominated the market with a share of 42%. The region is home to an advanced automotive industry with major investments in VR technologies from General Motors, Ford, and Tesla. Ford illustrates how VR is applied to vehicle design and prototype testing, which creates opportunities for engineers to roam around vehicle concepts virtually and optimize vehicle prototypes before building actual models. On a related note, Tesla has also utilized VR in developing its Autopilot and Full Self-Driving systems, using it to simulate complex driving scenarios for the system to learn from. Moreover, a growing preference for enhanced and immersive experiences for in-car entertainment and safety features like ADAS is propelling North American automakers towards widespread adoption of VR.
Asia Pacific is expected to register the fastest CAGR over the forecast period 2024 to 2032, particularly due to the rapid expansion of the automotive sector in nations such as China, Japan, and South Korea. China, in particular, is influential regarding the car industry's embrace of VR, as BYD and NIO are using VR for their EV design and AV driving test (by NIO). For example, NIO is using the use of VR in its customer service experience enabling potential buyers to explore and configure their cars in virtual showrooms. Also, VR is being used by Japanese automakers such as Toyota and Honda during both design and safety testing, while South Korea's Hyundai has integrated it into the development of its driver-assist systems. This rapid adoption of VR technology is being fueled by the region's growing focus on electric vehicles, autonomous driving, and new mobility solutions.
Get Customized Report as per Your Business Requirement - Inquire Now
Some of the major players in the Automotive Virtual Reality Market are:
BMW Group [BMW Virtual Prototype, BMW ConnectedDrive]
Ford Motor Company [Ford VR Prototyping, Ford Immersive Vehicle Experience]
Porsche [Porsche VR Training, Porsche AR Car Configurator]
Mercedes-Benz [Mercedes-Benz Virtual Showroom, AR Terrain Mapping]
Volkswagen Group [Volkswagen Virtual Reality Training, Volkswagen VR Configurator]
Audi [Audi VR Experience, Audi VR Test Drive]
Honda [Honda Virtual Reality Car Configurator, Honda Augmented Reality Training]
Toyota [Toyota Virtual Prototyping, Toyota VR for Design and Simulation]
Jaguar Land Rover [Jaguar Land Rover Virtual Test Drive, AR Configurator]
Volvo [Volvo VR Configurator, Volvo Immersive Car Design]
General Motors [Chevrolet VR, GM Virtual Reality Prototyping]
Hyundai [Hyundai VR Test Drive, Hyundai Virtual Training]
Nissan [Nissan VR Experience, Nissan Virtual Prototyping]
Tesla [Tesla VR Training, Tesla AR Experience]
Rimac Automobili [Rimac Virtual Test Drive, Rimac Digital Twin Prototyping]
Aston Martin [Aston Martin Virtual Experience, Aston Martin AR Configurator]
Fisker Automotive [Fisker VR Vehicle Design, Fisker Virtual Showroom]
Lucid Motors [Lucid VR Car Configuration, Lucid Virtual Prototyping]
Rivian [Rivian Virtual Reality Test Drive, Rivian AR Training]
BMW i Ventures [BMW i VR Prototype, BMW i Digital Car Configurator]
Some of the Raw Material Suppliers for Automotive Virtual Reality Companies:
Qualcomm Technologies
NVIDIA
Samsung Electronics
Intel Corporation
ARM Holdings
Texas Instruments
Micron Technology
Advanced Micro Devices (AMD)
Sony Corporation
LG Display
In November 2024, I-CAR showcased its innovative Virtual Reality (VR) training at the 2024 SEMA Show, focusing on high-voltage EV repair simulations. This immersive technology allows collision repair professionals to develop skills in a risk-free environment.
In December 2023, BMW is using virtual reality (VR) and mixed reality technology from the gaming industry to revolutionize vehicle development, starting with the BMW iX. This collaboration with Epic Games enhances design processes, enabling more interactive and efficient simulations.
In February 2024, Honda will debut its XR Mobility Experience at SXSW 2024, combining virtual reality with the UNI-ONE mobility device for an immersive entertainment experience. The technology aims to redefine mobility in theme parks and entertainment venues.
Report Attributes | Details |
---|---|
Market Size in 2023 | USD 2.12 Billion |
Market Size by 2032 | USD 20.81 Billion |
CAGR | CAGR of 28.91% From 2024 to 2032 |
Base Year | 2023 |
Forecast Period | 2024-2032 |
Historical Data | 2020-2022 |
Report Scope & Coverage | Market Size, Segments Analysis, Competitive Landscape, Regional Analysis, DROC & SWOT Analysis, Forecast Outlook |
Key Segments | • by Application (In-Vehicle Entertainment, Advanced Driver Assistance Systems (ADAS), Simulation and Training, Showroom Display) • by Technology (Head-Mounted Displays (HMDs), Head-Up Displays (HUDs), Gesture Recognition, Haptic Feedback) • by Component (Hardware, Software, Content) • by Vehicle Type (Passenger Cars, Commercial Vehicles, Trucks and Buses) |
Regional Analysis/Coverage | North America (US, Canada, Mexico), Europe (Eastern Europe [Poland, Romania, Hungary, Turkey, Rest of Eastern Europe] Western Europe] Germany, France, UK, Italy, Spain, Netherlands, Switzerland, Austria, Rest of Western Europe]), Asia Pacific (China, India, Japan, South Korea, Vietnam, Singapore, Australia, Rest of Asia Pacific), Middle East & Africa (Middle East [UAE, Egypt, Saudi Arabia, Qatar, Rest of Middle East], Africa [Nigeria, South Africa, Rest of Africa], Latin America (Brazil, Argentina, Colombia, Rest of Latin America) |
Company Profiles | BMW Group, Ford Motor Company, Porsche, Mercedes-Benz, Volkswagen Group, Audi, Honda, Toyota, Jaguar Land Rover, Volvo, General Motors, Hyundai, Nissan, Tesla, Rimac Automobili, Aston Martin, Fisker Automotive, Lucid Motors, Rivian, BMW i Ventures. |
Key Drivers | • Enhancing In-Car Entertainment with VR and Self-Driving Cars Boosting Efficiency Engagement and Brand Appeal • Revolutionizing Car Shopping with VR Showrooms Enhancing Customer Engagement and Boosting Conversion Rates by 40% |
Restraints | • Overcoming VR Hardware Challenges and Data Privacy Concerns for Seamless Automotive User Experiences and Adoption |
Ans: The Automotive Virtual Reality Market is expected to grow at a CAGR of 28.91% during 2024-2032.
Ans: Automotive Virtual Reality Market size was USD 2.12 billion in 2023 and is expected to Reach USD 20.81 billion by 2032.
Ans: The major growth factor of the Automotive Virtual Reality Market is the increasing adoption of VR for vehicle design, testing, and enhanced customer experiences, driven by the need for cost-effective, immersive, and efficient solutions in R&D and marketing.
Ans: The Head-Mounted Displays (HMDs) segment dominated the Automotive Virtual Reality Market in 2023.
Ans: North America dominated the Automotive Virtual Reality Market in 2023.
Table of Contents
1. Introduction
1.1 Market Definition
1.2 Scope (Inclusion and Exclusions)
1.3 Research Assumptions
2. Executive Summary
2.1 Market Overview
2.2 Regional Synopsis
2.3 Competitive Summary
3. Research Methodology
3.1 Top-Down Approach
3.2 Bottom-up Approach
3.3. Data Validation
3.4 Primary Interviews
4. Market Dynamics Impact Analysis
4.1 Market Driving Factors Analysis
4.1.1 Drivers
4.1.2 Restraints
4.1.3 Opportunities
4.1.4 Challenges
4.2 PESTLE Analysis
4.3 Porter’s Five Forces Model
5. Statistical Insights and Trends Reporting
5.1 Automotive Virtual Reality Technology Penetration (2023)
5.2 Automotive Virtual Reality Growth in VR-Enabled Features (2023)
5.3 Automotive Virtual Reality User Engagement and Satisfaction
5.4 Automotive Virtual Reality Technological Advancements
5.5 Automotive Virtual Reality Training and Workforce Development
6. Competitive Landscape
6.1 List of Major Companies, By Region
6.2 Market Share Analysis, By Region
6.3 Product Benchmarking
6.3.1 Product specifications and features
6.3.2 Pricing
6.4 Strategic Initiatives
6.4.1 Marketing and promotional activities
6.4.2 Distribution and Supply Chain Strategies
6.4.3 Expansion plans and new product launches
6.4.4 Strategic partnerships and collaborations
6.5 Technological Advancements
6.6 Market Positioning and Branding
7. Automotive Virtual Reality Market Segmentation, by Application
7.1 Chapter Overview
7.2 In-Vehicle Entertainment
7.2.1 In-Vehicle Entertainment Market Trends Analysis (2020-2032)
7.2.2 In-Vehicle Entertainment Market Size Estimates and Forecasts to 2032 (USD Billion)
7.3 Advanced Driver Assistance Systems (ADAS)
7.3.1 Advanced Driver Assistance Systems (ADAS) Market Trends Analysis (2020-2032)
7.3.2 Advanced Driver Assistance Systems (ADAS) Market Size Estimates and Forecasts to 2032 (USD Billion)
7.4 Simulation and Training
7.4.1 Simulation and Training Market Trends Analysis (2020-2032)
7.4.2 Simulation and Training Market Size Estimates and Forecasts to 2032 (USD Billion)
7.5 Showroom Display
7.5.1 Showroom Display Market Trends Analysis (2020-2032)
7.5.2 Showroom Display Market Size Estimates and Forecasts to 2032 (USD Billion)
8. Automotive Virtual Reality Market Segmentation, By Technology
8.1 Chapter Overview
8.2 Head-Mounted Displays (HMDs)
8.2.1 Head-Mounted Displays (HMDs) Market Trends Analysis (2020-2032)
8.2.2 Head-Mounted Displays (HMDs) Market Size Estimates and Forecasts to 2032 (USD Billion)
8.3 Head-Up Displays (HUDs)
8.3.1 Head-Up Displays (HUDs) Market Trends Analysis (2020-2032)
8.3.2 Head-Up Displays (HUDs) Market Size Estimates and Forecasts to 2032 (USD Billion)
8.4 Gesture Recognition
8.4.1 Gesture Recognition Market Trends Analysis (2020-2032)
8.4.2 Gesture Recognition Market Size Estimates and Forecasts to 2032 (USD Billion)
8.5 Haptic Feedback
8.5.1 Haptic Feedback Market Trends Analysis (2020-2032)
8.5.2 Haptic Feedback Market Size Estimates and Forecasts to 2032 (USD Billion)
9. Automotive Virtual Reality Market Segmentation, By Component
9.1 Chapter Overview
9.2 Hardware
9.2.1 Hardware Market Trends Analysis (2020-2032)
9.2.2 Hardware Market Size Estimates and Forecasts to 2032 (USD Billion)
9.3 Software
9.3.1 Software Market Trends Analysis (2020-2032)
9.3.2 Software Market Size Estimates and Forecasts to 2032 (USD Billion)
9.4 Content
9.4.1 Content Market Trends Analysis (2020-2032)
9.4.2 Content Market Size Estimates and Forecasts to 2032 (USD Billion)
10. Automotive Virtual Reality Market Segmentation, by Vehicle Type
10.1 Chapter Overview
10.2 Passenger Cars
10.2.1 Passenger Cars Market Trends Analysis (2020-2032)
10.2.2 Passenger Cars Market Size Estimates and Forecasts to 2032 (USD Billion)
10.3 Commercial Vehicles
10.3.1 Commercial Vehicles Market Trends Analysis (2020-2032)
10.3.2 Commercial Vehicles Market Size Estimates and Forecasts to 2032 (USD Billion)
10.4 Trucks and Buses
10.4.1 Trucks and Buses Market Trends Analysis (2020-2032)
10.4.2 Trucks and Buses Market Size Estimates and Forecasts to 2032 (USD Billion)
11. Regional Analysis
11.1 Chapter Overview
11.2 North America
11.2.1 Trends Analysis
11.2.2 North America Automotive Virtual Reality Market Estimates and Forecasts, by Country (2020-2032) (USD Billion)
11.2.3 North America Automotive Virtual Reality Market Estimates and Forecasts, by Application (2020-2032) (USD Billion)
11.2.4 North America Automotive Virtual Reality Market Estimates and Forecasts, By Technology (2020-2032) (USD Billion)
11.2.5 North America Automotive Virtual Reality Market Estimates and Forecasts, By Component (2020-2032) (USD Billion)
11.2.6 North America Automotive Virtual Reality Market Estimates and Forecasts, by Vehicle Type (2020-2032) (USD Billion)
11.2.7 USA
11.2.7.1 USA Automotive Virtual Reality Market Estimates and Forecasts, by Application (2020-2032) (USD Billion)
11.2.7.2 USA Automotive Virtual Reality Market Estimates and Forecasts, By Technology (2020-2032) (USD Billion)
11.2.7.3 USA Automotive Virtual Reality Market Estimates and Forecasts, By Component (2020-2032) (USD Billion)
11.2.7.4 USA Automotive Virtual Reality Market Estimates and Forecasts, by Vehicle Type (2020-2032) (USD Billion)
11.2.8 Canada
11.2.8.1 Canada Automotive Virtual Reality Market Estimates and Forecasts, by Application (2020-2032) (USD Billion)
11.2.8.2 Canada Automotive Virtual Reality Market Estimates and Forecasts, By Technology (2020-2032) (USD Billion)
11.2.8.3 Canada Automotive Virtual Reality Market Estimates and Forecasts, By Component (2020-2032) (USD Billion)
11.2.8.4 Canada Automotive Virtual Reality Market Estimates and Forecasts, by Vehicle Type (2020-2032) (USD Billion)
11.2.9 Mexico
11.2.9.1 Mexico Automotive Virtual Reality Market Estimates and Forecasts, by Application (2020-2032) (USD Billion)
11.2.9.2 Mexico Automotive Virtual Reality Market Estimates and Forecasts, By Technology (2020-2032) (USD Billion)
11.2.9.3 Mexico Automotive Virtual Reality Market Estimates and Forecasts, By Component (2020-2032) (USD Billion)
11.2.9.4 Mexico Automotive Virtual Reality Market Estimates and Forecasts, by Vehicle Type (2020-2032) (USD Billion)
11.3 Europe
11.3.1 Eastern Europe
11.3.1.1 Trends Analysis
11.3.1.2 Eastern Europe Automotive Virtual Reality Market Estimates and Forecasts, by Country (2020-2032) (USD Billion)
11.3.1.3 Eastern Europe Automotive Virtual Reality Market Estimates and Forecasts, by Application (2020-2032) (USD Billion)
11.3.1.4 Eastern Europe Automotive Virtual Reality Market Estimates and Forecasts, By Technology (2020-2032) (USD Billion)
11.3.1.5 Eastern Europe Automotive Virtual Reality Market Estimates and Forecasts, By Component (2020-2032) (USD Billion)
11.3.1.6 Eastern Europe Automotive Virtual Reality Market Estimates and Forecasts, by Vehicle Type (2020-2032) (USD Billion)
11.3.1.7 Poland
11.3.1.7.1 Poland Automotive Virtual Reality Market Estimates and Forecasts, by Application (2020-2032) (USD Billion)
11.3.1.7.2 Poland Automotive Virtual Reality Market Estimates and Forecasts, By Technology (2020-2032) (USD Billion)
11.3.1.7.3 Poland Automotive Virtual Reality Market Estimates and Forecasts, By Component (2020-2032) (USD Billion)
11.3.1.7.4 Poland Automotive Virtual Reality Market Estimates and Forecasts, by Vehicle Type (2020-2032) (USD Billion)
11.3.1.8 Romania
11.3.1.8.1 Romania Automotive Virtual Reality Market Estimates and Forecasts, by Application (2020-2032) (USD Billion)
11.3.1.8.2 Romania Automotive Virtual Reality Market Estimates and Forecasts, By Technology (2020-2032) (USD Billion)
11.3.1.8.3 Romania Automotive Virtual Reality Market Estimates and Forecasts, By Component (2020-2032) (USD Billion)
11.3.1.8.4 Romania Automotive Virtual Reality Market Estimates and Forecasts, by Vehicle Type (2020-2032) (USD Billion)
11.3.1.9 Hungary
11.3.1.9.1 Hungary Automotive Virtual Reality Market Estimates and Forecasts, by Application (2020-2032) (USD Billion)
11.3.1.9.2 Hungary Automotive Virtual Reality Market Estimates and Forecasts, By Technology (2020-2032) (USD Billion)
11.3.1.9.3 Hungary Automotive Virtual Reality Market Estimates and Forecasts, By Component (2020-2032) (USD Billion)
11.3.1.9.4 Hungary Automotive Virtual Reality Market Estimates and Forecasts, by Vehicle Type (2020-2032) (USD Billion)
11.3.1.10 turkey
11.3.1.10.1 Turkey Automotive Virtual Reality Market Estimates and Forecasts, by Application (2020-2032) (USD Billion)
11.3.1.10.2 Turkey Automotive Virtual Reality Market Estimates and Forecasts, By Technology (2020-2032) (USD Billion)
11.3.1.10.3 Turkey Automotive Virtual Reality Market Estimates and Forecasts, By Component (2020-2032) (USD Billion)
11.3.1.10.4 Turkey Automotive Virtual Reality Market Estimates and Forecasts, by Vehicle Type (2020-2032) (USD Billion)
11.3.1.11 Rest of Eastern Europe
11.3.1.11.1 Rest of Eastern Europe Automotive Virtual Reality Market Estimates and Forecasts, by Application (2020-2032) (USD Billion)
11.3.1.11.2 Rest of Eastern Europe Automotive Virtual Reality Market Estimates and Forecasts, By Technology (2020-2032) (USD Billion)
11.3.1.11.3 Rest of Eastern Europe Automotive Virtual Reality Market Estimates and Forecasts, By Component (2020-2032) (USD Billion)
11.3.1.11.4 Rest of Eastern Europe Automotive Virtual Reality Market Estimates and Forecasts, by Vehicle Type (2020-2032) (USD Billion)
11.3.2 Western Europe
11.3.2.1 Trends Analysis
11.3.2.2 Western Europe Automotive Virtual Reality Market Estimates and Forecasts, by Country (2020-2032) (USD Billion)
11.3.2.3 Western Europe Automotive Virtual Reality Market Estimates and Forecasts, by Application (2020-2032) (USD Billion)
11.3.2.4 Western Europe Automotive Virtual Reality Market Estimates and Forecasts, By Technology (2020-2032) (USD Billion)
11.3.2.5 Western Europe Automotive Virtual Reality Market Estimates and Forecasts, By Component (2020-2032) (USD Billion)
11.3.2.6 Western Europe Automotive Virtual Reality Market Estimates and Forecasts, by Vehicle Type (2020-2032) (USD Billion)
11.3.2.7 Germany
11.3.2.7.1 Germany Automotive Virtual Reality Market Estimates and Forecasts, by Application (2020-2032) (USD Billion)
11.3.2.7.2 Germany Automotive Virtual Reality Market Estimates and Forecasts, By Technology (2020-2032) (USD Billion)
11.3.2.7.3 Germany Automotive Virtual Reality Market Estimates and Forecasts, By Component (2020-2032) (USD Billion)
11.3.2.7.4 Germany Automotive Virtual Reality Market Estimates and Forecasts, by Vehicle Type (2020-2032) (USD Billion)
11.3.2.8 France
11.3.2.8.1 France Automotive Virtual Reality Market Estimates and Forecasts, by Application (2020-2032) (USD Billion)
11.3.2.8.2 France Automotive Virtual Reality Market Estimates and Forecasts, By Technology (2020-2032) (USD Billion)
11.3.2.8.3 France Automotive Virtual Reality Market Estimates and Forecasts, By Component (2020-2032) (USD Billion)
11.3.2.8.4 France Automotive Virtual Reality Market Estimates and Forecasts, by Vehicle Type (2020-2032) (USD Billion)
11.3.2.9 UK
11.3.2.9.1 UK Automotive Virtual Reality Market Estimates and Forecasts, by Application (2020-2032) (USD Billion)
11.3.2.9.2 UK Automotive Virtual Reality Market Estimates and Forecasts, By Technology (2020-2032) (USD Billion)
11.3.2.9.3 UK Automotive Virtual Reality Market Estimates and Forecasts, By Component (2020-2032) (USD Billion)
11.3.2.9.4 UK Automotive Virtual Reality Market Estimates and Forecasts, by Vehicle Type (2020-2032) (USD Billion)
11.3.2.10 Italy
11.3.2.10.1 Italy Automotive Virtual Reality Market Estimates and Forecasts, by Application (2020-2032) (USD Billion)
11.3.2.10.2 Italy Automotive Virtual Reality Market Estimates and Forecasts, By Technology (2020-2032) (USD Billion)
11.3.2.10.3 Italy Automotive Virtual Reality Market Estimates and Forecasts, By Component (2020-2032) (USD Billion)
11.3.2.10.4 Italy Automotive Virtual Reality Market Estimates and Forecasts, by Vehicle Type (2020-2032) (USD Billion)
11.3.2.11 Spain
11.3.2.11.1 Spain Automotive Virtual Reality Market Estimates and Forecasts, by Application (2020-2032) (USD Billion)
11.3.2.11.2 Spain Automotive Virtual Reality Market Estimates and Forecasts, By Technology (2020-2032) (USD Billion)
11.3.2.11.3 Spain Automotive Virtual Reality Market Estimates and Forecasts, By Component (2020-2032) (USD Billion)
11.3.2.11.4 Spain Automotive Virtual Reality Market Estimates and Forecasts, by Vehicle Type (2020-2032) (USD Billion)
11.3.2.12 Netherlands
11.3.2.12.1 Netherlands Automotive Virtual Reality Market Estimates and Forecasts, by Application (2020-2032) (USD Billion)
11.3.2.12.2 Netherlands Automotive Virtual Reality Market Estimates and Forecasts, By Technology (2020-2032) (USD Billion)
11.3.2.12.3 Netherlands Automotive Virtual Reality Market Estimates and Forecasts, By Component (2020-2032) (USD Billion)
11.3.2.12.4 Netherlands Automotive Virtual Reality Market Estimates and Forecasts, by Vehicle Type (2020-2032) (USD Billion)
11.3.2.13 Switzerland
11.3.2.13.1 Switzerland Automotive Virtual Reality Market Estimates and Forecasts, by Application (2020-2032) (USD Billion)
11.3.2.13.2 Switzerland Automotive Virtual Reality Market Estimates and Forecasts, By Technology (2020-2032) (USD Billion)
11.3.2.13.3 Switzerland Automotive Virtual Reality Market Estimates and Forecasts, By Component (2020-2032) (USD Billion)
11.3.2.13.4 Switzerland Automotive Virtual Reality Market Estimates and Forecasts, by Vehicle Type (2020-2032) (USD Billion)
11.3.2.14 Austria
11.3.2.14.1 Austria Automotive Virtual Reality Market Estimates and Forecasts, by Application (2020-2032) (USD Billion)
11.3.2.14.2 Austria Automotive Virtual Reality Market Estimates and Forecasts, By Technology (2020-2032) (USD Billion)
11.3.2.14.3 Austria Automotive Virtual Reality Market Estimates and Forecasts, By Component (2020-2032) (USD Billion)
11.3.2.14.4 Austria Automotive Virtual Reality Market Estimates and Forecasts, by Vehicle Type (2020-2032) (USD Billion)
11.3.2.15 Rest of Western Europe
11.3.2.15.1 Rest of Western Europe Automotive Virtual Reality Market Estimates and Forecasts, by Application (2020-2032) (USD Billion)
11.3.2.15.2 Rest of Western Europe Automotive Virtual Reality Market Estimates and Forecasts, By Technology (2020-2032) (USD Billion)
11.3.2.15.3 Rest of Western Europe Automotive Virtual Reality Market Estimates and Forecasts, By Component (2020-2032) (USD Billion)
11.3.2.15.4 Rest of Western Europe Automotive Virtual Reality Market Estimates and Forecasts, by Vehicle Type (2020-2032) (USD Billion)
11.4 Asia Pacific
11.4.1 Trends Analysis
11.4.2 Asia Pacific Automotive Virtual Reality Market Estimates and Forecasts, by Country (2020-2032) (USD Billion)
11.4.3 Asia Pacific Automotive Virtual Reality Market Estimates and Forecasts, by Application (2020-2032) (USD Billion)
11.4.4 Asia Pacific Automotive Virtual Reality Market Estimates and Forecasts, By Technology (2020-2032) (USD Billion)
11.4.5 Asia Pacific Automotive Virtual Reality Market Estimates and Forecasts, By Component (2020-2032) (USD Billion)
11.4.6 Asia Pacific Automotive Virtual Reality Market Estimates and Forecasts, by Vehicle Type (2020-2032) (USD Billion)
11.4.7 China
11.4.7.1 China Automotive Virtual Reality Market Estimates and Forecasts, by Application (2020-2032) (USD Billion)
11.4.7.2 China Automotive Virtual Reality Market Estimates and Forecasts, By Technology (2020-2032) (USD Billion)
11.4.7.3 China Automotive Virtual Reality Market Estimates and Forecasts, By Component (2020-2032) (USD Billion)
11.4.7.4 China Automotive Virtual Reality Market Estimates and Forecasts, by Vehicle Type (2020-2032) (USD Billion)
11.4.8 India
11.4.8.1 India Automotive Virtual Reality Market Estimates and Forecasts, by Application (2020-2032) (USD Billion)
11.4.8.2 India Automotive Virtual Reality Market Estimates and Forecasts, By Technology (2020-2032) (USD Billion)
11.4.8.3 India Automotive Virtual Reality Market Estimates and Forecasts, By Component (2020-2032) (USD Billion)
11.4.8.4 India Automotive Virtual Reality Market Estimates and Forecasts, by Vehicle Type (2020-2032) (USD Billion)
11.4.9 Japan
11.4.9.1 Japan Automotive Virtual Reality Market Estimates and Forecasts, by Application (2020-2032) (USD Billion)
11.4.9.2 Japan Automotive Virtual Reality Market Estimates and Forecasts, By Technology (2020-2032) (USD Billion)
11.4.9.3 Japan Automotive Virtual Reality Market Estimates and Forecasts, By Component (2020-2032) (USD Billion)
11.4.9.4 Japan Automotive Virtual Reality Market Estimates and Forecasts, by Vehicle Type (2020-2032) (USD Billion)
11.4.10 South Korea
11.4.10.1 South Korea Automotive Virtual Reality Market Estimates and Forecasts, by Application (2020-2032) (USD Billion)
11.4.10.2 South Korea Automotive Virtual Reality Market Estimates and Forecasts, By Technology (2020-2032) (USD Billion)
11.4.10.3 South Korea Automotive Virtual Reality Market Estimates and Forecasts, By Component (2020-2032) (USD Billion)
11.4.10.4 South Korea Automotive Virtual Reality Market Estimates and Forecasts, by Vehicle Type (2020-2032) (USD Billion)
11.4.11 Vietnam
11.4.11.1 Vietnam Automotive Virtual Reality Market Estimates and Forecasts, by Application (2020-2032) (USD Billion)
11.4.11.2 Vietnam Automotive Virtual Reality Market Estimates and Forecasts, By Technology (2020-2032) (USD Billion)
11.4.11.3 Vietnam Automotive Virtual Reality Market Estimates and Forecasts, By Component (2020-2032) (USD Billion)
11.4.11.4 Vietnam Automotive Virtual Reality Market Estimates and Forecasts, by Vehicle Type (2020-2032) (USD Billion)
11.4.12 Singapore
11.4.12.1 Singapore Automotive Virtual Reality Market Estimates and Forecasts, by Application (2020-2032) (USD Billion)
11.4.12.2 Singapore Automotive Virtual Reality Market Estimates and Forecasts, By Technology (2020-2032) (USD Billion)
11.4.12.3 Singapore Automotive Virtual Reality Market Estimates and Forecasts, By Component (2020-2032) (USD Billion)
11.4.12.4 Singapore Automotive Virtual Reality Market Estimates and Forecasts, by Vehicle Type (2020-2032) (USD Billion)
11.4.13 Australia
11.4.13.1 Australia Automotive Virtual Reality Market Estimates and Forecasts, by Application (2020-2032) (USD Billion)
11.4.13.2 Australia Automotive Virtual Reality Market Estimates and Forecasts, By Technology (2020-2032) (USD Billion)
11.4.13.3 Australia Automotive Virtual Reality Market Estimates and Forecasts, By Component (2020-2032) (USD Billion)
11.4.13.4 Australia Automotive Virtual Reality Market Estimates and Forecasts, by Vehicle Type (2020-2032) (USD Billion)
11.4.14 Rest of Asia Pacific
11.4.14.1 Rest of Asia Pacific Automotive Virtual Reality Market Estimates and Forecasts, by Application (2020-2032) (USD Billion)
11.4.14.2 Rest of Asia Pacific Automotive Virtual Reality Market Estimates and Forecasts, By Technology (2020-2032) (USD Billion)
11.4.14.3 Rest of Asia Pacific Automotive Virtual Reality Market Estimates and Forecasts, By Component (2020-2032) (USD Billion)
11.4.14.4 Rest of Asia Pacific Automotive Virtual Reality Market Estimates and Forecasts, by Vehicle Type (2020-2032) (USD Billion)
11.5 Middle East and Africa
11.5.1 Middle East
11.5.1.1 Trends Analysis
11.5.1.2 Middle East Automotive Virtual Reality Market Estimates and Forecasts, by Country (2020-2032) (USD Billion)
11.5.1.3 Middle East Automotive Virtual Reality Market Estimates and Forecasts, by Application (2020-2032) (USD Billion)
11.5.1.4 Middle East Automotive Virtual Reality Market Estimates and Forecasts, By Technology (2020-2032) (USD Billion)
11.5.1.5 Middle East Automotive Virtual Reality Market Estimates and Forecasts, By Component (2020-2032) (USD Billion)
11.5.1.6 Middle East Automotive Virtual Reality Market Estimates and Forecasts, by Vehicle Type (2020-2032) (USD Billion)
11.5.1.7 UAE
11.5.1.7.1 UAE Automotive Virtual Reality Market Estimates and Forecasts, by Application (2020-2032) (USD Billion)
11.5.1.7.2 UAE Automotive Virtual Reality Market Estimates and Forecasts, By Technology (2020-2032) (USD Billion)
11.5.1.7.3 UAE Automotive Virtual Reality Market Estimates and Forecasts, By Component (2020-2032) (USD Billion)
11.5.1.7.4 UAE Automotive Virtual Reality Market Estimates and Forecasts, by Vehicle Type (2020-2032) (USD Billion)
11.5.1.8 Egypt
11.5.1.8.1 Egypt Automotive Virtual Reality Market Estimates and Forecasts, by Application (2020-2032) (USD Billion)
11.5.1.8.2 Egypt Automotive Virtual Reality Market Estimates and Forecasts, By Technology (2020-2032) (USD Billion)
11.5.1.8.3 Egypt Automotive Virtual Reality Market Estimates and Forecasts, By Component (2020-2032) (USD Billion)
11.5.1.8.4 Egypt Automotive Virtual Reality Market Estimates and Forecasts, by Vehicle Type (2020-2032) (USD Billion)
11.5.1.9 Saudi Arabia
11.5.1.9.1 Saudi Arabia Automotive Virtual Reality Market Estimates and Forecasts, by Application (2020-2032) (USD Billion)
11.5.1.9.2 Saudi Arabia Automotive Virtual Reality Market Estimates and Forecasts, By Technology (2020-2032) (USD Billion)
11.5.1.9.3 Saudi Arabia Automotive Virtual Reality Market Estimates and Forecasts, By Component (2020-2032) (USD Billion)
11.5.1.9.4 Saudi Arabia Automotive Virtual Reality Market Estimates and Forecasts, by Vehicle Type (2020-2032) (USD Billion)
11.5.1.10 Qatar
11.5.1.10.1 Qatar Automotive Virtual Reality Market Estimates and Forecasts, by Application (2020-2032) (USD Billion)
11.5.1.10.2 Qatar Automotive Virtual Reality Market Estimates and Forecasts, By Technology (2020-2032) (USD Billion)
11.5.1.10.3 Qatar Automotive Virtual Reality Market Estimates and Forecasts, By Component (2020-2032) (USD Billion)
11.5.1.10.4 Qatar Automotive Virtual Reality Market Estimates and Forecasts, by Vehicle Type (2020-2032) (USD Billion)
11.5.1.11 Rest of Middle East
11.5.1.11.1 Rest of Middle East Automotive Virtual Reality Market Estimates and Forecasts, by Application (2020-2032) (USD Billion)
11.5.1.11.2 Rest of Middle East Automotive Virtual Reality Market Estimates and Forecasts, By Technology (2020-2032) (USD Billion)
11.5.1.11.3 Rest of Middle East Automotive Virtual Reality Market Estimates and Forecasts, By Component (2020-2032) (USD Billion)
11.5.1.11.4 Rest of Middle East Automotive Virtual Reality Market Estimates and Forecasts, by Vehicle Type (2020-2032) (USD Billion)
11.5.2 Africa
11.5.2.1 Trends Analysis
11.5.2.2 Africa Automotive Virtual Reality Market Estimates and Forecasts, by Country (2020-2032) (USD Billion)
11.5.2.3 Africa Automotive Virtual Reality Market Estimates and Forecasts, by Application (2020-2032) (USD Billion)
11.5.2.4 Africa Automotive Virtual Reality Market Estimates and Forecasts, By Technology (2020-2032) (USD Billion)
11.5.2.5 Africa Automotive Virtual Reality Market Estimates and Forecasts, By Component (2020-2032) (USD Billion)
11.5.2.6 Africa Automotive Virtual Reality Market Estimates and Forecasts, by Vehicle Type (2020-2032) (USD Billion)
11.5.2.7 South Africa
11.5.2.7.1 South Africa Automotive Virtual Reality Market Estimates and Forecasts, by Application (2020-2032) (USD Billion)
11.5.2.7.2 South Africa Automotive Virtual Reality Market Estimates and Forecasts, By Technology (2020-2032) (USD Billion)
11.5.2.7.3 South Africa Automotive Virtual Reality Market Estimates and Forecasts, By Component (2020-2032) (USD Billion)
11.5.2.7.4 South Africa Automotive Virtual Reality Market Estimates and Forecasts, by Vehicle Type (2020-2032) (USD Billion)
11.5.2.8 Nigeria
11.5.2.8.1 Nigeria Automotive Virtual Reality Market Estimates and Forecasts, by Application (2020-2032) (USD Billion)
11.5.2.8.2 Nigeria Automotive Virtual Reality Market Estimates and Forecasts, By Technology (2020-2032) (USD Billion)
11.5.2.8.3 Nigeria Automotive Virtual Reality Market Estimates and Forecasts, By Component (2020-2032) (USD Billion)
11.5.2.8.4 Nigeria Automotive Virtual Reality Market Estimates and Forecasts, by Vehicle Type (2020-2032) (USD Billion)
11.5.2.9 Rest of Africa
11.5.2.9.1 Rest of Africa Automotive Virtual Reality Market Estimates and Forecasts, by Application (2020-2032) (USD Billion)
11.5.2.9.2 Rest of Africa Automotive Virtual Reality Market Estimates and Forecasts, By Technology (2020-2032) (USD Billion)
11.5.2.9.3 Rest of Africa Automotive Virtual Reality Market Estimates and Forecasts, By Component (2020-2032) (USD Billion)
11.5.2.9.4 Rest of Africa Automotive Virtual Reality Market Estimates and Forecasts, by Vehicle Type (2020-2032) (USD Billion)
11.6 Latin America
11.6.1 Trends Analysis
11.6.2 Latin America Automotive Virtual Reality Market Estimates and Forecasts, by Country (2020-2032) (USD Billion)
11.6.3 Latin America Automotive Virtual Reality Market Estimates and Forecasts, by Application (2020-2032) (USD Billion)
11.6.4 Latin America Automotive Virtual Reality Market Estimates and Forecasts, By Technology (2020-2032) (USD Billion)
11.6.5 Latin America Automotive Virtual Reality Market Estimates and Forecasts, By Component (2020-2032) (USD Billion)
11.6.6 Latin America Automotive Virtual Reality Market Estimates and Forecasts, by Vehicle Type (2020-2032) (USD Billion)
11.6.7 Brazil
11.6.7.1 Brazil Automotive Virtual Reality Market Estimates and Forecasts, by Application (2020-2032) (USD Billion)
11.6.7.2 Brazil Automotive Virtual Reality Market Estimates and Forecasts, By Technology (2020-2032) (USD Billion)
11.6.7.3 Brazil Automotive Virtual Reality Market Estimates and Forecasts, By Component (2020-2032) (USD Billion)
11.6.7.4 Brazil Automotive Virtual Reality Market Estimates and Forecasts, by Vehicle Type (2020-2032) (USD Billion)
11.6.8 Argentina
11.6.8.1 Argentina Automotive Virtual Reality Market Estimates and Forecasts, by Application (2020-2032) (USD Billion)
11.6.8.2 Argentina Automotive Virtual Reality Market Estimates and Forecasts, By Technology (2020-2032) (USD Billion)
11.6.8.3 Argentina Automotive Virtual Reality Market Estimates and Forecasts, By Component (2020-2032) (USD Billion)
11.6.8.4 Argentina Automotive Virtual Reality Market Estimates and Forecasts, by Vehicle Type (2020-2032) (USD Billion)
11.6.9 Colombia
11.6.9.1 Colombia Automotive Virtual Reality Market Estimates and Forecasts, by Application (2020-2032) (USD Billion)
11.6.9.2 Colombia Automotive Virtual Reality Market Estimates and Forecasts, By Technology (2020-2032) (USD Billion)
11.6.9.3 Colombia Automotive Virtual Reality Market Estimates and Forecasts, By Component (2020-2032) (USD Billion)
11.6.9.4 Colombia Automotive Virtual Reality Market Estimates and Forecasts, by Vehicle Type (2020-2032) (USD Billion)
11.6.10 Rest of Latin America
11.6.10.1 Rest of Latin America Automotive Virtual Reality Market Estimates and Forecasts, by Application (2020-2032) (USD Billion)
11.6.10.2 Rest of Latin America Automotive Virtual Reality Market Estimates and Forecasts, By Technology (2020-2032) (USD Billion)
11.6.10.3 Rest of Latin America Automotive Virtual Reality Market Estimates and Forecasts, By Component (2020-2032) (USD Billion)
11.6.10.4 Rest of Latin America Automotive Virtual Reality Market Estimates and Forecasts, by Vehicle Type (2020-2032) (USD Billion)
12. Company Profiles
12.1 BMW Group
12.1.1 Company Overview
12.1.2 Financial
12.1.3 Products/ Services Offered
12.1.4 SWOT Analysis
12.2 Ford Motor Company
12.2.1 Company Overview
12.2.2 Financial
12.2.3 Products/ Services Offered
12.2.4 SWOT Analysis
12.3 Porsche
12.3.1 Company Overview
12.3.2 Financial
12.3.3 Products/ Services Offered
12.3.4 SWOT Analysis
12.4 Mercedes-Benz
12.4.1 Company Overview
12.4.2 Financial
12.4.3 Products/ Services Offered
12.4.4 SWOT Analysis
12.5 Volkswagen Group
12.5.1 Company Overview
12.5.2 Financial
12.5.3 Products/ Services Offered
12.5.4 SWOT Analysis
12.6 Audi
12.6.1 Company Overview
12.6.2 Financial
12.6.3 Products/ Services Offered
12.6.4 SWOT Analysis
12.7 Honda
12.7.1 Company Overview
12.7.2 Financial
12.7.3 Products/ Services Offered
12.7.4 SWOT Analysis
12.8 Toyota
12.8.1 Company Overview
12.8.2 Financial
12.8.3 Products/ Services Offered
12.8.4 SWOT Analysis
12.9 Jaguar Land Rover
12.9.1 Company Overview
12.9.2 Financial
12.9.3 Products/ Services Offered
12.9.4 SWOT Analysis
12.10 Volvo
12.10.1 Company Overview
12.10.2 Financial
12.10.3 Products/ Services Offered
12.10.4 SWOT Analysis
13. Use Cases and Best Practices
14. Conclusion
An accurate research report requires proper strategizing as well as implementation. There are multiple factors involved in the completion of good and accurate research report and selecting the best methodology to compete the research is the toughest part. Since the research reports we provide play a crucial role in any company’s decision-making process, therefore we at SNS Insider always believe that we should choose the best method which gives us results closer to reality. This allows us to reach at a stage wherein we can provide our clients best and accurate investment to output ratio.
Each report that we prepare takes a timeframe of 350-400 business hours for production. Starting from the selection of titles through a couple of in-depth brain storming session to the final QC process before uploading our titles on our website we dedicate around 350 working hours. The titles are selected based on their current market cap and the foreseen CAGR and growth.
The 5 steps process:
Step 1: Secondary Research:
Secondary Research or Desk Research is as the name suggests is a research process wherein, we collect data through the readily available information. In this process we use various paid and unpaid databases which our team has access to and gather data through the same. This includes examining of listed companies’ annual reports, Journals, SEC filling etc. Apart from this our team has access to various associations across the globe across different industries. Lastly, we have exchange relationships with various university as well as individual libraries.
Step 2: Primary Research
When we talk about primary research, it is a type of study in which the researchers collect relevant data samples directly, rather than relying on previously collected data. This type of research is focused on gaining content specific facts that can be sued to solve specific problems. Since the collected data is fresh and first hand therefore it makes the study more accurate and genuine.
We at SNS Insider have divided Primary Research into 2 parts.
Part 1 wherein we interview the KOLs of major players as well as the upcoming ones across various geographic regions. This allows us to have their view over the market scenario and acts as an important tool to come closer to the accurate market numbers. As many as 45 paid and unpaid primary interviews are taken from both the demand and supply side of the industry to make sure we land at an accurate judgement and analysis of the market.
This step involves the triangulation of data wherein our team analyses the interview transcripts, online survey responses and observation of on filed participants. The below mentioned chart should give a better understanding of the part 1 of the primary interview.
Part 2: In this part of primary research the data collected via secondary research and the part 1 of the primary research is validated with the interviews from individual consultants and subject matter experts.
Consultants are those set of people who have at least 12 years of experience and expertise within the industry whereas Subject Matter Experts are those with at least 15 years of experience behind their back within the same space. The data with the help of two main processes i.e., FGDs (Focused Group Discussions) and IDs (Individual Discussions). This gives us a 3rd party nonbiased primary view of the market scenario making it a more dependable one while collation of the data pointers.
Step 3: Data Bank Validation
Once all the information is collected via primary and secondary sources, we run that information for data validation. At our intelligence centre our research heads track a lot of information related to the market which includes the quarterly reports, the daily stock prices, and other relevant information. Our data bank server gets updated every fortnight and that is how the information which we collected using our primary and secondary information is revalidated in real time.
Step 4: QA/QC Process
After all the data collection and validation our team does a final level of quality check and quality assurance to get rid of any unwanted or undesired mistakes. This might include but not limited to getting rid of the any typos, duplication of numbers or missing of any important information. The people involved in this process include technical content writers, research heads and graphics people. Once this process is completed the title gets uploader on our platform for our clients to read it.
Step 5: Final QC/QA Process:
This is the last process and comes when the client has ordered the study. In this process a final QA/QC is done before the study is emailed to the client. Since we believe in giving our clients a good experience of our research studies, therefore, to make sure that we do not lack at our end in any way humanly possible we do a final round of quality check and then dispatch the study to the client.
Key Segmentation
By Application
In-Vehicle Entertainment
Advanced Driver Assistance Systems (ADAS)
Simulation and Training
Showroom Display
By Technology
Head-Mounted Displays (HMDs)
Head-Up Displays (HUDs)
Gesture Recognition
Haptic Feedback
By Component
Hardware
Software
Content
By Vehicle Type
Passenger Cars
Commercial Vehicles
Trucks and Buses
Request for Segment Customization as per your Business Requirement: Segment Customization Request
REGIONAL COVERAGE:
North America
US
Canada
Mexico
Europe
Eastern Europe
Poland
Romania
Hungary
Turkey
Rest of Eastern Europe
Western Europe
Germany
France
UK
Italy
Spain
Netherlands
Switzerland
Austria
Rest of Western Europe
Asia Pacific
China
India
Japan
South Korea
Vietnam
Singapore
Australia
Rest of Asia Pacific
Middle East & Africa
Middle East
UAE
Egypt
Saudi Arabia
Qatar
Rest of the Middle East
Africa
Nigeria
South Africa
Rest of Africa
Latin America
Brazil
Argentina
Colombia
Rest of Latin America
Request for Country Level Research Report: Country Level Customization Request
Available Customization
With the given market data, SNS Insider offers customization as per the company’s specific needs. The following customization options are available for the report:
Product Analysis
Criss-Cross segment analysis (e.g. Product X Application)
Product Matrix which gives a detailed comparison of the product portfolio of each company
Geographic Analysis
Additional countries in any of the regions
Company Information
Detailed analysis and profiling of additional market players (Up to five)
The Off-Road Vehicles Market Size was valued at USD 22.9 billion in 2023 and will reach to USD 37.07 billion by 2032 and grow at a CAGR of 5.5% by 2024-2032
The Route Optimization Software Market Size was valued at USD 7.01 Billion in 2023 & will reach USD 23.50 Bn by 2032 & grow at a CAGR of 14.41% by 2024-2032
Ride Sharing Market Size was valued at USD 115.30 billion in 2023 and is expected to reach USD 452.27 billion by 2032 and grow at a CAGR of 16.4% over the forecast period 2024-2032.
Automatic Number Plate Recognition (ANPR) System Market Size was valued at USD 3.17 Billion in 2023 and is expected to reach USD 6.96 Billion by 2032 and grow at a CAGR of 9.15% over the forecast period 2024-2032.
The Automotive Collision Avoidance System Market size was valued at USD 58.05 billion in 2023 and is expected to reach USD 128.38 billion by 2032 and grow at a CAGR of 9.22% over the forecast period 2024-2032.
The Automotive Pressure Plates Market Size was valued at USD 27.60 billion in 2023 and is expected to reach USD 38.33 billion by 2031 and grow at a CAGR of 4.1% over the forecast period 2024-2031.
Hi! Click one of our member below to chat on Phone