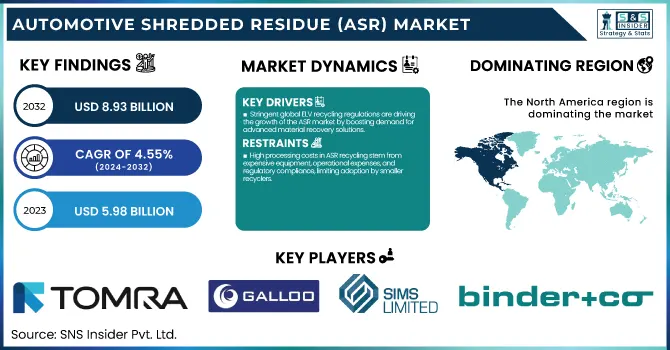
The Automotive Shredded Residue (ASR) Market Size was estimated at USD 5.98 billion in 2023 and is expected to arrive at USD 8.93 billion by 2032 with a growing CAGR of 4.55% over the forecast period 2024-2032.
To Get more information on Automotive Shredded Residue (ASR) Market - Request Free Sample Report
This report uniquely explores ASR generation trends across key regions, highlighting recycling and recovery rates alongside shifting landfilling vs. recycling patterns. It examines the adoption of advanced ASR processing technologies and evaluates export/import dynamics of recovered materials. Additionally, the report tracks the regulatory push towards circular economy models, the rise of AI-driven ASR sorting, and the impact of global supply chain disruptions on material recovery efficiency.
The U.S. fuel transfer pumps market is projected to grow steadily from USD 0.95 billion in 2023 to USD 1.46 billion by 2032, reflecting a CAGR of 4.92%. This growth is driven by increasing demand in industries such as construction, agriculture, and transportation, along with advancements in fuel transfer technology and infrastructure development.
Drivers
Stringent global ELV recycling regulations are driving the growth of the ASR market by boosting demand for advanced material recovery solutions.
Governments worldwide are implementing stringent regulations on end-of-life vehicle (ELV) recycling, significantly driving the growth of the Automotive Shredded Residue (ASR) market. As the emphasis grows on sustainable practices and circular economy principles, governments are requiring increased recycling and material recovery rates, decreasing reliance on landfills. As a result, the EU ELV Directive and similar legislation in North America and Asia are encouraging greater utilization of advanced ASR processing technologies by both automakers and recyclers. There has been a gradual increasing trend toward investment in automated sorting, pyrolysis, and chemical recycling processes to reclaim valuable metals and non-metallics. Moreover, surging use of recycled raw materials for generating new automobiles is propelling the market growth. With EVs becoming more prevalent, ASR processing is developing further, spurring new forms of recovery of both batteries and composite materials. The ASR market is likely to remain steady due to supportive regulatory frameworks, technological advancements, and the rising demand for sustainable automotive recycling solutions.
Restraint
High processing costs in ASR recycling stem from expensive equipment, operational expenses, and regulatory compliance, limiting adoption by smaller recyclers.
High processing costs pose a significant barrier to the widespread adoption of advanced ASR recycling technologies. Separating valuable materials from ASR entails the use of advanced technology, such as sensor-based separation plants, shredders, and chemical recovery units, which involves high capital costs. Moreover, operational costs such as energy usage, labor, and maintenance also drive up the costs for recyclers. Advanced recovery methods can prove too costly for smaller recycling firms, which utilize expensive tech and other resources, hindering many from being able to afford them. Additionally, the sample rates for recovered materials, particularly plastics and non-ferrous metals, can create challenges in obtaining a stable return on investment. Strict environmental regulations also lead to compliance costs, which make it difficult for companies to maintain profitability. Consequently, many recyclers choose traditional disposal methods, like landfilling or incineration, over these expensive processing technologies, which impedes the overall advancement in the sustainable ASR valorization process.
Opportunities
Adapting ASR recycling technologies for e-waste and composite materials enhances material recovery, reduces landfill waste, and creates new revenue streams for recyclers.
The expansion of e-waste and composite material recycling presents a significant opportunity for the automotive shredded residue (ASR) market. Technologies for ASR recycling, like advanced sorting, pyrolysis, and chemical recovery, can be repurposed for the processing of e-waste and composite materials, the latter of which is on the rise with the greater uptake of electric vehicles (EVs) and lightweight automotive components. E-waste is rich in gold, silver, and copper, and its composite materials (carbon fiber and reinforced plastics) should have high-performance applications if appropriately recycled. Integrating these ASR processing techniques into these waste streams allows recyclers to improve material recovery rates while minimizing reliance on landfills. Furthermore, the increasing need for sustainable and recycled raw materials in manufacturing opens prospects for revenue generation. The growth of efficient recycling processes for electronics waste and composites will aid in sustainability alongside profitability for the ASR sector.
Challenges
Concerns over the quality, consistency, and performance of ASR-derived materials hinder their acceptance in industrial applications.
Public perception and industry hesitation toward ASR-derived materials stem from concerns about their quality, consistency, and usability in industrial applications. And many manufacturers are hesitant to use recycled ASR components because of possible impurities, structural weaknesses, and performance limits compared to virgin materials. In addition, a lack of consistent processing techniques leads to inconsistency in recovered materials, which hampers larger adoption. Specific sectors, including automotive, construction, and manufacturing, demand stringent material specifications, which make it difficult for products based on ASR to be accepted. Consumer skepticism about how durable and safe recycled materials are also hampers demand. Additionally, resistance from both the public and industrial sectors is driven by a lack of understanding and knowledge of advanced processing technologies for ASR. This is necessary due to increased investment in quality control, regulatory benefits, and technological development to enhance ASR material QXRG. Developing robust relationships with the industry and showcasing the economic and environmental advantages of recycling ASR will help drive change in this sector and bring growth to the market.
By Application
The landfill segment dominated with a market share of over 42% in 2023, due to the significant volume of non-recyclable materials generated from vehicle dismantling. Many elements, like mixed plastics, rubber, and some composites, are hard to separate and reuse effectively. And large-scale recycling is constrained by the absence of infrastructure for advanced recovery. In short, landfilling is the most convenient way to get rid of it. Although stricter landfill regulations exist in some areas, traditional waste management is still common in many countries, where they are not only cheaper but also logistically easier. But growing environmental concerns and more stringent regulations are spurring other approaches for other solutions like energy recovery and advanced material sorting, and these solutions may also decrease landfill reliance in the upcoming years.
By Composition
The Plastics segment dominated with a market share of over 38% in 2023. With increasing environmental worries and strict recycling requirements, there is a significant shift toward recovering and reusing plastic to lessen dependence on landfills. Innovations in sorting and separation technologies, including AI-driven optical sorting and chemical recycling, are also enabling the effective extraction of plastics from ASR. Moreover, the increasing adoption of circular economy models by automakers, as well as international regulatory mandates for sustainable material usage, will ensure the segment’s potent growth. To bring that to life, we have innovations and developments in bio-based and recyclable plastics as solutions to bring the people to a higher recovery rate and less environmental impact from ASR.
By Technology
The magnetic separation segment dominated with a market share of over 34% in 2023, due to its effectiveness in recovering ferrous metals, which make up a large share of ASR. With its efficiency, affordability, and widespread use among companies involved in metal recycling, it is no wonder that the top-tier clubs in the sport reside there. Nonetheless, it is the developments in optical sorting driven by artificial intelligence (AI) recognition and sensor developments in sorting that are emerging as the fastest-growing segment. Non-ferrous metals, valuable materials (like plastics), and even shredded tires will also be more efficiently recovered due to this technology. Increasing regulatory push, stricter landfill regulations, and the global transition toward a circular economy are propelling the adoption of accurate ASR separation technologies, with optical sorting being a primary point of innovation and investment within the market.
The North America region dominated with a market share of over 42% in 2023, owing to a highly developed auto recycling sector, stringent environmental policies, and a greater emphasis on sustainable material recovery. The region enjoys a well-established system of shredding facilities, metal recovery plants, and advanced separation technologies, facilitating effective ASR processing. It is further strengthening its leadership with high vehicle scrappage rates, driven by strict end-of-life vehicle (ELV) regulations. It also helps explain why North America leads, including through an abundance of large recycling firms and tech innovators. The ongoing industry focus towards building advanced sorting and metal extraction systems and government-level incentives for advanced circular economy initiatives are other important factors fuelling the growth of ASR recycling in North America, which is becoming a world hub for sustainable waste solutions.
Asia-Pacific is the fastest-growing region in the Automotive Shredded Residue (ASR) Market, due to the rapidly accelerating speed of industrialization, growth in the car dismantling process, and increasing investments aimed toward recycling technologies. Rising automotive sector and growing environmental concerns in countries such as China, India, and Japan are driving the ASR processing market. More stringent waste management regulations and policies encouraging sustainable material recovery are driving industries toward better advanced recycling solutions. Moreover, government-backed initiatives that promote circular economy practices are also driving the development of efficient ASR sorting and recovery infrastructure. Rising demand for high-value recovered materials, coupled with the development of AI-driven separation technologies further propelling the ASR market growth in the region.

Get Customized Report as per Your Business Requirement - Enquiry Now
Key Players
Tomra Systems ASA (Sensor-based sorting systems)
Galloo (Metal recycling, post-shredder technology)
Sims Limited (Metal recycling, ferrous & non-ferrous recovery)
MBA Polymers Inc. (Recycled plastics, polymer separation)
Binder+Co. (Screening, sensor-based sorting equipment)
PLANIC (ASR processing solutions)
Axion Ltd (Resource recovery, plastic recycling)
SRW metal float GmbH (Metal separation technologies)
Machinex Industries Inc. (Sorting systems, material recovery facilities)
Wendt Corporation (Shredders, separation technologies)
CP Manufacturing Inc. (Recycling equipment, advanced sorting systems)
BT-Wolfgang Binder GmbH (Material handling, processing equipment)
Agilyx (Plastic waste conversion technologies)
Steinert (Magnetic and sensor-based sorting systems)
Eriez Manufacturing Co. (Magnetic separators, metal detectors)
Bezner (Waste management, sorting systems)
Sesotec GmbH (Sorting, detection systems for recycling)
Picvisa (Optical sorting, robotic waste recovery)
Fornnax Technology Pvt Ltd (Shredders, granulators)
Lindner Washtech (Washing and sorting systems for plastics)
Suppliers for (metal recycling and ASR treatment, specializing in recovering ferrous and non-ferrous metals), Automotive Shredded Residue (ASR) Market
Galloo
MBA Polymers Inc.
Sims Limited
Tomra Systems ASA
STEINERT
SGM Magnetics
ELDAN Recycling
All controls
Ruijie Equipment
American Pulverizer Company
Recent Development
In June 2023, Galloo (Belgium) announced a joint venture with Stellantis (Netherlands) to advance end-of-life vehicle recycling. The service, set to launch in late 2023, will initially target France, Belgium, and Luxembourg, with plans for further expansion across Europe.
In January 2023, Wendt Corporation (US) partnered with Proman Infrastructure Services Ltd. (India) to establish Wendt Proman Metal Recycling Pvt. Ltd. This venture aims to tap into India’s growing demand for shredding and separation technologies in the recycling sector.
| Report Attributes | Details |
|---|---|
| Market Size in 2023 | USD 5.98 Billion |
| Market Size by 2032 | USD 8.93 Billion |
| CAGR | CAGR of 4.55% From 2024 to 2032 |
| Base Year | 2023 |
| Forecast Period | 2024-2032 |
| Historical Data | 2020-2022 |
| Report Scope & Coverage | Market Size, Segments Analysis, Competitive Landscape, Regional Analysis, DROC & SWOT Analysis, Forecast Outlook |
| Key Segments | • By Application (Landfill, Energy Recovery, Recycling) • By Composition (Metals, Plastics, Rubber, Textile, Others) • By Technology (Air Classification, Optical Sorting, Magnetic Separation, Eddy Current Separation, Screening, Others) |
| Regional Analysis/Coverage | North America (US, Canada, Mexico), Europe (Eastern Europe [Poland, Romania, Hungary, Turkey, Rest of Eastern Europe] Western Europe] Germany, France, UK, Italy, Spain, Netherlands, Switzerland, Austria, Rest of Western Europe]), Asia Pacific (China, India, Japan, South Korea, Vietnam, Singapore, Australia, Rest of Asia Pacific), Middle East & Africa (Middle East [UAE, Egypt, Saudi Arabia, Qatar, Rest of Middle East], Africa [Nigeria, South Africa, Rest of Africa], Latin America (Brazil, Argentina, Colombia, Rest of Latin America) |
| Company Profiles | Tomra Systems ASA, Galloo, Sims Limited, MBA Polymers Inc., Binder+Co., PLANIC, Axion Ltd, SRW metal float GmbH, Machinex Industries Inc., Wendt Corporation, CP Manufacturing Inc., BT-Wolfgang Binder GmbH, Agilyx, Steinert, Eriez Manufacturing Co., Bezner, Sesotec GmbH, Picvisa, Fornnax Technology Pvt Ltd, Lindner Washtech |
Ans: The Automotive Shredded Residue (ASR) Market is expected to grow at a CAGR of 4.55% from 2024-2032.
Ans: The Automotive Shredded Residue (ASR) Market was USD 5.98 billion in 2023 and is expected to reach USD 8.93 billion by 2032.
Ans: Stringent global ELV recycling regulations are driving the growth of the ASR market by boosting demand for advanced material recovery solutions.
Ans: The “landfill” segment dominated the Automotive Shredded Residue (ASR) Market.
Ans: North America dominated the Automotive Shredded Residue (ASR) Market in 2023
TABLE OF CONTENTS
1. Introduction
1.1 Market Definition
1.2 Scope (Inclusion and Exclusions)
1.3 Research Assumptions
2. Executive Summary
2.1 Market Overview
2.2 Regional Synopsis
2.3 Competitive Summary
3. Research Methodology
3.1 Top-Down Approach
3.2 Bottom-up Approach
3.3. Data Validation
3.4 Primary Interviews
4. Market Dynamics
4.1 Market Analysis
4.1.1 Drivers
4.1.2 Restraints
4.1.3 Opportunities
4.1.4 Challenges
4.2 PESTLE Analysis
4.3 Porter’s Five Forces Model
5. Statistical Insights and Trend Reporting
5.1 ASR Generation Volume, by Region (2020-2023)
5.2 Recycling and Recovery Rates, by Region (2020-2023)
5.3 Landfilling vs. Recycling Trends, by Region
5.4 Adoption of Advanced ASR Processing Technologies, by Region
5.5 Export/Import Data of Recovered Materials from ASR, by Region (2023)
6. Competitive Landscape
6.1 List of Major Companies, By Region
6.2 Market Share Analysis, By Region
6.3 Product Benchmarking
6.3.1 Product specifications and features
6.3.2 Pricing
6.4 Strategic Initiatives
6.4.1 Marketing and promotional activities
6.4.2 Distribution and Supply Chain Strategies
6.4.3 Expansion plans and new product launches
6.4.4 Strategic partnerships and collaborations
6.5 Technological Advancements
6.6 Market Positioning and Branding
7. Automotive Shredded Residue (ASR) Market Segmentation, By Application
7.1 Chapter Overview
7.2 Landfill
7.2.1 Landfill Market Trends Analysis (2020-2032)
7.2.2 Landfill Market Size Estimates and Forecasts to 2032 (USD Million)
7.3 Energy recovery
7.3.1 Energy Recovery Market Trends Analysis (2020-2032)
7.3.2 Energy recovery Market Size Estimates and Forecasts to 2032 (USD Million)
7.4 Recycling
7.4.1 Recycling Market Trends Analysis (2020-2032)
7.4.2 Recycling Market Size Estimates and Forecasts to 2032 (USD Million)
8. Automotive Shredded Residue (ASR) Market Segmentation, By Composition
8.1 Chapter Overview
8.2 Metals
8.2.1 Metals Market Trends Analysis (2020-2032)
8.2.2 Metals Market Size Estimates and Forecasts to 2032 (USD Million)
8.3 Plastics
8.3.1 Plastics Market Trends Analysis (2020-2032)
8.3.2 Plastics Market Size Estimates and Forecasts to 2032 (USD Million)
8.4 Rubber
8.4.1 Rubber Market Trends Analysis (2020-2032)
8.4.2 Rubber Market Size Estimates and Forecasts to 2032 (USD Million)
8.5 Textile
8.5.1 Textile Market Trends Analysis (2020-2032)
8.5.2 Textile Market Size Estimates and Forecasts to 2032 (USD Million)
8.6 Others
8.6.1 Other Market Trends Analysis (2020-2032)
8.6.2 Others Market Size Estimates and Forecasts to 2032 (USD Million)
9. Automotive Shredded Residue (ASR) Market Segmentation, By Technology
9.1 Chapter Overview
9.2 Air classification
9.2.1 Air classification Market Trends Analysis (2020-2032)
9.2.2 Air classification Market Size Estimates and Forecasts to 2032 (USD Million)
9.3 Optical sorting
9.3.1 Optical Sorting Market Trends Analysis (2020-2032)
9.3.2 Optical Sorting Market Size Estimates and Forecasts to 2032 (USD Million)
9.4 Magnetic separation
9.4.1 Magnetic Separation Market Trends Analysis (2020-2032)
9.4.2 Magnetic separation Market Size Estimates and Forecasts to 2032 (USD Million)
9.5 Eddy current separation
9.5.1 Eddy current separation Market Trends Analysis (2020-2032)
9.5.2 Eddy current separation Market Size Estimates and Forecasts to 2032 (USD Million)
9.6 Screening
9.6.1 Screening Market Trends Analysis (2020-2032)
9.6.2 Screening Market Size Estimates and Forecasts to 2032 (USD Million)
9.7 Others
9.7.1 Others Market Trends Analysis (2020-2032)
9.7.2 Others Market Size Estimates and Forecasts to 2032 (USD Million)
10. Regional Analysis
10.1 Chapter Overview
10.2 North America
10.2.1 Trends Analysis
10.2.2 North America Automotive Shredded Residue (ASR) Market Estimates and Forecasts, by Country (2020-2032) (USD Million)
10.2.3 North America Automotive Shredded Residue (ASR) Market Estimates and Forecasts, By Application (2020-2032) (USD Million)
10.2.4 North America Automotive Shredded Residue (ASR) Market Estimates and Forecasts, By Composition (2020-2032) (USD Million)
10.2.5 North America Automotive Shredded Residue (ASR) Market Estimates and Forecasts, By Technology (2020-2032) (USD Million)
10.2.6 USA
10.2.6.1 USA Automotive Shredded Residue (ASR) Market Estimates and Forecasts, By Application (2020-2032) (USD Million)
10.2.6.2 USA Automotive Shredded Residue (ASR) Market Estimates and Forecasts, By Composition (2020-2032) (USD Million)
10.2.6.3 USA Automotive Shredded Residue (ASR) Market Estimates and Forecasts, By Technology (2020-2032) (USD Million)
10.2.7 Canada
10.2.7.1 Canada Automotive Shredded Residue (ASR) Market Estimates and Forecasts, By Application (2020-2032) (USD Million)
10.2.7.2 Canada Automotive Shredded Residue (ASR) Market Estimates and Forecasts, By Composition (2020-2032) (USD Million)
10.2.7.3 Canada Automotive Shredded Residue (ASR) Market Estimates and Forecasts, By Technology (2020-2032) (USD Million)
10.2.8 Mexico
10.2.8.1 Mexico Automotive Shredded Residue (ASR) Market Estimates and Forecasts, By Application (2020-2032) (USD Million)
10.2.8.2 Mexico Automotive Shredded Residue (ASR) Market Estimates and Forecasts, By Composition (2020-2032) (USD Million)
10.2.8.3 Mexico Automotive Shredded Residue (ASR) Market Estimates and Forecasts, By Technology (2020-2032) (USD Million)
10.3 Europe
10.3.1 Eastern Europe
10.3.1.1 Trends Analysis
10.3.1.2 Eastern Europe Automotive Shredded Residue (ASR) Market Estimates and Forecasts, by Country (2020-2032) (USD Million)
10.3.1.3 Eastern Europe Automotive Shredded Residue (ASR) Market Estimates and Forecasts, By Application (2020-2032) (USD Million)
10.3.1.4 Eastern Europe Automotive Shredded Residue (ASR) Market Estimates and Forecasts, By Composition (2020-2032) (USD Million)
10.3.1.5 Eastern Europe Automotive Shredded Residue (ASR) Market Estimates and Forecasts, By Technology (2020-2032) (USD Million)
10.3.1.6 Poland
10.3.1.6.1 Poland Automotive Shredded Residue (ASR) Market Estimates and Forecasts, By Application (2020-2032) (USD Million)
10.3.1.6.2 Poland Automotive Shredded Residue (ASR) Market Estimates and Forecasts, By Composition (2020-2032) (USD Million)
10.3.1.6.3 Poland Automotive Shredded Residue (ASR) Market Estimates and Forecasts, By Technology (2020-2032) (USD Million)
10.3.1.7 Romania
10.3.1.7.1 Romania Automotive Shredded Residue (ASR) Market Estimates and Forecasts, By Application (2020-2032) (USD Million)
10.3.1.7.2 Romania Automotive Shredded Residue (ASR) Market Estimates and Forecasts, By Composition (2020-2032) (USD Million)
10.3.1.7.3 Romania Automotive Shredded Residue (ASR) Market Estimates and Forecasts, By Technology (2020-2032) (USD Million)
10.3.1.8 Hungary
10.3.1.8.1 Hungary Automotive Shredded Residue (ASR) Market Estimates and Forecasts, By Application (2020-2032) (USD Million)
10.3.1.8.2 Hungary Automotive Shredded Residue (ASR) Market Estimates and Forecasts, By Composition (2020-2032) (USD Million)
10.3.1.8.3 Hungary Automotive Shredded Residue (ASR) Market Estimates and Forecasts, By Technology (2020-2032) (USD Million)
10.3.1.9 Turkey
10.3.1.9.1 Turkey Automotive Shredded Residue (ASR) Market Estimates and Forecasts, By Application (2020-2032) (USD Million)
10.3.1.9.2 Turkey Automotive Shredded Residue (ASR) Market Estimates and Forecasts, By Composition (2020-2032) (USD Million)
10.3.1.9.3 Turkey Automotive Shredded Residue (ASR) Market Estimates and Forecasts, By Technology (2020-2032) (USD Million)
10.3.1.10 Rest of Eastern Europe
10.3.1.10.1 Rest of Eastern Europe Automotive Shredded Residue (ASR) Market Estimates and Forecasts, By Application (2020-2032) (USD Million)
10.3.1.10.2 Rest of Eastern Europe Automotive Shredded Residue (ASR) Market Estimates and Forecasts, By Composition (2020-2032) (USD Million)
10.3.1.10.3 Rest of Eastern Europe Automotive Shredded Residue (ASR) Market Estimates and Forecasts, By Technology (2020-2032) (USD Million)
10.3.2 Western Europe
10.3.2.1 Trends Analysis
10.3.2.2 Western Europe High-Pressure Seals Market Estimates and Forecasts, by Country (2020-2032) (USD Million)
10.3.2.3 Western Europe High-Pressure Seals Market Estimates and Forecasts, By Application (2020-2032) (USD Million)
10.3.2.4 Western Europe High-Pressure Seals Market Estimates and Forecasts, By Composition (2020-2032) (USD Million)
10.3.2.5 Western Europe High-Pressure Seals Market Estimates and Forecasts, By Technology (2020-2032) (USD Million)
10.3.2.6 Germany
10.3.2.6.1 Germany Automotive Shredded Residue (ASR) Market Estimates and Forecasts, By Application (2020-2032) (USD Million)
10.3.2.6.2 Germany Automotive Shredded Residue (ASR) Market Estimates and Forecasts, By Composition (2020-2032) (USD Million)
10.3.2.6.3 Germany Automotive Shredded Residue (ASR) Market Estimates and Forecasts, By Technology (2020-2032) (USD Million)
10.3.2.7 France
10.3.2.7.1 France Automotive Shredded Residue (ASR) Market Estimates and Forecasts, By Application (2020-2032) (USD Million)
10.3.2.7.2 France Automotive Shredded Residue (ASR) Market Estimates and Forecasts, By Composition (2020-2032) (USD Million)
10.3.2.7.3 France Automotive Shredded Residue (ASR) Market Estimates and Forecasts, By Technology (2020-2032) (USD Million)
10.3.2.8 UK
10.3.2.8.1 UK Automotive Shredded Residue (ASR) Market Estimates and Forecasts, By Application (2020-2032) (USD Million)
10.3.2.8.2 UK Automotive Shredded Residue (ASR) Market Estimates and Forecasts, By Composition (2020-2032) (USD Million)
10.3.2.8.3 UK Automotive Shredded Residue (ASR) Market Estimates and Forecasts, By Technology (2020-2032) (USD Million)
10.3.2.9 Italy
10.3.2.9.1 Italy Automotive Shredded Residue (ASR) Market Estimates and Forecasts, By Application (2020-2032) (USD Million)
10.3.2.9.2 Italy Automotive Shredded Residue (ASR) Market Estimates and Forecasts, By Composition (2020-2032) (USD Million)
10.3.2.9.3 Italy Automotive Shredded Residue (ASR) Market Estimates and Forecasts, By Technology (2020-2032) (USD Million)
10.3.2.10 Spain
10.3.2.10.1 Spain Automotive Shredded Residue (ASR) Market Estimates and Forecasts, By Application (2020-2032) (USD Million)
10.3.2.10.2 Spain Automotive Shredded Residue (ASR) Market Estimates and Forecasts, By Composition (2020-2032) (USD Million)
10.3.2.10.3 Spain Automotive Shredded Residue (ASR) Market Estimates and Forecasts, By Technology (2020-2032) (USD Million)
10.3.2.11 Netherlands
10.3.2.11.1 Netherlands Automotive Shredded Residue (ASR) Market Estimates and Forecasts, By Application (2020-2032) (USD Million)
10.3.2.11.2 Netherlands Automotive Shredded Residue (ASR) Market Estimates and Forecasts, By Composition (2020-2032) (USD Million)
10.3.2.11.3 Netherlands Automotive Shredded Residue (ASR) Market Estimates and Forecasts, By Technology (2020-2032) (USD Million)
10.3.2.12 Switzerland
10.3.2.12.1 Switzerland Automotive Shredded Residue (ASR) Market Estimates and Forecasts, By Application (2020-2032) (USD Million)
10.3.2.12.2 Switzerland Automotive Shredded Residue (ASR) Market Estimates and Forecasts, By Composition (2020-2032) (USD Million)
10.3.2.12.3 Switzerland Automotive Shredded Residue (ASR) Market Estimates and Forecasts, By Technology (2020-2032) (USD Million)
10.3.2.13 Austria
10.3.2.13.1 Austria Automotive Shredded Residue (ASR) Market Estimates and Forecasts, By Application (2020-2032) (USD Million)
10.3.2.13.2 Austria Automotive Shredded Residue (ASR) Market Estimates and Forecasts, By Composition (2020-2032) (USD Million)
10.3.2.13.3 Austria Automotive Shredded Residue (ASR) Market Estimates and Forecasts, By Technology (2020-2032) (USD Million)
10.3.2.14 Rest of Western Europe
10.3.2.14.1 Rest of Western Europe Automotive Shredded Residue (ASR) Market Estimates and Forecasts, By Application (2020-2032) (USD Million)
10.3.2.14.2 Rest of Western Europe Automotive Shredded Residue (ASR) Market Estimates and Forecasts, By Composition (2020-2032) (USD Million)
10.3.2.14.3 Rest of Western Europe Automotive Shredded Residue (ASR) Market Estimates and Forecasts, By Technology (2020-2032) (USD Million)
10.4 Asia-Pacific
10.4.1 Trends Analysis
10.4.2 Asia-Pacific Automotive Shredded Residue (ASR) Market Estimates and Forecasts, by Country (2020-2032) (USD Million)
10.4.3 Asia-Pacific Automotive Shredded Residue (ASR) Market Estimates and Forecasts, By Application (2020-2032) (USD Million)
10.4.4 Asia-Pacific Automotive Shredded Residue (ASR) Market Estimates and Forecasts, By Composition (2020-2032) (USD Million)
10.4.5 Asia-Pacific Automotive Shredded Residue (ASR) Market Estimates and Forecasts, By Technology (2020-2032) (USD Million)
10.4.6 China
10.4.6.1 China Automotive Shredded Residue (ASR) Market Estimates and Forecasts, By Application (2020-2032) (USD Million)
10.4.6.2 China Automotive Shredded Residue (ASR) Market Estimates and Forecasts, By Composition (2020-2032) (USD Million)
10.4.6.3 China Automotive Shredded Residue (ASR) Market Estimates and Forecasts, By Technology (2020-2032) (USD Million)
10.4.7 India
10.4.7.1 India Automotive Shredded Residue (ASR) Market Estimates and Forecasts, By Application (2020-2032) (USD Million)
10.4.7.2 India Automotive Shredded Residue (ASR) Market Estimates and Forecasts, By Composition (2020-2032) (USD Million)
10.4.7.3 India Automotive Shredded Residue (ASR) Market Estimates and Forecasts, By Technology (2020-2032) (USD Million)
10.4.8 Japan
10.4.8.1 Japan Automotive Shredded Residue (ASR) Market Estimates and Forecasts, By Application (2020-2032) (USD Million)
10.4.8.2 Japan Automotive Shredded Residue (ASR) Market Estimates and Forecasts, By Composition (2020-2032) (USD Million)
10.4.8.3 Japan Automotive Shredded Residue (ASR) Market Estimates and Forecasts, By Technology (2020-2032) (USD Million)
10.4.9 South Korea
10.4.9.1 South Korea Automotive Shredded Residue (ASR) Market Estimates and Forecasts, By Application (2020-2032) (USD Million)
10.4.9.2 South Korea Automotive Shredded Residue (ASR) Market Estimates and Forecasts, By Composition (2020-2032) (USD Million)
10.4.9.3 South Korea Automotive Shredded Residue (ASR) Market Estimates and Forecasts, By Technology (2020-2032) (USD Million)
10.4.10 Vietnam
10.4.10.1 Vietnam Automotive Shredded Residue (ASR) Market Estimates and Forecasts, By Application (2020-2032) (USD Million)
10.4.10.2 Vietnam Automotive Shredded Residue (ASR) Market Estimates and Forecasts, By Composition (2020-2032) (USD Million)
10.4.10.3 Vietnam Automotive Shredded Residue (ASR) Market Estimates and Forecasts, By Technology (2020-2032) (USD Million)
10.4.11 Singapore
10.4.11.1 Singapore Automotive Shredded Residue (ASR) Market Estimates and Forecasts, By Application (2020-2032) (USD Million)
10.4.11.2 Singapore Automotive Shredded Residue (ASR) Market Estimates and Forecasts, By Composition (2020-2032) (USD Million)
10.4.11.3 Singapore Automotive Shredded Residue (ASR) Market Estimates and Forecasts, By Technology (2020-2032) (USD Million)
10.4.12 Australia
10.4.12.1 Australia Automotive Shredded Residue (ASR) Market Estimates and Forecasts, By Application (2020-2032) (USD Million)
10.4.12.2 Australia Automotive Shredded Residue (ASR) Market Estimates and Forecasts, By Composition (2020-2032) (USD Million)
10.4.12.3 Australia Automotive Shredded Residue (ASR) Market Estimates and Forecasts, By Technology (2020-2032) (USD Million)
10.4.13 Rest of Asia-Pacific
10.4.13.1 Rest of Asia-Pacific Automotive Shredded Residue (ASR) Market Estimates and Forecasts, By Application (2020-2032) (USD Million)
10.4.13.2 Rest of Asia-Pacific Automotive Shredded Residue (ASR) Market Estimates and Forecasts, By Composition (2020-2032) (USD Million)
10.4.13.3 Rest of Asia-Pacific Automotive Shredded Residue (ASR) Market Estimates and Forecasts, By Technology (2020-2032) (USD Million)
10.5 Middle East and Africa
10.5.1 Middle East
10.5.1.1 Trends Analysis
10.5.1.2 Middle East Automotive Shredded Residue (ASR) Market Estimates and Forecasts, by Country (2020-2032) (USD Million)
10.5.1.3 Middle East Automotive Shredded Residue (ASR) Market Estimates and Forecasts, By Application (2020-2032) (USD Million)
10.5.1.4 Middle East Automotive Shredded Residue (ASR) Market Estimates and Forecasts, By Composition (2020-2032) (USD Million)
10.5.1.5 Middle East Automotive Shredded Residue (ASR) Market Estimates and Forecasts, By Technology (2020-2032) (USD Million)
10.5.1.6 UAE
10.5.1.6.1 UAE Automotive Shredded Residue (ASR) Market Estimates and Forecasts, By Application (2020-2032) (USD Million)
10.5.1.6.2 UAE Automotive Shredded Residue (ASR) Market Estimates and Forecasts, By Composition (2020-2032) (USD Million)
10.5.1.6.3 UAE Automotive Shredded Residue (ASR) Market Estimates and Forecasts, By Technology (2020-2032) (USD Million)
10.5.1.7 Egypt
10.5.1.7.1 Egypt Automotive Shredded Residue (ASR) Market Estimates and Forecasts, By Application (2020-2032) (USD Million)
10.5.1.7.2 Egypt Automotive Shredded Residue (ASR) Market Estimates and Forecasts, By Composition (2020-2032) (USD Million)
10.5.1.7.3 Egypt Automotive Shredded Residue (ASR) Market Estimates and Forecasts, By Technology (2020-2032) (USD Million)
10.5.1.8 Saudi Arabia
10.5.1.8.1 Saudi Arabia Automotive Shredded Residue (ASR) Market Estimates and Forecasts, By Application (2020-2032) (USD Million)
10.5.1.8.2 Saudi Arabia Automotive Shredded Residue (ASR) Market Estimates and Forecasts, By Composition (2020-2032) (USD Million)
10.5.1.8.3 Saudi Arabia Automotive Shredded Residue (ASR) Market Estimates and Forecasts, By Technology (2020-2032) (USD Million)
10.5.1.9 Qatar
10.5.1.9.1 Qatar Automotive Shredded Residue (ASR) Market Estimates and Forecasts, By Application (2020-2032) (USD Million)
10.5.1.9.2 Qatar Automotive Shredded Residue (ASR) Market Estimates and Forecasts, By Composition (2020-2032) (USD Million)
10.5.1.9.3 Qatar Automotive Shredded Residue (ASR) Market Estimates and Forecasts, By Technology (2020-2032) (USD Million)
10.5.1.10 Rest of Middle East
10.5.1.10.1 Rest of Middle East Automotive Shredded Residue (ASR) Market Estimates and Forecasts, By Application (2020-2032) (USD Million)
10.5.1.10.2 Rest of Middle East Automotive Shredded Residue (ASR) Market Estimates and Forecasts, By Composition (2020-2032) (USD Million)
10.5.1.10.3 Rest of Middle East Automotive Shredded Residue (ASR) Market Estimates and Forecasts, By Technology (2020-2032) (USD Million)
10.5.2 Africa
10.5.2.1 Trends Analysis
10.5.2.2 Africa Automotive Shredded Residue (ASR) Market Estimates and Forecasts, by Country (2020-2032) (USD Million)
10.5.2.3 Africa Automotive Shredded Residue (ASR) Market Estimates and Forecasts, By Application (2020-2032) (USD Million)
10.5.2.4 Africa Automotive Shredded Residue (ASR) Market Estimates and Forecasts, By Composition (2020-2032) (USD Million)
10.5.2.5 Africa Automotive Shredded Residue (ASR) Market Estimates and Forecasts, By Technology (2020-2032) (USD Million)
10.5.2.6 South Africa
10.5.2.6.1 South Africa Automotive Shredded Residue (ASR) Market Estimates and Forecasts, By Application (2020-2032) (USD Million)
10.5.2.6.2 South Africa Automotive Shredded Residue (ASR) Market Estimates and Forecasts, By Composition (2020-2032) (USD Million)
10.5.2.6.3 South Africa Automotive Shredded Residue (ASR) Market Estimates and Forecasts, By Technology (2020-2032) (USD Million)
10.5.2.7 Nigeria
10.5.2.7.1 Nigeria Automotive Shredded Residue (ASR) Market Estimates and Forecasts, By Application (2020-2032) (USD Million)
10.5.2.7.2 Nigeria Automotive Shredded Residue (ASR) Market Estimates and Forecasts, By Composition (2020-2032) (USD Million)
10.5.2.7.3 Nigeria Automotive Shredded Residue (ASR) Market Estimates and Forecasts, By Technology (2020-2032) (USD Million)
10.5.2.8 Rest of Africa
10.5.2.8.1 Rest of Africa Automotive Shredded Residue (ASR) Market Estimates and Forecasts, By Application (2020-2032) (USD Million)
10.5.2.8.2 Rest of Africa Automotive Shredded Residue (ASR) Market Estimates and Forecasts, By Composition (2020-2032) (USD Million)
10.5.2.8.3 Rest of Africa Automotive Shredded Residue (ASR) Market Estimates and Forecasts, By Technology (2020-2032) (USD Million)
10.6 Latin America
10.6.1 Trends Analysis
10.6.2 Latin America Automotive Shredded Residue (ASR) Market Estimates and Forecasts, by Country (2020-2032) (USD Million)
10.6.3 Latin America Automotive Shredded Residue (ASR) Market Estimates and Forecasts, By Application (2020-2032) (USD Million)
10.6.4 Latin America Automotive Shredded Residue (ASR) Market Estimates and Forecasts, By Composition (2020-2032) (USD Million)
10.6.5 Latin America Automotive Shredded Residue (ASR) Market Estimates and Forecasts, By Technology (2020-2032) (USD Million)
10.6.6 Brazil
10.6.6.1 Brazil Automotive Shredded Residue (ASR) Market Estimates and Forecasts, By Application (2020-2032) (USD Million)
10.6.6.2 Brazil Automotive Shredded Residue (ASR) Market Estimates and Forecasts, By Composition (2020-2032) (USD Million)
10.6.6.3 Brazil Automotive Shredded Residue (ASR) Market Estimates and Forecasts, By Technology (2020-2032) (USD Million)
10.6.7 Argentina
10.6.7.1 Argentina Automotive Shredded Residue (ASR) Market Estimates and Forecasts, By Application (2020-2032) (USD Million)
10.6.7.2 Argentina Automotive Shredded Residue (ASR) Market Estimates and Forecasts, By Composition (2020-2032) (USD Million)
10.6.7.3 Argentina Automotive Shredded Residue (ASR) Market Estimates and Forecasts, By Technology (2020-2032) (USD Million)
10.6.8 Colombia
10.6.8.1 Colombia Automotive Shredded Residue (ASR) Market Estimates and Forecasts, By Application (2020-2032) (USD Million)
10.6.8.2 Colombia Automotive Shredded Residue (ASR) Market Estimates and Forecasts, By Composition (2020-2032) (USD Million)
10.6.8.3 Colombia Automotive Shredded Residue (ASR) Market Estimates and Forecasts, By Technology (2020-2032) (USD Million)
10.6.9 Rest of Latin America
10.6.9.1 Rest of Latin America Automotive Shredded Residue (ASR) Market Estimates and Forecasts, By Application (2020-2032) (USD Million)
10.6.9.2 Rest of Latin America Automotive Shredded Residue (ASR) Market Estimates and Forecasts, By Composition (2020-2032) (USD Million)
10.6.9.3 Rest of Latin America Automotive Shredded Residue (ASR) Market Estimates and Forecasts, By Technology (2020-2032) (USD Million)
11. Company Profiles
11.1 Galloo
11.1.1 Company Overview
11.1.2 Financial
11.1.3 Products/ Services Offered
11.1.4 SWOT Analysis
11.2 MBA Polymers Inc.
11.2.1 Company Overview
11.2.2 Financial
11.2.3 Products/ Services Offered
11.2.4 SWOT Analysis
11.3 PLANIC
11.3.1 Company Overview
11.3.2 Financial
11.3.3 Products/ Services Offered
11.3.4 SWOT Analysis
11.4 Sims Limited
11.4.1 Company Overview
11.4.2 Financial
11.4.3 Products/ Services Offered
11.4.4 SWOT Analysis
11.5 Axion Ltd
11.5.1 Company Overview
11.5.2 Financial
11.5.3 Products/ Services Offered
11.5.4 SWOT Analysis
11.6 SRW metal float GmbH
11.6.1 Company Overview
11.6.2 Financial
11.6.3 Products/ Services Offered
11.6.4 SWOT Analysis
11.7 Machinex Industries Inc.
11.7.1 Company Overview
11.7.2 Financial
11.7.3 Products/ Services Offered
11.7.4 SWOT Analysis
11.8 Wendt Corporation
11.8.1 Company Overview
11.8.2 Financial
11.8.3 Products/ Services Offered
11.8.4 SWOT Analysis
11.9 Binder+Co.
11.9.1 Company Overview
11.9.2 Financial
11.9.3 Products/ Services Offered
11.9.4 SWOT Analysis
11.10 CP Manufacturing Inc.
11.10.1 Company Overview
11.10.2 Financial
11.10.3 Products/ Services Offered
11.10.4 SWOT Analysis
12. Use Cases and Best Practices
13. Conclusion
An accurate research report requires proper strategizing as well as implementation. There are multiple factors involved in the completion of good and accurate research report and selecting the best methodology to compete the research is the toughest part. Since the research reports we provide play a crucial role in any company’s decision-making process, therefore we at SNS Insider always believe that we should choose the best method which gives us results closer to reality. This allows us to reach at a stage wherein we can provide our clients best and accurate investment to output ratio.
Each report that we prepare takes a timeframe of 350-400 business hours for production. Starting from the selection of titles through a couple of in-depth brain storming session to the final QC process before uploading our titles on our website we dedicate around 350 working hours. The titles are selected based on their current market cap and the foreseen CAGR and growth.
The 5 steps process:
Step 1: Secondary Research:
Secondary Research or Desk Research is as the name suggests is a research process wherein, we collect data through the readily available information. In this process we use various paid and unpaid databases which our team has access to and gather data through the same. This includes examining of listed companies’ annual reports, Journals, SEC filling etc. Apart from this our team has access to various associations across the globe across different industries. Lastly, we have exchange relationships with various university as well as individual libraries.

Step 2: Primary Research
When we talk about primary research, it is a type of study in which the researchers collect relevant data samples directly, rather than relying on previously collected data. This type of research is focused on gaining content specific facts that can be sued to solve specific problems. Since the collected data is fresh and first hand therefore it makes the study more accurate and genuine.
We at SNS Insider have divided Primary Research into 2 parts.
Part 1 wherein we interview the KOLs of major players as well as the upcoming ones across various geographic regions. This allows us to have their view over the market scenario and acts as an important tool to come closer to the accurate market numbers. As many as 45 paid and unpaid primary interviews are taken from both the demand and supply side of the industry to make sure we land at an accurate judgement and analysis of the market.
This step involves the triangulation of data wherein our team analyses the interview transcripts, online survey responses and observation of on filed participants. The below mentioned chart should give a better understanding of the part 1 of the primary interview.

Part 2: In this part of primary research the data collected via secondary research and the part 1 of the primary research is validated with the interviews from individual consultants and subject matter experts.
Consultants are those set of people who have at least 12 years of experience and expertise within the industry whereas Subject Matter Experts are those with at least 15 years of experience behind their back within the same space. The data with the help of two main processes i.e., FGDs (Focused Group Discussions) and IDs (Individual Discussions). This gives us a 3rd party nonbiased primary view of the market scenario making it a more dependable one while collation of the data pointers.
Step 3: Data Bank Validation
Once all the information is collected via primary and secondary sources, we run that information for data validation. At our intelligence centre our research heads track a lot of information related to the market which includes the quarterly reports, the daily stock prices, and other relevant information. Our data bank server gets updated every fortnight and that is how the information which we collected using our primary and secondary information is revalidated in real time.

Step 4: QA/QC Process
After all the data collection and validation our team does a final level of quality check and quality assurance to get rid of any unwanted or undesired mistakes. This might include but not limited to getting rid of the any typos, duplication of numbers or missing of any important information. The people involved in this process include technical content writers, research heads and graphics people. Once this process is completed the title gets uploader on our platform for our clients to read it.
Step 5: Final QC/QA Process:
This is the last process and comes when the client has ordered the study. In this process a final QA/QC is done before the study is emailed to the client. Since we believe in giving our clients a good experience of our research studies, therefore, to make sure that we do not lack at our end in any way humanly possible we do a final round of quality check and then dispatch the study to the client.
By Application
Landfill
Energy recovery
Recycling
By Composition
Metals
Plastics
Rubber
Textile
Others
By Technology
Air classification
Optical sorting
Magnetic separation
Eddy current separation
Screening
Others
Request for Segment Customization as per your Business Requirement: Segment Customization Request
North America
US
Canada
Mexico
Europe
Eastern Europe
Poland
Romania
Hungary
Turkey
Rest of Eastern Europe
Western Europe
Germany
France
UK
Italy
Spain
Netherlands
Switzerland
Austria
Rest of Western Europe
Asia Pacific
China
India
Japan
South Korea
Vietnam
Singapore
Australia
Rest of Asia Pacific
Middle East & Africa
Middle East
UAE
Egypt
Saudi Arabia
Qatar
Rest of Middle East
Africa
Nigeria
South Africa
Rest of Africa
Latin America
Brazil
Argentina
Colombia
Rest of Latin America
Request for Country Level Research Report: Country Level Customization Request
Available Customization
With the given market data, SNS Insider offers customization as per the company’s specific needs. The following customization options are available for the report:
Detailed Volume Analysis
Criss-Cross segment analysis (e.g. Product X Application)
Competitive Product Benchmarking
Geographic Analysis
Additional countries in any of the regions
Customized Data Representation
Detailed analysis and profiling of additional market players
The Extrusion Machinery Market was estimated at USD 8.53 billion in 2023 and is expected to reach USD 17.76 billion by 2032, with a growing CAGR of 8.49% over the forecast period 2024-2032.
The Mechanical Control Cables Market was estimated at USD 11.00 billion in 2023 and is expected to reach USD 17.66 billion by 2032, with a growing CAGR of 5.47% over the forecast period 2024-2032.
The Sanding Pads Market Size was valued at USD 2.98 Billion in 2023 and is estimated to reach USD 4.48 Billion by 2032, at a CAGR of 4.63% from 2024-2032.
The Packaging Machinery Market size was valued at USD 46.2 Billion in 2023 and is now anticipated to grow to USD 73.09 Billion by 2032, displaying a compound annual growth rate CAGR of 5.23% during the forecast Period 2024-2032.
The Conveying Equipment Market Size was estimated at USD 52.39 billion in 2023 and is expected to arrive at USD 73.55 billion by 2032 with a growing CAGR of 3.84% over the forecast period 2024-2032.
The Pressure Transmitter Market size was valued at USD 3 Billion in 2023 and will Reach to USD 4.19 Billion by 2031, Growing at a CAGR of 3.8% by 2024-2031.

Hi! Click one of our member below to chat on Phone
© 2025 All Rights Reserved by SNS Insider Pvt Ltd


