image

Automotive Low Voltage Drives Market Report Scope & Overview:

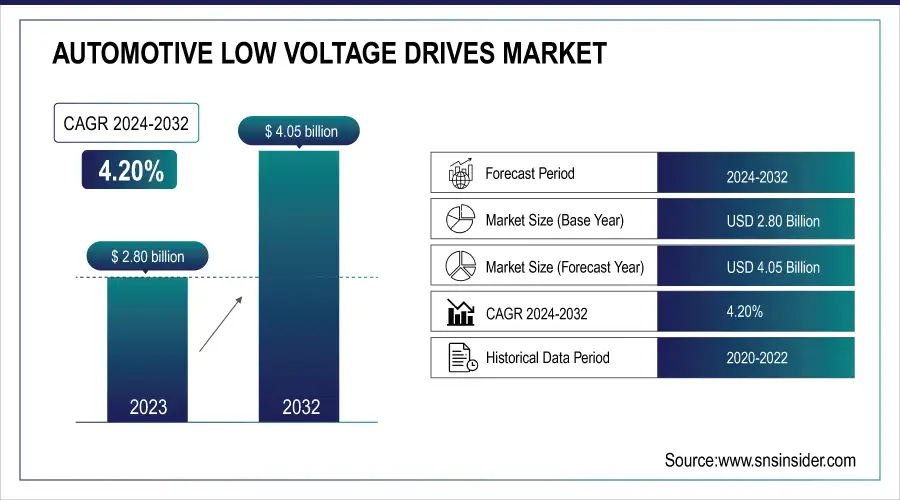
The Automotive Low Voltage Drives Market was valued at USD 2.80 billion in 2023 and is expected to reach USD 4.05 billion by 2032, growing at a CAGR of 4.20% over the forecast period 2024-2032. 
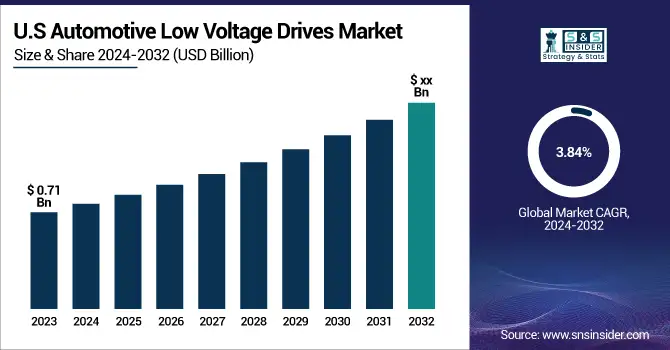
The Automotive Low Voltage Drives market is tapping into the effectiveness of fab/assembly line utilization rates, which is significantly aiding the optimization of the production process. This gives huge scope for energy saving, combined with better motor control and lesser power consumption. System-level Integration metrics focus on exciting vehicle performance improvements with system complexity reduction. Combined with AI, software-enhanced drive integration facilitates predictive maintenance, performance optimization, and adaptive control, making automotive applications even more efficient and reliable. The U.S. automotive low voltage drives market is driven by increased vehicle production, in 2023, around 10.6 million units will be manufactured, and also by a growing need for EVs. EV adoption and domestic battery supply chains are poised to benefit from government incentives, like the USD 370 billion investment under the Inflation Reduction Act. All of these create an added drive for low-voltage drive technologies in the U.S. automotive industry.

The U.S. Automotive Low Voltage Drives Market is estimated to be USD 0.71 Billion in 2023 and is projected to grow at a CAGR of 3.84%. Expanding automotive sector owing to rising need for energy efficient solutions in vehicles is propelling the growth of U.S. low voltage drives market in automotive applications. Such growth can be attributed to technology development in motor control and the expanding electric vehicle (EV) ecosystem, in addition to increasing demands for enhanced performance and energy efficiency in conventional and electric drivetrains.

Market Dynamics

Key Drivers: 

  • Driving Forces Behind Automotive Low-Voltage Drives Market Growth in Electric and Hybrid Vehicles

Expanded Demand for electric vehicles (EVs) and hybrid electric vehicles (HEVs) is one of the most prominent factors driving the automotive low voltage drives market since most components in EVs and HEVs rely on efficient and compact drive systems such as HVAC systems, power steering, and infotainment, low voltage drives for automotive are highly preferred. Moreover, growing regulations on fuel efficiency and emissions are forcing OEMs to adopt low-voltage drives to manage energy consumption throughout the vehicle subsystems. The expanding use of vehicle electrification, from electric pumps to compressors and auxiliary systems, only serves to drive the demand up even higher. Lower-voltage drive technology developments in power electronics and motor control systems are also improving the performance and efficiency of low-voltage drives, which are contributing to increased adoption.

Restrain: 

  • Challenges in Integrating Automotive Low Voltage Drives with Advanced Vehicle Architectures and Systems

Integration of automotive low-voltage drives with modern vehicle architectures is one of the chief restraints in the automotive low-voltage drives market. As vehicles gain in sophistication with the addition of electronic control units (ECUs), sensors, and features driven by software, communicating and performing consistently across subsystems presents a major technical challenge. Additionally, ensuring reliability and safety in critical functionalities such as steering or braking necessitates extensive testing and validation, thereby prolonging product development and deployment.

Opportunity:

  • Opportunities in Automotive Low Voltage Drives Driven by Autonomous Vehicles and Smart Connected Systems

As autonomous vehicles and intelligent vehicle control systems gain traction, the market is creating new opportunities through the development of smart and connected drive systems. The widespread adoption of 48V in many new vehicles presents a new opportunity for low-voltage drive technologies that offer a sweet spot between cost, performance, and efficiency. There are fresh opportunities in emerging economies, especially in the Asia Pacific and Latin America, arising from rapid urbanization, growth in automotive production, and government initiatives encouraging the adoption of electric mobility. In addition to this, the growing implementation of IoT and AI in automotive systems is fuelling the requirements for accurate, responsive, and efficient drive solutions, which will further contribute to the growth of the automotive gearbox market in the coming years.

Challenges:

  • Harmonization and Engineering Challenges in Automotive Low Voltage Drive Technologies Across Vehicle Platforms

The other big issue is the harmonization of low-voltage drive technologies between various vehicle platforms and from different manufacturers. Due to the absence of common protocols and specifications, the focus of customization will lie with each model or brand due to compatibility issues. As systems continue to be packed tightly and operate at higher power levels, thermal management and EMI (electromagnetic interference) suppression in small automotive spaces are other distance-engineering challenges of the future. Lastly, in such a fast-changing tech scenario, manufacturers need constant investment in R&D to remain competitive, which requires skilled technical know-how and agility.

Segment Analysis

By Power Range

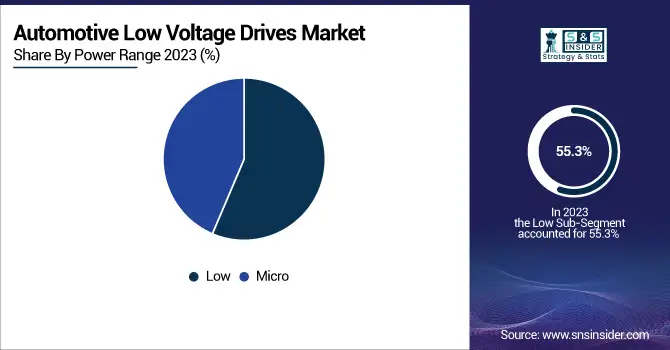
The Low power range segment accounted for the highest market share of 55.3% in 2023. These include HVAC systems, power steering, electric pumps, etc., for automotive applications, key automotive applications that support the prevalence of the low-power drives sector, thereby accounting for its dominance. These provide the same balance between performance and energy efficiency, serving both functions well, which is the reason they are more popular today and in modern cars or vehicles, particularly for those that are electric or hybrid.

The Micropower range segment is expected to have the fastest CAGR from 2024 to 2032. This growth can be attributed to the rising demand for compact electronic systems in vehicles, such as infotainment systems, electric mirrors, power windows, and seat actuators. In addition, the growing trend toward lightweight, energy-efficient vehicle architectures is creating opportunities for micro drives, wherein the ability to save space and energy is of utmost importance, particularly in compact cars and next-gen EVs.

By Drive

The automotive low-voltage drives market for AC drives had the largest share in 2023, contributing to 53.2% of the total revenue. This position is primarily caused by the high effectiveness, dependability, and wide range of scale utilization of wrench drives in car frameworks, for example, AC engines in HVAC, cooling fans, pumps, and footing frameworks for electric vehicles. The lower maintenance needs and compatibility with new vehicle architectures make them ideal for mass adoption across conventional or electric vehicle platforms.

The Servo drive segment is expected to register the fastest compound annual growth rate (CAGR) from 2024 to 2032. The growth is attributed to its increased demand for precise control in emerging vehicle systems such as automated driving, adaptive headlights, electronically controlled braking, and steering systems. Servo drives deliver leading speed, accuracy, and feedback control performance, which is critical for smart vehicle generations and highly automated functions going forward.

Regional Analysis

In 2023, North America accounted for a 32.3% share of the automotive low-voltage drives market, primarily attributable to the presence of a large number of leading automakers in the region, early investment in automotive technology, and heavy demand for electric and hybrid vehicles in the region. Many of the OEMs and Tier-1 suppliers on the largest base in North America seek cutting-edge innovations in areas like vehicle electrification, energy efficiency, and other facets of smart mobility Tesla is an actual example that leverages low voltage AC drives in its EV models to drive systems such as battery cooling, HVAC, and traction motors. Energy-efficient drive technologies have been expanded in the region, given its strong R&D ecosystem as well as stringent emission regulations.

Asia Pacific is expected to be the fastest-growing region from 2024 to 2032, owing to the growth of the automotive market, high adoption of EVs, and supportive government initiatives for electrification. Smart Mobility and Green Transportation Investments Smart mobility and green transportation are also garnering huge interest as countries like China, India, South Korea, and Japan have heavily invested in these functionalities in their automotive industry. BYD (China), a top EV manufacturer, incorporates a lot of low-voltage drives in its electric vehicles used for vehicle systems like battery management, climate control, and drive control. It is undoubtedly a major hotspot for future growth due to the region's low-cost manufacturing and growing consumer base.

Key players

Some of the major players in the Automotive Low Voltage Drives Market are:

  • Siemens AG (SINAMICS V20),

  • ABB Ltd (ACS150),

  • Schneider Electric (Altivar 12),

  • Rockwell Automation (PowerFlex 4M),

  • Mitsubishi Electric Corporation (FR-D700),

  • Yaskawa Electric Corporation (GA500),

  • Danfoss Group (VLT Micro Drive FC 51),

  • WEG Industries (CFW100 Mini Drive),

  • Hitachi Ltd (WJ200 Series),

  • Fuji Electric Co., Ltd. (FRENIC-Mini),

  • Toshiba Corporation (TOSVERT VF-S15),

  • Lenze SE (i500 Inverter),

  • Nidec Corporation (Commander C200),

  • SEW-Eurodrive (MOVITRAC B),

  • Delta Electronics, Inc. (VFD-E Series).

Recent Trends

  • In November 2024, ABB launched the ACS8080, a next-gen medium voltage drive offering up to 98% efficiency and advanced diagnostics for faster troubleshooting. Designed for versatile industrial use, it features improved motor control and ABB’s Crealizer software platform for enhanced performance.

  • In July 2024, Danfoss Power Solutions launched the ePanda eDrive, a compact and high-efficiency low-voltage drive designed for mobile work platforms. It delivers up to 94% efficiency and meets ISO 13849 safety standards.

Automotive Low Voltage Drives Market Report Scope:

Report Attributes Details
Market Size in 2023 USD 2.80 Billion
Market Size by 2032 USD 4.05 Billion
CAGR CAGR of 4.20% From 2024 to 2032
Base Year 2023
Forecast Period 2024-2032
Historical Data 2020-2022
Report Scope & Coverage Market Size, Segments Analysis, Competitive  Landscape, Regional Analysis, DROC & SWOT Analysis, Forecast Outlook
Key Segments • By Power Range (Micro, Low)
• By Drive (AC, DC, Servo)
Regional Analysis/Coverage North America (US, Canada, Mexico), Europe (Eastern Europe [Poland, Romania, Hungary, Turkey, Rest of Eastern Europe] Western Europe] Germany, France, UK, Italy, Spain, Netherlands, Switzerland, Austria, Rest of Western Europe]), Asia Pacific (China, India, Japan, South Korea, Vietnam, Singapore, Australia, Rest of Asia Pacific), Middle East & Africa (Middle East [UAE, Egypt, Saudi Arabia, Qatar, Rest of Middle East], Africa [Nigeria, South Africa, Rest of Africa], Latin America (Brazil, Argentina, Colombia, Rest of Latin America)
Company Profiles Siemens AG, ABB Ltd, Schneider Electric, Rockwell Automation, Mitsubishi Electric Corporation, Yaskawa Electric Corporation, Danfoss Group, WEG Industries, Hitachi Ltd, Fuji Electric Co., Ltd., Toshiba Corporation, Lenze SE, Nidec Corporation, SEW-Eurodrive, Delta Electronics, Inc.

Frequently Asked Questions

Ans: The Automotive Low Voltage Drives Market is expected to grow at a CAGR of 4.20% during 2024-2032.

 Ans: Automotive Low Voltage Drives Market size was USD 2.80 Billion in 2023 and is expected to Reach USD 4.05 Billion by 2032.

Ans: The major growth factor of the Automotive Low Voltage Drives market is the rising adoption of electric and hybrid vehicles requiring efficient, compact, and energy-saving drive systems.

Ans: The Low segment dominated the Automotive Low Voltage Drives market in 2023.

Ans: North America dominated the Automotive Low Voltage Drives Market in 2023.

Table of Content

1. Introduction

1.1 Market Definition

1.2 Scope (Inclusion and Exclusions)

1.3 Research Assumptions

2. Executive Summary

2.1 Market Overview

2.2 Regional Synopsis

2.3 Competitive Summary

3. Research Methodology

3.1 Top-Down Approach

3.2 Bottom-up Approach

3.3. Data Validation

3.4 Primary Interviews

4. Market Dynamics Impact Analysis

4.1 Market Driving Factors Analysis

4.1.1 Drivers

4.1.2 Restraints

4.1.3 Opportunities

4.1.4 Challenges

4.2 PESTLE Analysis

4.3 Porter’s Five Forces Model

5. Statistical Insights and Trends Reporting

5.1 Fab/Assembly Line Utilization Rates

5.2 Energy Savings Potential

5.3 System-Level Integration Metrics

5.4 AI/Software-Enhanced Drive Integration

6. Competitive Landscape

6.1 List of Major Companies, By Region

6.2 Market Share Analysis, By Region

6.3 Product Benchmarking

6.3.1 Product specifications and features

6.3.2 Pricing

6.4 Strategic Initiatives

6.4.1 Marketing and promotional activities

6.4.2 Distribution and Supply Chain Strategies

6.4.3 Expansion plans and new product launches

6.4.4 Strategic partnerships and collaborations

6.5 Technological Advancements

6.6 Market Positioning and Branding

7. Automotive Low Voltage Drives Market Segmentation, By Power Range

7.1 Chapter Overview

7.2 Micro

7.2.1 Micro Market Trends Analysis (2020-2032)

7.2.2 Micro Market Size Estimates and Forecasts to 2032 (USD BILLION)

7.3 Low

7.3.1 Low Market Trends Analysis (2020-2032)

7.3.2 Low Market Size Estimates and Forecasts to 2032 (USD BILLION)

8. Automotive Low Voltage Drives Market Segmentation, By Drive

8.1 Chapter Overview

8.2 AC

8.2.1 AC Market Trends Analysis (2020-2032)

8.2.2 AC Market Size Estimates and Forecasts to 2032 (USD BILLION)

8.3 DC

8.3.1 DC Market Trends Analysis (2020-2032)

8.3.2 DC Market Size Estimates and Forecasts to 2032 (USD BILLION)

8.4 Servo

8.4.1 Servo Market Trends Analysis (2020-2032)

8.4.2 Servo Market Size Estimates and Forecasts to 2032 (USD BILLION)

9. Regional Analysis

9.1 Chapter Overview

9.2 North America

9.2.1 Trends Analysis

9.2.2 North America Automotive Low Voltage Drives Market Estimates and Forecasts, by Country (2020-2032) (USD BILLION)

9.2.3 North America Automotive Low Voltage Drives Market Estimates and Forecasts, By Power Range (2020-2032) (USD BILLION) 

9.2.4 North America Automotive Low Voltage Drives Market Estimates and Forecasts, By Drive (2020-2032) (USD BILLION)

9.2.5 USA

9.2.5.1 USA Automotive Low Voltage Drives Market Estimates and Forecasts, By Power Range (2020-2032) (USD BILLION)

9.2.5.2 USA Automotive Low Voltage Drives Market Estimates and Forecasts, By Drive (2020-2032) (USD BILLION)

9.2.6 Canada

9.2.6.1 Canada Automotive Low Voltage Drives Market Estimates and Forecasts, By Power Range (2020-2032) (USD BILLION)

9.2.6.2 Canada Automotive Low Voltage Drives Market Estimates and Forecasts, By Drive (2020-2032) (USD BILLION)

9.2.7 Mexico

9.2.7.1 Mexico Automotive Low Voltage Drives Market Estimates and Forecasts, By Power Range (2020-2032) (USD BILLION)

9.2.7.2 Mexico Automotive Low Voltage Drives Market Estimates and Forecasts, By Drive (2020-2032) (USD BILLION)

9.3 Europe

9.3.1 Eastern Europe

9.3.1.1 Trends Analysis

9.3.1.2 Eastern Europe Automotive Low Voltage Drives Market Estimates and Forecasts, by Country (2020-2032) (USD BILLION)

9.3.1.3 Eastern Europe Automotive Low Voltage Drives Market Estimates and Forecasts, By Power Range (2020-2032) (USD BILLION) 

9.3.1.4 Eastern Europe Automotive Low Voltage Drives Market Estimates and Forecasts, By Drive (2020-2032) (USD BILLION)

9.3.1.5 Poland

9.3.1.5.1 Poland Automotive Low Voltage Drives Market Estimates and Forecasts, By Power Range (2020-2032) (USD BILLION)

9.3.1.5.2 Poland Automotive Low Voltage Drives Market Estimates and Forecasts, By Drive (2020-2032) (USD BILLION)

9.3.1.6 Romania

9.3.1.6.1 Romania Automotive Low Voltage Drives Market Estimates and Forecasts, By Power Range (2020-2032) (USD BILLION)

9.3.1.6.2 Romania Automotive Low Voltage Drives Market Estimates and Forecasts, By Drive (2020-2032) (USD BILLION)

9.3.1.7 Hungary

9.3.1.7.1 Hungary Automotive Low Voltage Drives Market Estimates and Forecasts, By Power Range (2020-2032) (USD BILLION)

9.3.1.7.2 Hungary Automotive Low Voltage Drives Market Estimates and Forecasts, By Drive (2020-2032) (USD BILLION)

9.3.1.8 turkey

9.3.1.8.1 Turkey Automotive Low Voltage Drives Market Estimates and Forecasts, By Power Range (2020-2032) (USD BILLION)

9.3.1.8.2 Turkey Automotive Low Voltage Drives Market Estimates and Forecasts, By Drive (2020-2032) (USD BILLION)

9.3.1.9 Rest of Eastern Europe

9.3.1.9.1 Rest of Eastern Europe Automotive Low Voltage Drives Market Estimates and Forecasts, By Power Range (2020-2032) (USD BILLION)

9.3.1.9.2 Rest of Eastern Europe Automotive Low Voltage Drives Market Estimates and Forecasts, By Drive (2020-2032) (USD BILLION)

9.3.2 Western Europe

9.3.2.1 Trends Analysis

9.3.2.2 Western Europe Automotive Low Voltage Drives Market Estimates and Forecasts, by Country (2020-2032) (USD BILLION)

9.3.2.3 Western Europe Automotive Low Voltage Drives Market Estimates and Forecasts, By Power Range (2020-2032) (USD BILLION) 

9.3.2.4 Western Europe Automotive Low Voltage Drives Market Estimates and Forecasts, By Drive (2020-2032) (USD BILLION)

9.3.2.5 Germany

9.3.2.5.1 Germany Automotive Low Voltage Drives Market Estimates and Forecasts, By Power Range (2020-2032) (USD BILLION)

9.3.2.5.2 Germany Automotive Low Voltage Drives Market Estimates and Forecasts, By Drive (2020-2032) (USD BILLION)

9.3.2.6 France

9.3.2.6.1 France Automotive Low Voltage Drives Market Estimates and Forecasts, By Power Range (2020-2032) (USD BILLION)

9.3.2.6.2 France Automotive Low Voltage Drives Market Estimates and Forecasts, By Drive (2020-2032) (USD BILLION)

9.3.2.7 UK

9.3.2.7.1 UK Automotive Low Voltage Drives Market Estimates and Forecasts, By Power Range (2020-2032) (USD BILLION)

9.3.2.7.2 UK Automotive Low Voltage Drives Market Estimates and Forecasts, By Drive (2020-2032) (USD BILLION)

9.3.2.8 Italy

9.3.2.8.1 Italy Automotive Low Voltage Drives Market Estimates and Forecasts, By Power Range (2020-2032) (USD BILLION)

9.3.2.8.2 Italy Automotive Low Voltage Drives Market Estimates and Forecasts, By Drive (2020-2032) (USD BILLION)

9.3.2.9 Spain

9.3.2.9.1 Spain Automotive Low Voltage Drives Market Estimates and Forecasts, By Power Range (2020-2032) (USD BILLION)

9.3.2.9.2 Spain Automotive Low Voltage Drives Market Estimates and Forecasts, By Drive (2020-2032) (USD BILLION)

9.3.2.10 Netherlands

9.3.2.10.1 Netherlands Automotive Low Voltage Drives Market Estimates and Forecasts, By Power Range (2020-2032) (USD BILLION)

9.3.2.10.2 Netherlands Automotive Low Voltage Drives Market Estimates and Forecasts, By Drive (2020-2032) (USD BILLION)

9.3.2.11 Switzerland

9.3.2.11.1 Switzerland Automotive Low Voltage Drives Market Estimates and Forecasts, By Power Range (2020-2032) (USD BILLION)

9.3.2.11.2 Switzerland Automotive Low Voltage Drives Market Estimates and Forecasts, By Drive (2020-2032) (USD BILLION)

9.3.2.12 Austria

9.3.2.12.1 Austria Automotive Low Voltage Drives Market Estimates and Forecasts, By Power Range (2020-2032) (USD BILLION)

9.3.2.12.2 Austria Automotive Low Voltage Drives Market Estimates and Forecasts, By Drive (2020-2032) (USD BILLION)

9.3.2.13 Rest of Western Europe

9.3.2.13.1 Rest of Western Europe Automotive Low Voltage Drives Market Estimates and Forecasts, By Power Range (2020-2032) (USD BILLION)

9.3.2.13.2 Rest of Western Europe Automotive Low Voltage Drives Market Estimates and Forecasts, By Drive (2020-2032) (USD BILLION)

9.4 Asia Pacific

9.4.1 Trends Analysis

9.4.2 Asia Pacific Automotive Low Voltage Drives Market Estimates and Forecasts, by Country (2020-2032) (USD BILLION)

9.4.3 Asia Pacific Automotive Low Voltage Drives Market Estimates and Forecasts, By Power Range (2020-2032) (USD BILLION) 

9.4.4 Asia Pacific Automotive Low Voltage Drives Market Estimates and Forecasts, By Drive (2020-2032) (USD BILLION)

9.4.5 China

9.4.5.1 China Automotive Low Voltage Drives Market Estimates and Forecasts, By Power Range (2020-2032) (USD BILLION)

9.4.5.2 China Automotive Low Voltage Drives Market Estimates and Forecasts, By Drive (2020-2032) (USD BILLION)

9.4.6 India

9.4.5.1 India Automotive Low Voltage Drives Market Estimates and Forecasts, By Power Range (2020-2032) (USD BILLION)

9.4.5.2 India Automotive Low Voltage Drives Market Estimates and Forecasts, By Drive (2020-2032) (USD BILLION)

9.4.5 Japan

9.4.5.1 Japan Automotive Low Voltage Drives Market Estimates and Forecasts, By Power Range (2020-2032) (USD BILLION)

9.4.5.2 Japan Automotive Low Voltage Drives Market Estimates and Forecasts, By Drive (2020-2032) (USD BILLION)

9.4.6 South Korea

9.4.6.1 South Korea Automotive Low Voltage Drives Market Estimates and Forecasts, By Power Range (2020-2032) (USD BILLION)

9.4.6.2 South Korea Automotive Low Voltage Drives Market Estimates and Forecasts, By Drive (2020-2032) (USD BILLION)

9.4.7 Vietnam

9.4.7.1 Vietnam Automotive Low Voltage Drives Market Estimates and Forecasts, By Power Range (2020-2032) (USD BILLION)

9.2.7.2 Vietnam Automotive Low Voltage Drives Market Estimates and Forecasts, By Drive (2020-2032) (USD BILLION)

9.4.8 Singapore

9.4.8.1 Singapore Automotive Low Voltage Drives Market Estimates and Forecasts, By Power Range (2020-2032) (USD BILLION)

9.4.8.2 Singapore Automotive Low Voltage Drives Market Estimates and Forecasts, By Drive (2020-2032) (USD BILLION)

9.4.9 Australia

9.4.9.1 Australia Automotive Low Voltage Drives Market Estimates and Forecasts, By Power Range (2020-2032) (USD BILLION)

9.4.9.2 Australia Automotive Low Voltage Drives Market Estimates and Forecasts, By Drive (2020-2032) (USD BILLION)

9.4.10 Rest of Asia Pacific

9.4.10.1 Rest of Asia Pacific Automotive Low Voltage Drives Market Estimates and Forecasts, By Power Range (2020-2032) (USD BILLION)

9.4.10.2 Rest of Asia Pacific Automotive Low Voltage Drives Market Estimates and Forecasts, By Drive (2020-2032) (USD BILLION)

9.5 Middle East and Africa

9.5.1 Middle East

9.5.1.1 Trends Analysis

9.5.1.2 Middle East Automotive Low Voltage Drives Market Estimates and Forecasts, by Country (2020-2032) (USD BILLION)

9.5.1.3 Middle East Automotive Low Voltage Drives Market Estimates and Forecasts, By Power Range (2020-2032) (USD BILLION) 

9.5.1.4 Middle East Automotive Low Voltage Drives Market Estimates and Forecasts, By Drive (2020-2032) (USD BILLION)

9.5.1.5 UAE

9.5.1.5.1 UAE Automotive Low Voltage Drives Market Estimates and Forecasts, By Power Range (2020-2032) (USD BILLION)

9.5.1.5.2 UAE Automotive Low Voltage Drives Market Estimates and Forecasts, By Drive (2020-2032) (USD BILLION)

9.5.1.6 Egypt

9.5.1.6.1 Egypt Automotive Low Voltage Drives Market Estimates and Forecasts, By Power Range (2020-2032) (USD BILLION)

9.5.1.6.2 Egypt Automotive Low Voltage Drives Market Estimates and Forecasts, By Drive (2020-2032) (USD BILLION)

9.5.1.7 Saudi Arabia

9.5.1.7.1 Saudi Arabia Automotive Low Voltage Drives Market Estimates and Forecasts, By Power Range (2020-2032) (USD BILLION)

9.5.1.7.2 Saudi Arabia Automotive Low Voltage Drives Market Estimates and Forecasts, By Drive (2020-2032) (USD BILLION)

9.5.1.8 Qatar

9.5.1.8.1 Qatar Automotive Low Voltage Drives Market Estimates and Forecasts, By Power Range (2020-2032) (USD BILLION)

9.5.1.8.2 Qatar Automotive Low Voltage Drives Market Estimates and Forecasts, By Drive (2020-2032) (USD BILLION)

9.5.1.9 Rest of Middle East

9.5.1.9.1 Rest of Middle East Automotive Low Voltage Drives Market Estimates and Forecasts, By Power Range (2020-2032) (USD BILLION)

9.5.1.9.2 Rest of Middle East Automotive Low Voltage Drives Market Estimates and Forecasts, By Drive (2020-2032) (USD BILLION)

9.5.2 Africa

9.5.2.1 Trends Analysis

9.5.2.2 Africa Automotive Low Voltage Drives Market Estimates and Forecasts, by Country (2020-2032) (USD BILLION)

9.5.2.3 Africa Automotive Low Voltage Drives Market Estimates and Forecasts, By Power Range (2020-2032) (USD BILLION) 

9.5.2.4 Africa Automotive Low Voltage Drives Market Estimates and Forecasts, By Drive (2020-2032) (USD BILLION)

9.5.2.5 South Africa

9.5.2.5.1 South Africa Automotive Low Voltage Drives Market Estimates and Forecasts, By Power Range (2020-2032) (USD BILLION)

9.5.2.5.2 South Africa Automotive Low Voltage Drives Market Estimates and Forecasts, By Drive (2020-2032) (USD BILLION)

9.5.2.6 Nigeria

9.5.2.6.1 Nigeria Automotive Low Voltage Drives Market Estimates and Forecasts, By Power Range (2020-2032) (USD BILLION)

9.5.2.6.2 Nigeria Automotive Low Voltage Drives Market Estimates and Forecasts, By Drive (2020-2032) (USD BILLION)

9.5.2.7 Rest of Africa

9.5.2.7.1 Rest of Africa Automotive Low Voltage Drives Market Estimates and Forecasts, By Power Range (2020-2032) (USD BILLION)

9.5.2.7.2 Rest of Africa Automotive Low Voltage Drives Market Estimates and Forecasts, By Drive (2020-2032) (USD BILLION)

9.6 Latin America

9.6.1 Trends Analysis

9.6.2 Latin America Automotive Low Voltage Drives Market Estimates and Forecasts, by Country (2020-2032) (USD BILLION)

9.6.3 Latin America Automotive Low Voltage Drives Market Estimates and Forecasts, By Power Range (2020-2032) (USD BILLION) 

9.6.4 Latin America Automotive Low Voltage Drives Market Estimates and Forecasts, By Drive (2020-2032) (USD BILLION)

9.6.5 Brazil

9.6.5.1 Brazil Automotive Low Voltage Drives Market Estimates and Forecasts, By Power Range (2020-2032) (USD BILLION)

9.6.5.2 Brazil Automotive Low Voltage Drives Market Estimates and Forecasts, By Drive (2020-2032) (USD BILLION)

9.6.6 Argentina

9.6.6.1 Argentina Automotive Low Voltage Drives Market Estimates and Forecasts, By Power Range (2020-2032) (USD BILLION)

9.6.6.2 Argentina Automotive Low Voltage Drives Market Estimates and Forecasts, By Drive (2020-2032) (USD BILLION)

9.6.7 Colombia

9.6.7.1 Colombia Automotive Low Voltage Drives Market Estimates and Forecasts, By Power Range (2020-2032) (USD BILLION)

9.6.7.2 Colombia Automotive Low Voltage Drives Market Estimates and Forecasts, By Drive (2020-2032) (USD BILLION)

9.6.8 Rest of Latin America

9.6.8.1 Rest of Latin America Automotive Low Voltage Drives Market Estimates and Forecasts, By Power Range (2020-2032) (USD BILLION)

9.6.8.2 Rest of Latin America Automotive Low Voltage Drives Market Estimates and Forecasts, By Drive (2020-2032) (USD BILLION)

10. Company Profiles

10.1 Siemens AG

10.1.1 Company Overview

10.1.2 Financial

10.1.3 Products/ Services Offered

110.1.4 SWOT Analysis

10.2 ABB Ltd

10.2.1 Company Overview

10.2.2 Financial

10.2.3 Products/ Services Offered

10.2.4 SWOT Analysis

10.3 Schneider Electric

10.3.1 Company Overview

10.3.2 Financial

10.3.3 Products/ Services Offered

10.3.4 SWOT Analysis

10.4 Rockwell Automation

10.4.1 Company Overview

10.4.2 Financial

10.4.3 Products/ Services Offered

10.4.4 SWOT Analysis

10.5 Mitsubishi Electric Corporation

10.5.1 Company Overview

10.5.2 Financial

10.5.3 Products/ Services Offered

10.5.4 SWOT Analysis

10.6 Yaskawa Electric Corporation

10.6.1 Company Overview

10.6.2 Financial

10.6.3 Products/ Services Offered

10.6.4 SWOT Analysis

10.7 Danfoss Group

10.7.1 Company Overview

10.7.2 Financial

10.7.3 Products/ Services Offered

10.7.4 SWOT Analysis

10.8 WEG Industries

10.8.1 Company Overview

10.8.2 Financial

10.8.3 Products/ Services Offered

10.8.4 SWOT Analysis

10.9 Hitachi Ltd

10.9.1 Company Overview

10.9.2 Financial

10.9.3 Products/ Services Offered

10.9.4 SWOT Analysis

10.10 Fuji Electric Co., Ltd

             10.9.1 Company Overview

10.9.2 Financial

10.9.3 Products/ Services Offered

10.9.4 SWOT Analysis

11. Use Cases and Best Practices

12. Conclusion

An accurate research report requires proper strategizing as well as implementation. There are multiple factors involved in the completion of good and accurate research report and selecting the best methodology to compete the research is the toughest part. Since the research reports we provide play a crucial role in any company’s decision-making process, therefore we at SNS Insider always believe that we should choose the best method which gives us results closer to reality. This allows us to reach at a stage wherein we can provide our clients best and accurate investment to output ratio.

Each report that we prepare takes a timeframe of 350-400 business hours for production. Starting from the selection of titles through a couple of in-depth brain storming session to the final QC process before uploading our titles on our website we dedicate around 350 working hours. The titles are selected based on their current market cap and the foreseen CAGR and growth.


The 5 steps process:

Step 1: Secondary Research:

Secondary Research or Desk Research is as the name suggests is a research process wherein, we collect data through the readily available information. In this process we use various paid and unpaid databases which our team has access to and gather data through the same. This includes examining of listed companies’ annual reports, Journals, SEC filling etc. Apart from this our team has access to various associations across the globe across different industries. Lastly, we have exchange relationships with various university as well as individual libraries.

Secondary Research

Step 2: Primary Research

When we talk about primary research, it is a type of study in which the researchers collect relevant data samples directly, rather than relying on previously collected data.  This type of research is focused on gaining content specific facts that can be sued to solve specific problems. Since the collected data is fresh and first hand therefore it makes the study more accurate and genuine.

We at SNS Insider have divided Primary Research into 2 parts.

Part 1 wherein we interview the KOLs of major players as well as the upcoming ones across various geographic regions. This allows us to have their view over the market scenario and acts as an important tool to come closer to the accurate market numbers. As many as 45 paid and unpaid primary interviews are taken from both the demand and supply side of the industry to make sure we land at an accurate judgement and analysis of the market.

This step involves the triangulation of data wherein our team analyses the interview transcripts, online survey responses and observation of on filed participants. The below mentioned chart should give a better understanding of the part 1 of the primary interview.

Primary Research

Part 2: In this part of primary research the data collected via secondary research and the part 1 of the primary research is validated with the interviews from individual consultants and subject matter experts.

Consultants are those set of people who have at least 12 years of experience and expertise within the industry whereas Subject Matter Experts are those with at least 15 years of experience behind their back within the same space. The data with the help of two main processes i.e., FGDs (Focused Group Discussions) and IDs (Individual Discussions). This gives us a 3rd party nonbiased primary view of the market scenario making it a more dependable one while collation of the data pointers.

Step 3: Data Bank Validation

Once all the information is collected via primary and secondary sources, we run that information for data validation. At our intelligence centre our research heads track a lot of information related to the market which includes the quarterly reports, the daily stock prices, and other relevant information. Our data bank server gets updated every fortnight and that is how the information which we collected using our primary and secondary information is revalidated in real time.

Data Bank Validation

Step 4: QA/QC Process

After all the data collection and validation our team does a final level of quality check and quality assurance to get rid of any unwanted or undesired mistakes. This might include but not limited to getting rid of the any typos, duplication of numbers or missing of any important information. The people involved in this process include technical content writers, research heads and graphics people. Once this process is completed the title gets uploader on our platform for our clients to read it.

Step 5: Final QC/QA Process:

This is the last process and comes when the client has ordered the study. In this process a final QA/QC is done before the study is emailed to the client. Since we believe in giving our clients a good experience of our research studies, therefore, to make sure that we do not lack at our end in any way humanly possible we do a final round of quality check and then dispatch the study to the client.

Key Segments:

By Power Range

  • Micro

  • Low

By Drive

  • AC

  • DC

  • Servo

Request for Segment Customization as per your Business Requirement: Segment Customization Request

Regional Coverage:

North America

  • US

  • Canada

  • Mexico

Europe

  • Eastern Europe

    • Poland

    • Romania

    • Hungary

    • Turkey

    • Rest of Eastern Europe

  • Western Europe

    • Germany

    • France

    • UK

    • Italy

    • Spain

    • Netherlands

    • Switzerland

    • Austria

    • Rest of Western Europe

Asia Pacific

  • China

  • India

  • Japan

  • South Korea

  • Vietnam

  • Singapore

  • Australia

  • Rest of Asia Pacific

Middle East & Africa

  • Middle East

    • UAE

    • Egypt

    • Saudi Arabia

    • Qatar

    • Rest of Middle East

  • Africa

    • Nigeria

    • South Africa

    • Rest of Africa

Latin America

  • Brazil

  • Argentina

  • Colombia

  • Rest of Latin America

Request for Country Level Research Report: Country Level Customization Request

Available Customization

With the given market data, SNS Insider offers customization as per the company’s specific needs. The following customization options are available for the report:

  • Detailed Volume Analysis

  • Criss-Cross segment analysis (e.g. Product X Application)

  • Competitive Product Benchmarking

  • Geographic Analysis

  • Additional countries in any of the regions

  • Customized Data Representation

  • Detailed analysis and profiling of additional market players


  •            5000 (33% Discount)


  •            8950 (40% Discount)


  •            3050 (23% Discount)

Start a Conversation

Hi! Click one of our member below to chat on Phone