Automotive Composites Market Report Scope & Overview:
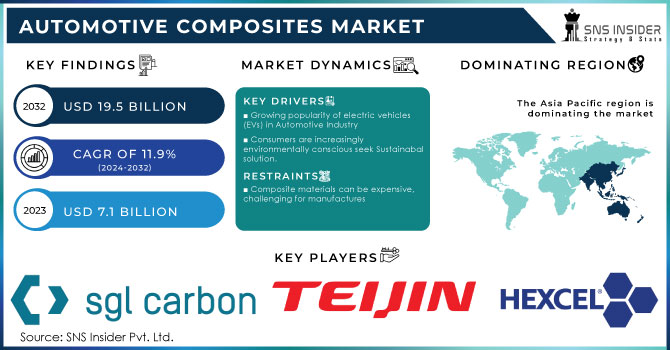
The Automotive Composites Market Size was valued at USD 7.1 billion in 2023 and is expected to reach USD 19.5 billion by 2032 and grow at a CAGR of 11.9% over the forecast period 2024-2032.
Get More Information on Automotive Composites Market - Request Sample Repor
The automotive composites market is experiencing significant growth, mainly due to increasing demand for lightweight materials that enhance fuel efficiency and reduce emissions, as well as the trend towards sustainability and advanced material properties. Some of the key drivers in the market are advancements in manufacturing processes, such as resin transfer molding and compression molding, which make it possible to produce complex composite structures at a lower cost. Regulatory pressure to increase the efficiency of vehicles and decrease their environmental footprint has also fueled the adoption of high-performance composites. In April 2022, SGL Carbon demonstrated its innovative carbon fiber and fiber composite solutions in automotive series production and industrial applications. Moreover, companies are investing in new raw materials, such as polymer hybrid composites strengthened by coconut husk and bagasse fibers that were developed this April 2023, contributing to reducing carbon footprints in the automotive industry.
Automotive Composites Market Dynamics:
Drivers:
-
Increasing Demand for Lightweight Materials in Vehicles Drives the Automotive Composites Market Growth
Lightweight materials, such as carbon fiber-reinforced polymers (CFRPs) and glass fiber composites, are widely adopted to improve fuel efficiency and reduce emissions. Replacing traditional materials like steel and aluminum, these composites help automakers meet stringent environmental regulations. This is particularly the case in the production of electric vehicles, where lightweight materials are critical to offset the weight of battery systems and extend vehicle range. Advanced composites also improve the vehicle's performance and safety by allowing manufacturers to add innovative designs without compromising structural integrity. Lightweight composites also gain importance in high-performance and luxury vehicles, driven by the aesthetic and functional advantages that they can offer. With developments in resin transfer molding and automated fiber placement manufacturing technologies, production has become less costly, and much easier to make the composites a common thing in the automobile world. With sustainability on the priority agenda, bio-based composites are also on the gaining bandwagon. It adds a new dimension to lightweight, also in the auto sector.
-
Rising Adoption of Electric Vehicles (EVs) Accelerates the Use of High-Performance Composites in Automotive Applications
-
Increasing Focus on Sustainability Promotes the Development of Recyclable and Bio-Based Composites in the Automotive Sector
Restraint:
-
High Costs of Advanced Composites and Manufacturing Processes Hamper the Widespread Adoption in the Automotive Sector
The high costs associated with advanced composites and their manufacturing processes pose a significant challenge to the widespread adoption of these materials in the automotive sector. These composites, such as carbon fiber-reinforced polymers, offer superior strength-to-weight ratios and durability but are expensive to produce due to complex production techniques and raw material costs. Additionally, the specialized equipment and skilled labor required further increase expenses, making it difficult for manufacturers to incorporate these materials in mass-produced vehicles. As a result, their use is often limited to high-end or performance-oriented vehicles, slowing the penetration of advanced composites in mainstream automotive applications.
Opportunity:
-
Advancements in Manufacturing Technologies Enable Cost-Effective Production of Automotive Composites at Scale
-
Growing Electric Vehicle Market Opens New Avenues for Specialized Composite Applications
The growing EV market is opening up many opportunities for specialized composite applications, driven by the unique requirements of electric drivetrains and battery systems. Composites are being developed for battery enclosures, cooling systems, and underbody protection, where thermal management and weight reduction are critical. These materials not only enhance energy efficiency but also contribute to vehicle safety by providing excellent impact resistance. Incentivized by global governments in terms of subsidy packages and investments into infrastructure, automobile manufacturers are aggressively adopting advanced composites tailored to EVs. Lightweight composites are especially advantageous in extending the range of the vehicle, an important selling point for EV manufacturers. The interactions between material developers and automobile manufacturers create innovation that translates into composites designed specifically for the growing demand in the EV sector.
Supply Chain Disruptions in the Automotive Composites Market
The global automotive composites market faces various supply chain challenges that significantly impact material availability, cost, and production timelines. These disruptions arise from geopolitical tensions, raw material shortages, and logistical inefficiencies, among other factors. The table below highlights five key supply chain disruptions and their associated risks, which are critical for understanding market dynamics and planning mitigation strategies.
|
Disruption |
Description |
Impact on Market |
Mitigation Strategies |
|
Geopolitical Tensions |
Trade restrictions and tariffs due to conflicts between regions such as U.S.-China or EU-Asia. |
Increased material costs, delayed shipments, and uncertainty in sourcing. |
Diversifying sourcing regions, strengthening regional supply chains. |
|
Raw Material Shortages |
Limited availability of carbon fibers and resin due to production bottlenecks or increased demand. |
Supply constraints leading to production delays and higher prices. |
Investment in raw material production capacity, partnerships with material suppliers. |
|
Logistical Challenges |
Port congestion and freight delays, especially during peak demand periods. |
Disrupted delivery schedules, affecting just-in-time production systems in the automotive sector. |
Optimizing logistics through advanced tracking systems, alternative transportation modes. |
|
Energy Crises |
Rising energy costs and disruptions in power supply affecting manufacturing plants. |
Increased production costs, leading to higher prices for composite materials. |
Investing in renewable energy sources, implementing energy-efficient manufacturing. |
|
Recycling and Waste Management |
Lack of infrastructure for recycling thermoset composites, creating bottlenecks in sustainable practices. |
Regulatory penalties and reduced adoption due to unsustainable practices. |
Development of advanced recycling technologies, adoption of thermoplastic composites. |
The supply chain for automotive composites is heavily influenced by external factors such as geopolitical conflicts and resource constraints. Key risks include price volatility, delays, and environmental concerns, which hinder the market's ability to meet rising demand efficiently. By addressing these risks through diversified sourcing, advanced logistics, and investment in recycling technologies, stakeholders can strengthen the resilience of the supply chain.
Automotive Composites Market Segments
By Type
In 2023, Polymer Matrix Composites (PMC) dominated the automotive composites market, holding a significant share of 50%. PMCs are highly preferred in industries such as aerospace, automotive, and wind energy because of their high strength-to-weight ratio, design flexibility, and cost-effectiveness, comprising a polymer resin matrix reinforced with fibers. PMC materials, especially carbon-fiber-reinforced polymers (CFRPs), are widely applied in aerospace. For instance, aircraft structures and components, including fuselages, wings, and interior parts, are commonly made of such materials. Their application is driven by the fact that aircraft must be light for fuel efficiency and lower emissions. PMCs are increasingly being used in the automotive industry in electric vehicles (EVs) to reduce weight and enhance battery performance, thus improving the overall efficiency of the vehicle. In wind turbine manufacturers, PMC composites are also incorporated into turbine blades to optimize performance and durability. The versatility of PMCs across diverse applications, along with their relatively lower cost compared to other composite types like metal or ceramic matrix composites, has solidified their dominant position in the market.
By Fiber Type
Carbon fiber dominated the fiber type segment of the automotive composites market in 2023, with a market share of 35%. Its tensile strength, stiffness, and light weight have made carbon fiber a popular choice in the aerospace, automotive, and sports equipment industries. Carbon fiber composites are used significantly in aerospace industries for aircraft wings, fuselage, and interior components. In the aerospace field, the key advantage of carbon fibers is their low weight, leading to increased fuel efficiency and emission reduction. The automobile industry has demanded carbon fiber primarily to reduce the weight of both traditional vehicles and electric vehicles (EVs), thereby achieving better fuel efficiency and a more extended battery life. For example, luxury and performance car manufacturers such as Lamborghini and Audi are using carbon fiber to make body panels, roofs, and other parts. Additionally, the trend toward sustainability and the use of lightweight materials for energy-efficient vehicles is driving the adoption of carbon fiber in electric vehicles. The demand for high-performance materials in automotive, aerospace, and renewable energy applications continues to be a significant driver for carbon fiber in the fiber type market.
By Resin Type
Thermoset resins dominated the resin type segment in the automotive composites market in 2023, with a market share of 55%. These resins undergo a curing process that results in a permanent, hardened structure, which provides excellent durability, thermal stability, and resistance to environmental factors. Thermoset-based composites are widely used in high-performance applications, particularly in the aerospace and automotive sectors where materials have to be fabricated withstanding extreme conditions such as extreme temperatures along with extreme stressing. In aerospace, thermoset composites are utilized for the production of critical components like wings, fuselages, and engine parts, as they possess excellent resistance to corrosion and high-temperature environments. In automotive, these thermoset composites are used in lightweight body panels, interior parts, and structural components to deliver vehicle performance and improve energy efficiency, as well as enhance vehicle safety. It has been applied massively in various fields, like aerospace, automobile, and wind power, to advance its strength and value against the background of cost, and mechanical property, thus securing the highest rank in the automotive composites market.
By Vehicle Type
Passenger vehicles dominated the automotive composites market in 2023, and with a revenue share of about 60%. The key factor behind these facts has been the growing demand for lightweight materials, which are believed to promote performance, reduce CO2 emissions, and enhance fuel efficiency. Passenger vehicles in the automobile industry make considerable use of automotive composites, carbon fiber, and glass fiber-reinforced polymers to manufacture structural parts, body panels, and interior components. These materials enable weight reduction for vehicles, further leading to efficient fuel consumption and decreased emissions. In electric cars, composites are used as an important measure to enhance battery performance through general weight reduction for the vehicle to increase its mileage. Many premium automobile manufacturers such as BMW and Tesla have already been using advanced composites in making electric and premium cars to serve sustainability and the need for an efficient vehicle. The shift toward electrification and sustainability, along with the ongoing efforts to reduce the weight of vehicles for better economy, has settled passenger vehicles into the dominant side of the business.
By Application
Exterior applications dominated the automotive composites market in 2023, with a market share of about 40%. Composites have become very common in exterior automotive applications because they have a low weight, durability, and high resistance to weathering and impact. In the automotive industry, composite materials are used in body panels, bumpers, grilles, and other exterior parts, where it is crucial to reduce weight in order to gain better fuel efficiency and reduce emissions. With the growing use of electric vehicles, the demand for composites in exterior applications has increased even more, as lighter components enhance better battery performance and longer driving ranges. For instance, car manufacturers such as Audi and Tesla have been using composites for the exterior components of their vehicles to enhance aerodynamics and reduce weight. In the context of automotive, composites have been increasingly applied in the construction of wind turbine blades, where the material's lightness and resistance to extreme environmental requirements become overwhelmingly pertinent. Increasing demand for energy-efficient solutions in both automotive and renewable energy sectors has driven the extensive adoption of composites in exterior applications.
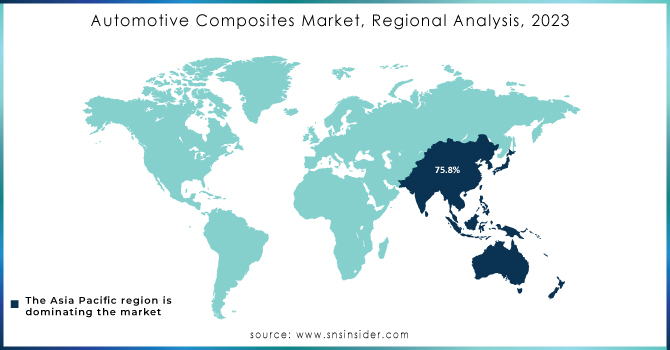
Automotive Composites Market Regional Analysis
Asia Pacific dominated the automotive composites market in 2023 with 45% of the market share. The region mainly dominates due to rapid industrialization, increased usage of advanced materials in aerospace, automotive, and construction industries, and the high demand for energy-efficient solutions. Countries like China, Japan, and India have been leading in this regard. China is the biggest contributor through significant investments in the aerospace and automotive sectors, where lightweight composite materials are used for vehicle components and aircraft structures. Another field where China leads the world installation capacity of wind turbines, thus considerably inducing more demand from advanced composites for the manufacturing of turbine blades. The Japan Automotive Composites Market is thriving, driven by the country's expertise in carbon fiber composites for automotive and aerospace. This growth is fueled by a focus on lightweighting and the transition to electric and hybrid vehicles.
Companies like Toyota and Mitsubishi have adopted composites in electric vehicle (EV) manufacturing to reduce weight and improve performance. India is also emerging as a key player, with increasing adoption of composites in the automotive sector and a focus on sustainability in manufacturing practices. The growing demand for electric vehicles in the Asia Pacific has accelerated the growth of automotive composites, as these materials are required to enhance EV efficiency and prolong battery life. The expanding manufacturing base and government initiatives to encourage the use of advanced materials are likely to make the Asia Pacific continue to lead the market.
On the other hand, North America emerged as the fastest-growing region in the automotive composites market in 2023 with a CAGR of 8.5%. Growth in the region is primarily driven by the growing demand for lightweight materials in the aerospace, automotive, and wind energy sectors. In North America, the United States is the biggest consumer of advanced composites, where significant usage has been seen in the aerospace and defense industries. Composites are also gaining momentum in electric vehicles in the region. Major automakers like Ford, General Motors, and Tesla are integrating carbon fiber and other advanced composites into vehicle designs to improve fuel efficiency and reduce emissions. North America's robust research and development activities in advanced composite technologies are also contributing to the market's rapid growth. The country also gained ground in the composite material and is doing good, especially in wind energy, wherein it is increasingly applied in making blades for the turbine. Due to the increasing demands in the sustainability of the area along with a lot of rules issued by the government for cleaning and efficient transportation solutions, there would be much advancement in this type of material composite. As North America continues to emphasize technological innovation and the shift toward electric vehicles, the region will continue to see strong growth in the coming years.
Get Customized Report as per your Business Requirement - Request For Customized Report
Key Players
-
3A Composites (Airex Foam, Banova)
-
Arkema S.A. (Elium Resin, Kepstan PEKK)
-
BASF SE (Ultramid, Ultradur)
-
Celanese Corporation (Celstran, Fortron PPS)
-
Cytec Industries Inc. (now part of Solvay) (Cycom, MTM prepregs)
-
Gurit (Epoxy Prepregs, Corecell Foam)
-
Hexcel Corporation (HexPly Prepregs, HexMC)
-
Hexion (Epikote Resins, Epikure Hardeners)
-
Huntsman Corporation (Araldite Epoxy, VITROX)
-
Johns Manville (Evalith Mats, ThermoFlow)
-
Mitsubishi Chemical Holding Corporation (PYROFIL Carbon Fiber, DURABIO Resin)
-
Owens Corning (Fiberglas Rovings, Advantex Fiber)
-
RTP Company (Conductive Compounds, Long Fiber Thermoplastics)
-
SGL Carbon (SIGRAFIL Carbon Fiber, SIGRAPREG Prepregs)
-
Solvay SA (Ryton PPS, Ixef PARA)
-
Teijin Limited (Tenax Carbon Fiber, Sereebo Thermoplastic Composites)
-
Toray Industries Inc. (Torayca Carbon Fiber, Cetex Thermoplastics)
-
UFP Technologies Ltd (Molded Fiber Solutions, Foam Composites)
-
Victrex plc (Victrex PEEK, Aptiv Film)
-
Zoltek Corporation (a Toray Group company) (PX35 Carbon Fiber, PX30 Carbon Fiber)
Recent Developments
-
November 2024: Recyclable thermoplastics were utilized in an Elium resin-based automotive door project, creating lightweight and durable components.
-
September 2024: Borealis introduced a new fiberglass-reinforced polypropylene material containing 65% post-consumer recyclates, focusing on sustainable automotive project work.
-
May 2024: Teijin Automotive Technologies invested $100 million in a new factory in Indiana to expand its manufacturing capacity.
-
February 2024: NREL introduced a thermoforming technique to make carbon fiber composites more recyclable, enhancing sustainability while maintaining strength and durability.
-
February 2024: Researchers at the National Renewable Energy Laboratory (NREL) achieved breakthroughs in recyclable carbon fiber composites using thermoforming, enhancing sustainability in the process.
-
December 2023: Solvay's company announced its separation into industry leaders: SOLVAY and SYENSQO. The new names will take effect upon the completion of the separation.
| Report Attributes | Details |
|---|---|
| Market Size in 2023 | US$ 7.1 Billion |
| Market Size by 2032 | US$ 19.5 Billion |
| CAGR | CAGR of 11.9% From 2024 to 2032 |
| Base Year | 2023 |
| Forecast Period | 2024-2032 |
| Historical Data | 2020-2022 |
| Report Scope & Coverage | Market Size, Segments Analysis, Competitive Landscape, Regional Analysis, DROC & SWOT Analysis, Forecast Outlook |
| Key Segments | • By Type (Polymer Matrix Composites (PMC), Metal Matrix Composites (MMC), Ceramic Matrix Composites (CMC)) • By Fiber Type (Glass, Carbon, Aramid, Others) • By Resin Type (Thermoset, Thermoplastic) • By Vehicle Type (Passenger Vehicles, Commercial Vehicles, Electric Vehicles) • By Application (Exterior, Interior, Powertrain, Chassis, Others) |
| Regional Analysis/Coverage | North America (US, Canada, Mexico), Europe (Eastern Europe [Poland, Romania, Hungary, Turkey, Rest of Eastern Europe] Western Europe] Germany, France, UK, Italy, Spain, Netherlands, Switzerland, Austria, Rest of Western Europe]), Asia Pacific (China, India, Japan, South Korea, Vietnam, Singapore, Australia, Rest of Asia Pacific), Middle East & Africa (Middle East [UAE, Egypt, Saudi Arabia, Qatar, Rest of Middle East], Africa [Nigeria, South Africa, Rest of Africa], Latin America (Brazil, Argentina, Colombia, Rest of Latin America) |
| Company Profiles | SGL Carbon, Teijin Limited, UFP Technologies Ltd, Hexcel Corporation, Hexion, Toray Industries Inc., Solvay SA, Gurit and Huntsman Corporation, Mitsubishi Chemical Holding Corporation and other key players |
| Key Drivers | • Rising Adoption of Electric Vehicles (EVs) Accelerates the Use of High-Performance Composites in Automotive Applications • Increasing Focus on Sustainability Promotes the Development of Recyclable and Bio-Based Composites in the Automotive Sector |
| Restraints | • High Costs of Advanced Composites and Manufacturing Processes Hamper the Widespread Adoption in the Automotive Sector |
