Get More Information on Automotive Collision Repair Market - Request Sample Report
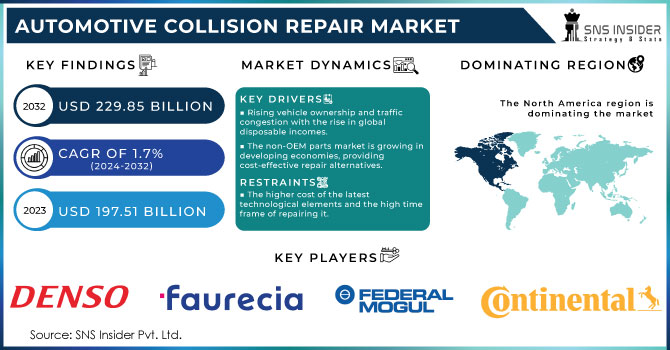
The Automotive Collision Repair Market size is expected to reach USD 229.85 Bn by 2032 and is valued at USD 197.51 Bn in 2023, the CAGR is anticipated to be over 1.7% over the forecast period of 2024-2032.
A relationship between an increase in car ownership and need for collision repairs is highly correlated and is enhancing the overall demand landscape. The number of registered vehicles in the US increased by 1.4% to more than 332 million in 2022 from 2021. This corresponds with Federal Highway Administration (FHWA) data which show US vehicle miles travelled hit a record high mark of 3.3 trillion miles in 2022, up by 3.2% YoY. More cars on the road for longer distances is estimated to create higher probability of more accidents. The National Highway Traffic Safety Administration (NHTSA) recorded over 6.7 million police-reported traffic crashes in 2022 alone, these numbers dictate how costly or economically difficult it is fixing many minor accidents that might necessitate auto body repairs. As the market price is increasing every year due to high volatility of inflationary pressures designed into them at their creation stage.
Safety, transparency and environmental implication of the automotive collision repair market are among some of the areas that governments have been aspiring to address through various activities. For instance, in the United States, body shops are required by the EPA to incorporate a rule which requires that 50% of paint overspray be captured. This greatly reduces cost of repairing (HAP). It also positively mandates that body shops should be transparent of whether they use new or recycled parts, information that would help the consumers to make informed decisions. Similarly, Europe has strict regulations for waste management within its automotive repair industry. The European Commission indicates that proper treatment of end-of-life vehicles increased up to 95% in 2021 which is evidence for the effectiveness of these laws.
Market Dynamics:
Drivers:
Rising vehicle ownership and traffic congestion with the rise in global disposable incomes.
The automotive industry has been embracing developments in areas such as 3D printing parts and advanced tools for repair, which have potential to improve efficiency and therefore lower costs for collision repair shops.
The market for non-original equipment manufacturer (OEM) parts is growing particularly in developing economies that offer a cheaper alternative when it comes to repairs.
Developing economies are driving the demand for non-original equipment manufacturer (OEM) parts. These parts are considered as aftermarket parts and represent a low-cost solution in repairing collision damage. Studies show a massive change with more buyers of aftermarket parts from the automotive industry. For instance, according to India’s Society of Indian Automobile Manufacturers (SIAM) report in 2023, minor car crashes involve the use of non-OEM parts at 65%. A similar trend exists in Brazil among other developing countries where a study conducted by National Confederation of Industry (CNI) indicated that aftermarket parts controlled by automotive collision repair market targeting specific vehicle segments are valued at 70% share. In this sense, the rising popularity of non-OEM parts in emerging markets can be associated with the huge cost difference between these and the original equipment manufacturers’ (OEM) products that goes as high as 30%-50% less. Affordability remains a key determinant driving the demand for non-OEM auto parts due to budgetary constraints in some places despite issues about its quality and warranty conditions. Non-OEM penetration rates are increasing globally, but particularly in developing countries like Nigeria where spare part dealers are becoming more organized and digitalized.
Restrain:
Nowadays, cars have become complex, which entails repairing them at great expense due to their advanced technologies, materials and safety systems.
The higher cost of the latest technological elements and the high time frame of repairing it.
Considering Advanced Driver-Assistance Systems (ADAS) are an asset to automotive collision repair market since they prevent accidents. However, they complicate repair procedures through their intricate nature thereby potentially escalating expenses. Therefore, damaged radar systems cannot be easily swapped out instead, they must undergo detailed recalibration so that they function properly with other ADAS items such as cameras and LiDAR sensors. This recalibration process necessitates specialized equipment, and trained technicians, resulting in increased repair times and higher labor costs. A recent study conducted by the National Institute of Standards and Technology (NIST) states that approximately 20% of ADAS recalibration service providers lack appropriate training hence slowing down the repair process. Additionally, manufacturers have different calibration procedures, therefore repair shops are forced to purchase a wider range of automotive software and tools.
Need any customization research on Automotive Collision Repair Market - Enquiry Now
By Product
Paints & Coatings
Consumables
Spare Parts
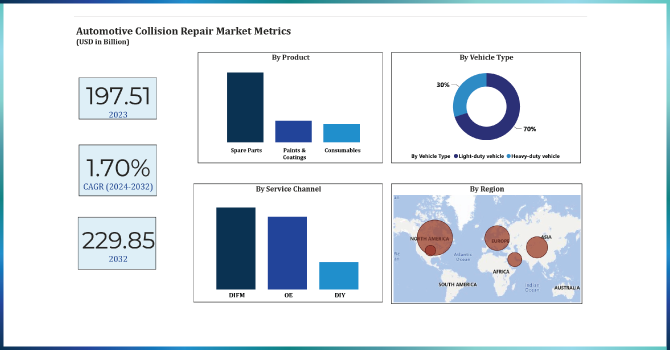
Spare parts including bumpers, fenders, hoods and other structural components dominated with a share of above 63% in 2023. This supremacy is directly related to high number of road accidents whereby these parts bear most impacts. Paints and coatings follow at around 20%, showing how aesthetic appeal helps in achieving a perfect repair job. Consumables such as sandpaper, masking tape or solvents held around 17% share. Although each may seem small in its own right consumables play an important role as they provide invisible support to any repairs ensuring smooth operations while ensuring smooth operations and high-quality results.
By Vehicle Type
Light-duty vehicle
Heavy-duty vehicle
In 2023 light-duty vehicles held around 70% share and dominated the vehicle type segment, this segment includes passenger cars, SUVs and crossovers. The advantage of the economy of scale in this segment is that they can be easily replaced and maintained by a large work force with enough experience in handling standard vehicles. The heavy-duty vehicles that include pickup trucks and buses constitute the remaining smaller portion about 30% but still have relatively high average repair cost.
For these, however, their intricate structures as well as tailor-made parts mostly necessitate involvement of authorized dealerships or certified repair shops. It is worth mentioning here that both segments are currently witnessing increased demand for electric and hybrid vehicles thus, posing its own unique challenges. There is need for specialized training for technicians who undertake repairs on vehicles with high-voltage systems to ensure compliance with safety norms. This is an emerging trend anticipated to provide the automotive collision repair market further during the expected rapid uptake of electric vehicles.
By Service Channel
DIY
DIFM
OE
The automotive collision repair market has different offerings through various channels to meet individual customer preferences. Do-It-Yourself (DIY) solutions accounted for 15% share attracting people who prefer low budgets for instance dents and scratches repairs. Online tutorials, available spare parts, and cheap tools allow DIY experts to do almost anything about their cars. Nevertheless, many customers prefer professional repairs due to their complexities or security concerns which may prohibit them from doing such jobs themselves as it could be dangerous. Online tutorials, readily available parts, and affordable tools empower DIY enthusiasts.
However, complex repairs or safety concerns often push customers towards professional channels. As OE service outlets and dealerships, they accounted about 40% of the market share in 2023. They offer assurance by way of certified technicians, parts that won’t void a warranty, and maintenance of manufacturer repair guideline. Although they are usually more expensive compared to other options, these channels guarantee quality repairs and may help retain the value of a car when it is time to sell. The rest 45% share is accounted by Do-It-For-Me (DIFM) segment which is growing rapidly.
North America
US
Canada
Mexico
Europe
Eastern Europe
Poland
Romania
Hungary
Turkey
Rest of Eastern Europe
Western Europe
Germany
France
UK
Italy
Spain
Netherlands
Switzerland
Austria
Rest of Western Europe
Asia Pacific
China
India
Japan
South Korea
Vietnam
Singapore
Australia
Rest of Asia Pacific
Middle East & Africa
Middle East
UAE
Egypt
Saudi Arabia
Qatar
Rest of Middle East
Africa
Nigeria
South Africa
Rest of Africa
Latin America
Brazil
Argentina
Colombia
Rest of Latin America
North American Automotive Collision Repair Market accounted for over 42.6% of global market share in 2023 dominating the market. High density of vehicles increases the need for repairs in North America because households own up to above 80% with most being used cars thus needing more repairs on average per unit than new ones do. Secondly, high accident rates sustain demand for repair facilities in an area. In the U.S., alone there are approximately 6 million motor vehicle accidents each year involving damage done to automobiles including about one quarter that result in property damage only. Insurance penetration is the third factor. The presence of more than 85% insurance coverage on North America’s automobiles creates reasons for these consumers to look for professional collision repair services. Lastly, NA marketplace has a well-developed fixing network exists. This kind of mix in North America comprises about 20% chain and 80% independent shops, thereby increasing availability of services in different locations. This variation makes the North American Automotive Collision Repair Market strong and dynamic.
APAC region experienced the highest CAGR in 2023 and is expected to be around 2.9% over the forecast period of 2024-2032. The key factor here is rising demand for vehicles which is projected to be about 60% of total car sales by 2030 globally, while on the other it struggles with factors that increase repairs needs. Above 70% of APAC roads do not have proper safety features hence higher accident rates compared to other parts globally. In addition to this, uninterested enforcement of traffic rules largely contributes to this market among others factors as discussed above.
The major key players are 3M, Automotive Technology products, Continental AG, Denso Corporation, Faurecia, Federal-Mogul LLC, Honeywell International, Johnson Controls, Mitsuba Corp, Robert Bosch and others.
Continental AG – The company has started the production of its most sustainable tires @Ultra Contact NXT in volume.
Faurecia- The company have announced a strategic partnership with Renault group in order to increase the aftersales services in automotive industry.
Report Attributes | Details |
Market Size in 2023 | US$ 197.51 Bn |
Market Size by 2032 | US$ 229.85 Bn |
CAGR | CAGR of 1.7 % From 2024 to 2032 |
Base Year | 2023 |
Forecast Period | 2024-2032 |
Historical Data | 2020-2022 |
Report Scope & Coverage | Market Size, Segments Analysis, Competitive Landscape, Regional Analysis, DROC & SWOT Analysis, Forecast Outlook |
Key Segments | • by Product (Paints & Coatings, Consumables, Spare Parts), • by Vehicle Type (Light-duty vehicle, Heavy-duty vehicle), • by Service Channel (DIY, DIFM, OEM), |
Regional Analysis/Coverage | North America (US, Canada, Mexico), Europe (Eastern Europe [Poland, Romania, Hungary, Turkey, Rest of Eastern Europe] Western Europe] Germany, France, UK, Italy, Spain, Netherlands, Switzerland, Austria, Rest of Western Europe]), Asia Pacific (China, India, Japan, South Korea, Vietnam, Singapore, Australia, Rest of Asia Pacific), Middle East & Africa (Middle East [UAE, Egypt, Saudi Arabia, Qatar, Rest of Middle East], Africa [Nigeria, South Africa, Rest of Africa], Latin America (Brazil, Argentina, Colombia, Rest of Latin America) |
Company Profiles | 3M, Automotive Technology products, Continental AG, Denso Corporation, Faurecia, Federal-Mogul LLC, Honeywell International, Johnson Controls, Mitsuba Corp, Robert Bosch |
Key Drivers |
|
Market Restraints |
|
Ans: The Automotive Collision Repair Market is expected to grow at a CAGR of 1.7 %.
Ans: The Automotive Collision Repair Market size is expected to reach USD 229.85 Bn by 2032 and is valued at USD 197.51 Bn in 2023.
The rising initiatives taken by governments and private organizations for the environment sustainability.
Ans: The higher cost of the latest technological elements and the high time frame of repairing it.
Ans: The market for non-original equipment manufacturer (OEM) parts is growing particularly in developing economies that offer a cheaper alternative when it comes to repairs.
TABLE OF CONTENTS
1. Introduction
1.1 Market Definition
1.2 Scope
1.3 Research Assumptions
2. Industry Flowchart
3. Research Methodology
4. Market Dynamics
4.1 Drivers
4.2 Restraints
4.3 Opportunities
4.4 Challenges
5. Porter’s 5 Forces Model
6. Pest Analysis
7. Automotive Collision Repair Market Segmentation, By Product
7.1 Introduction
7.2 Paints & Coatings
7.3 Consumables
7.4 Spare Parts
8. Automotive Collision Repair Market Segmentation, By Vehicle Type
8.1 Introduction
8.2 Light-duty Vehicle
8.3 Heavy-duty Vehicle
9. Automotive Collision Repair Market Segmentation, By Service Channel
9.1 Introduction
9.2 DIY
9.3 DIFM
9.4 OE
10. Regional Analysis
10.1 Introduction
10.2 North America
10.2.1 Trend Analysis
10.2.2 North America Automotive Collision Repair Market by Country
10.2.3 North America Automotive Collision Repair Market By Product
10.2.4 North America Automotive Collision Repair Market By Vehicle Type
10.2.5 North America Automotive Collision Repair Market By Service Channel
10.2.6 USA
10.2.6.1 USA Automotive Collision Repair Market By Product
10.2.6.2 USA Automotive Collision Repair Market By Vehicle Type
10.2.6.3 USA Automotive Collision Repair Market By Service Channel
10.2.7 Canada
10.2.7.1 Canada Automotive Collision Repair Market By Product
10.2.7.2 Canada Automotive Collision Repair Market By Vehicle Type
10.2.7.3 Canada Automotive Collision Repair Market By Service Channel
10.2.8 Mexico
10.2.8.1 Mexico Automotive Collision Repair Market By Product
10.2.8.2 Mexico Automotive Collision Repair Market By Vehicle Type
10.2.8.3 Mexico Automotive Collision Repair Market By Service Channel
10.3 Europe
10.3.1 Trend Analysis
10.3.2 Eastern Europe
10.3.2.1 Eastern Europe Automotive Collision Repair Market by Country
10.3.2.2 Eastern Europe Automotive Collision Repair Market By Product
10.3.2.3 Eastern Europe Automotive Collision Repair Market By Vehicle Type
10.3.2.4 Eastern Europe Automotive Collision Repair Market By Service Channel
10.3.2.5 Poland
10.3.2.5.1 Poland Automotive Collision Repair Market By Product
10.3.2.5.2 Poland Automotive Collision Repair Market By Vehicle Type
10.3.2.5.3 Poland Automotive Collision Repair Market By Service Channel
10.3.2.6 Romania
10.3.2.6.1 Romania Automotive Collision Repair Market By Product
10.3.2.6.2 Romania Automotive Collision Repair Market By Vehicle Type
10.3.2.6.4 Romania Automotive Collision Repair Market By Service Channel
10.3.2.7 Hungary
10.3.2.7.1 Hungary Automotive Collision Repair Market By Product
10.3.2.7.2 Hungary Automotive Collision Repair Market By Vehicle Type
10.3.2.7.3 Hungary Automotive Collision Repair Market By Service Channel
10.3.2.8 Turkey
10.3.2.8.1 Turkey Automotive Collision Repair Market By Product
10.3.2.8.2 Turkey Automotive Collision Repair Market By Vehicle Type
10.3.2.8.3 Turkey Automotive Collision Repair Market By Service Channel
10.3.2.9 Rest of Eastern Europe
10.3.2.9.1 Rest of Eastern Europe Automotive Collision Repair Market By Product
10.3.2.9.2 Rest of Eastern Europe Automotive Collision Repair Market By Vehicle Type
10.3.2.9.3 Rest of Eastern Europe Automotive Collision Repair Market By Service Channel
10.3.3 Western Europe
10.3.3.1 Western Europe Automotive Collision Repair Market by Country
10.3.3.2 Western Europe Automotive Collision Repair Market By Product
10.3.3.3 Western Europe Automotive Collision Repair Market By Vehicle Type
10.3.3.4 Western Europe Automotive Collision Repair Market By Service Channel
10.3.3.5 Germany
10.3.3.5.1 Germany Automotive Collision Repair Market By Product
10.3.3.5.2 Germany Automotive Collision Repair Market By Vehicle Type
10.3.3.5.3 Germany Automotive Collision Repair Market By Service Channel
10.3.3.6 France
10.3.3.6.1 France Automotive Collision Repair Market By Product
10.3.3.6.2 France Automotive Collision Repair Market By Vehicle Type
10.3.3.6.3 France Automotive Collision Repair Market By Service Channel
10.3.3.7 UK
10.3.3.7.1 UK Automotive Collision Repair Market By Product
10.3.3.7.2 UK Automotive Collision Repair Market By Vehicle Type
10.3.3.7.3 UK Automotive Collision Repair Market By Service Channel
10.3.3.8 Italy
10.3.3.8.1 Italy Automotive Collision Repair Market By Product
10.3.3.8.2 Italy Automotive Collision Repair Market By Vehicle Type
10.3.3.8.3 Italy Automotive Collision Repair Market By Service Channel
10.3.3.9 Spain
10.3.3.9.1 Spain Automotive Collision Repair Market By Product
10.3.3.9.2 Spain Automotive Collision Repair Market By Vehicle Type
10.3.3.9.3 Spain Automotive Collision Repair Market By Service Channel
10.3.3.10 Netherlands
10.3.3.10.1 Netherlands Automotive Collision Repair Market By Product
10.3.3.10.2 Netherlands Automotive Collision Repair Market By Vehicle Type
10.3.3.10.3 Netherlands Automotive Collision Repair Market By Service Channel
10.3.3.11 Switzerland
10.3.3.11.1 Switzerland Automotive Collision Repair Market By Product
10.3.3.11.2 Switzerland Automotive Collision Repair Market By Vehicle Type
10.3.3.11.3 Switzerland Automotive Collision Repair Market By Service Channel
10.3.3.12 Austria
10.3.3.12.1 Austria Automotive Collision Repair Market By Product
10.3.3.12.2 Austria Automotive Collision Repair Market By Vehicle Type
10.3.3.12.3 Austria Automotive Collision Repair Market By Service Channel
10.3.3.13 Rest of Western Europe
10.3.3.13.1 Rest of Western Europe Automotive Collision Repair Market By Product
10.3.3.13.2 Rest of Western Europe Automotive Collision Repair Market By Vehicle Type
10.3.3.13.3 Rest of Western Europe Automotive Collision Repair Market By Service Channel
10.4 Asia-Pacific
10.4.1 Trend Analysis
10.4.2 Asia-Pacific Automotive Collision Repair Market by Country
10.4.3 Asia-Pacific Automotive Collision Repair Market By Product
10.4.4 Asia-Pacific Automotive Collision Repair Market By Vehicle Type
10.4.5 Asia-Pacific Automotive Collision Repair Market By Service Channel
10.4.6 China
10.4.6.1 China Automotive Collision Repair Market By Product
10.4.6.2 China Automotive Collision Repair Market By Vehicle Type
10.4.6.3 China Automotive Collision Repair Market By Service Channel
10.4.7 India
10.4.7.1 India Automotive Collision Repair Market By Product
10.4.7.2 India Automotive Collision Repair Market By Vehicle Type
10.4.7.3 India Automotive Collision Repair Market By Service Channel
10.4.8 Japan
10.4.8.1 Japan Automotive Collision Repair Market By Product
10.4.8.2 Japan Automotive Collision Repair Market By Vehicle Type
10.4.8.3 Japan Automotive Collision Repair Market By Service Channel
10.4.9 South Korea
10.4.9.1 South Korea Automotive Collision Repair Market By Product
10.4.9.2 South Korea Automotive Collision Repair Market By Vehicle Type
10.4.9.3 South Korea Automotive Collision Repair Market By Service Channel
10.4.10 Vietnam
10.4.10.1 Vietnam Automotive Collision Repair Market By Product
10.4.10.2 Vietnam Automotive Collision Repair Market By Vehicle Type
10.4.10.3 Vietnam Automotive Collision Repair Market By Service Channel
10.4.11 Singapore
10.4.11.1 Singapore Automotive Collision Repair Market By Product
10.4.11.2 Singapore Automotive Collision Repair Market By Vehicle Type
10.4.11.3 Singapore Automotive Collision Repair Market By Service Channel
10.4.12 Australia
10.4.12.1 Australia Automotive Collision Repair Market By Product
10.4.12.2 Australia Automotive Collision Repair Market By Vehicle Type
10.4.12.3 Australia Automotive Collision Repair Market By Service Channel
10.4.13 Rest of Asia-Pacific
10.4.13.1 Rest of Asia-Pacific Automotive Collision Repair Market By Product
10.4.13.2 Rest of Asia-Pacific Automotive Collision Repair Market By Vehicle Type
10.4.13.3 Rest of Asia-Pacific Automotive Collision Repair Market By Service Channel
10.5 Middle East & Africa
10.5.1 Trend Analysis
10.5.2 Middle East
10.5.2.1 Middle East Automotive Collision Repair Market by Country
10.5.2.2 Middle East Automotive Collision Repair Market By Product
10.5.2.3 Middle East Automotive Collision Repair Market By Vehicle Type
10.5.2.4 Middle East Automotive Collision Repair Market By Service Channel
10.5.2.5 UAE
10.5.2.5.1 UAE Automotive Collision Repair Market By Product
10.5.2.5.2 UAE Automotive Collision Repair Market By Vehicle Type
10.5.2.5.3 UAE Automotive Collision Repair Market By Service Channel
10.5.2.6 Egypt
10.5.2.6.1 Egypt Automotive Collision Repair Market By Product
10.5.2.6.2 Egypt Automotive Collision Repair Market By Vehicle Type
10.5.2.6.3 Egypt Automotive Collision Repair Market By Service Channel
10.5.2.7 Saudi Arabia
10.5.2.7.1 Saudi Arabia Automotive Collision Repair Market By Product
10.5.2.7.2 Saudi Arabia Automotive Collision Repair Market By Vehicle Type
10.5.2.7.3 Saudi Arabia Automotive Collision Repair Market By Service Channel
10.5.2.8 Qatar
10.5.2.8.1 Qatar Automotive Collision Repair Market By Product
10.5.2.8.2 Qatar Automotive Collision Repair Market By Vehicle Type
10.5.2.8.3 Qatar Automotive Collision Repair Market By Service Channel
10.5.2.9 Rest of Middle East
10.5.2.9.1 Rest of Middle East Automotive Collision Repair Market By Product
10.5.2.9.2 Rest of Middle East Automotive Collision Repair Market By Vehicle Type
10.5.2.9.3 Rest of Middle East Automotive Collision Repair Market By Service Channel
10.5.3 Africa
10.5.3.1 Africa Automotive Collision Repair Market by Country
10.5.3.2 Africa Automotive Collision Repair Market By Product
10.5.3.3 Africa Automotive Collision Repair Market By Vehicle Type
10.5.3.4 Africa Automotive Collision Repair Market By Service Channel
10.5.3.5 Nigeria
10.5.3.5.1 Nigeria Automotive Collision Repair Market By Product
10.5.3.5.2 Nigeria Automotive Collision Repair Market By Vehicle Type
10.5.3.5.3 Nigeria Automotive Collision Repair Market By Service Channel
10.5.3.6 South Africa
10.5.3.6.1 South Africa Automotive Collision Repair Market By Product
10.5.3.6.2 South Africa Automotive Collision Repair Market By Vehicle Type
10.5.3.6.3 South Africa Automotive Collision Repair Market By Service Channel
10.5.3.7 Rest of Africa
10.5.3.7.1 Rest of Africa Automotive Collision Repair Market By Product
10.5.3.7.2 Rest of Africa Automotive Collision Repair Market By Vehicle Type
10.5.3.7.3 Rest of Africa Automotive Collision Repair Market By Service Channel
10.6 Latin America
10.6.1 Trend Analysis
10.6.2 Latin America Automotive Collision Repair Market by country
10.6.3 Latin America Automotive Collision Repair Market By Product
10.6.4 Latin America Automotive Collision Repair Market By Vehicle Type
10.6.5 Latin America Automotive Collision Repair Market By Service Channel
10.6.6 Brazil
10.6.6.1 Brazil Automotive Collision Repair Market By Product
10.6.6.2 Brazil Automotive Collision Repair Market By Vehicle Type
10.6.6.3 Brazil Automotive Collision Repair Market By Service Channel
10.6.7 Argentina
10.6.7.1 Argentina Automotive Collision Repair Market By Product
10.6.7.2 Argentina Automotive Collision Repair Market By Vehicle Type
10.6.7.3 Argentina Automotive Collision Repair Market By Service Channel
10.6.8 Colombia
10.6.8.1 Colombia Automotive Collision Repair Market By Product
10.6.8.2 Colombia Automotive Collision Repair Market By Vehicle Type
10.6.8.3 Colombia Automotive Collision Repair Market By Service Channel
10.6.9 Rest of Latin America
10.6.9.1 Rest of Latin America Automotive Collision Repair Market By Product
10.6.9.2 Rest of Latin America Automotive Collision Repair Market By Vehicle Type
10.6.9.3 Rest of Latin America Automotive Collision Repair Market By Service Channel
11. Company Profiles
11.1 3M
11.1.1 Company Overview
11.1.2 Financial
11.1.3 Products/ Services Offered
11.1.4 The SNS View
11.2 Automotive Technology products
11.2.1 Company Overview
11.2.2 Financial
11.2.3 Products/ Services Offered
11.2.4 The SNS View
11.3 Continental AG
11.3.1 Company Overview
11.3.2 Financial
11.3.3 Products/ Services Offered
11.3.4 The SNS View
11.4 Denso Corporation
11.4.1 Company Overview
11.4.2 Financial
11.4.3 Products/ Services Offered
11.4.4 The SNS View
11.5 Faurecia
11.5.1 Company Overview
11.5.2 Financial
11.5.3 Products/ Services Offered
11.5.4 The SNS View
11.6 Federal-Mogul LLC
11.6.1 Company Overview
11.6.2 Financial
11.6.3 Products/ Services Offered
11.6.4 The SNS View
11.7 Honeywell International
11.7.1 Company Overview
11.7.2 Financial
11.7.3 Products/ Services Offered
11.7.4 The SNS View
11.8 Johnson Controls
11.8.1 Company Overview
11.8.2 Financial
11.8.3 Products/ Services Offered
11.8.4 The SNS View
11.9 Mitsuba Corp
11.9.1 Company Overview
11.9.2 Financial
11.9.3 Products/ Services Offered
11.9.4 The SNS View
11.10 Robert Bosch
11.10.1 Company Overview
11.10.2 Financial
11.10.3 Products/ Services Offered
11.10.4 The SNS View
12. Competitive Landscape
12.1 Competitive Benchmarking
12.2 Market Share Analysis
12.3 Recent Developments
12.3.1 Industry News
12.3.2 Company News
12.3.3 Mergers & Acquisitions
13. Use Case and Best Practices
14. Conclusion
An accurate research report requires proper strategizing as well as implementation. There are multiple factors involved in the completion of good and accurate research report and selecting the best methodology to compete the research is the toughest part. Since the research reports we provide play a crucial role in any company’s decision-making process, therefore we at SNS Insider always believe that we should choose the best method which gives us results closer to reality. This allows us to reach at a stage wherein we can provide our clients best and accurate investment to output ratio.
Each report that we prepare takes a timeframe of 350-400 business hours for production. Starting from the selection of titles through a couple of in-depth brain storming session to the final QC process before uploading our titles on our website we dedicate around 350 working hours. The titles are selected based on their current market cap and the foreseen CAGR and growth.
The 5 steps process:
Step 1: Secondary Research:
Secondary Research or Desk Research is as the name suggests is a research process wherein, we collect data through the readily available information. In this process we use various paid and unpaid databases which our team has access to and gather data through the same. This includes examining of listed companies’ annual reports, Journals, SEC filling etc. Apart from this our team has access to various associations across the globe across different industries. Lastly, we have exchange relationships with various university as well as individual libraries.
Step 2: Primary Research
When we talk about primary research, it is a type of study in which the researchers collect relevant data samples directly, rather than relying on previously collected data. This type of research is focused on gaining content specific facts that can be sued to solve specific problems. Since the collected data is fresh and first hand therefore it makes the study more accurate and genuine.
We at SNS Insider have divided Primary Research into 2 parts.
Part 1 wherein we interview the KOLs of major players as well as the upcoming ones across various geographic regions. This allows us to have their view over the market scenario and acts as an important tool to come closer to the accurate market numbers. As many as 45 paid and unpaid primary interviews are taken from both the demand and supply side of the industry to make sure we land at an accurate judgement and analysis of the market.
This step involves the triangulation of data wherein our team analyses the interview transcripts, online survey responses and observation of on filed participants. The below mentioned chart should give a better understanding of the part 1 of the primary interview.
Part 2: In this part of primary research the data collected via secondary research and the part 1 of the primary research is validated with the interviews from individual consultants and subject matter experts.
Consultants are those set of people who have at least 12 years of experience and expertise within the industry whereas Subject Matter Experts are those with at least 15 years of experience behind their back within the same space. The data with the help of two main processes i.e., FGDs (Focused Group Discussions) and IDs (Individual Discussions). This gives us a 3rd party nonbiased primary view of the market scenario making it a more dependable one while collation of the data pointers.
Step 3: Data Bank Validation
Once all the information is collected via primary and secondary sources, we run that information for data validation. At our intelligence centre our research heads track a lot of information related to the market which includes the quarterly reports, the daily stock prices, and other relevant information. Our data bank server gets updated every fortnight and that is how the information which we collected using our primary and secondary information is revalidated in real time.
Step 4: QA/QC Process
After all the data collection and validation our team does a final level of quality check and quality assurance to get rid of any unwanted or undesired mistakes. This might include but not limited to getting rid of the any typos, duplication of numbers or missing of any important information. The people involved in this process include technical content writers, research heads and graphics people. Once this process is completed the title gets uploader on our platform for our clients to read it.
Step 5: Final QC/QA Process:
This is the last process and comes when the client has ordered the study. In this process a final QA/QC is done before the study is emailed to the client. Since we believe in giving our clients a good experience of our research studies, therefore, to make sure that we do not lack at our end in any way humanly possible we do a final round of quality check and then dispatch the study to the client.
The Rolling Stock Market Size was valued at USD 64 billion in 2023 and is expected to reach USD 105.92 billion by 2031 and grow at a CAGR of 6.5% over the forecast period 2024-2031.
The Luxury Car Rental Market Size was USD 39.68 Billion in 2023, and is expected to reach USD 78.36 Bn by 2032, and grow at a CAGR of 7.88% by 2024-2032.
The Tugboat Market Size was valued at USD 492.19 Million in 2023 and is expected to reach USD 1127.74 Million by 2032 with a growing CAGR of 9.65% over the forecast period 2024-2032.
The Smart Railways Market size was valued at $30.89 billion in 2023 & is expected to reach USD 58.89 billion by 2031 & grow at a CAGR of 8.4% by 2024-2031
Automotive Wireless EV Charging Market Size was valued at USD 78 Million in 2023 and will reach $2823.39 Mn by 2032 and grow at a CAGR of 49% by 2024-2032
The Automotive Oil Filter Market size was USD 75.43 Bn in 2023 and is expected to reach USD 106.43 Bn by 2032 and grow at a GAGR of 3.9% by 2024-2032.
Hi! Click one of our member below to chat on Phone