image

Automation as a Service Market Report Scope & Overview:
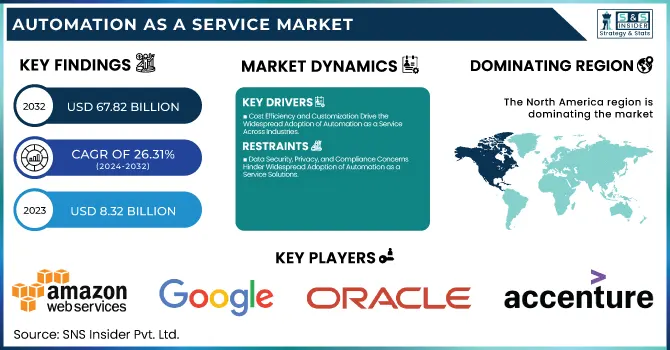
Automation as a Service Market was valued at USD 8.32 billion in 2023 and is expected to reach USD 67.82 billion by 2032, growing at a CAGR of 26.31% from 2024-2032. This report covers adoption rates of emerging technologies, indicating significant user demographics in 2023. It delves into the integration of Automation as a Service with other technologies to create innovative business processes across industries. The cost-savings impact of adopting automation solutions is also covered, where it has been identified that businesses leverage these services to maintain operational efficiency and reduced overheads. Automation is going to have a very large growth prospect as it will become an integral part of the business strategy.

Market Dynamics

Drivers

  • Cost Efficiency and Customization Drive the Widespread Adoption of Automation as a Service Across Industries

The increasing need for cost-effective solutions is driving businesses to adopt Automation as a Service, as it minimizes the need for hefty upfront investments in automation infrastructure and software. This affordability opens up opportunities for businesses of all sizes, enabling them to integrate automation without facing financial strain. In addition, the ability to customize automation solutions according to specific business processes makes this service highly adaptable across various industries. It can scale and tailor solutions to the unique demands of businesses, thereby ensuring a more personalized and efficient approach. This makes Automation as a Service an attractive choice for businesses seeking innovation while controlling costs and enhancing operational performance.

Restraints

  • Data Security, Privacy, and Compliance Concerns Hinder Widespread Adoption of Automation as a Service Solutions

As businesses migrate critical operations to cloud-based platforms, data security, privacy, and regulatory compliance become significant issues. The threat of cyber threats to sensitive business and customer information is a top concern, particularly for industries such as healthcare, finance, and government, where regulatory requirements are strict. Fear of data breaches, unauthorized access, or failure to comply with data protection laws can be an inhibiting factor for companies embracing Automation as a Service solutions in full. In addition, high standards of security maintained by the service providers as well as adhering to the local and international regulations would further complicate the adoption process. These may pose a risk that may hamper the market growth as organizations evaluate the possibilities of outsourcing their business operations through cloud-based automation.

Opportunities

  • AI and Machine Learning Integration Drives Innovation and Growth in the Automation as a Service Market

The integration of AI and machine learning technologies into the service of automation provides tremendous promise for businesses: automating increasing complexity in various tasks and also optimizing decision making. With these AI and ML technologies, a company can strive to achieve maximum accuracy, expedite data processing, and yield solutions that answer its needs accordingly. This makes the technology innovative for industries who wish to increase innovation, create a smooth pathway for operations and improve productivity as well. In addition, with more accessible and scalable automation solutions for SMEs, the efficiency and competitiveness of these small and medium-sized enterprises will increase. The increased demand for specific automation solutions as well as support for remote work environments further widens the market growth, which Automation as a Service is key to enabling business transformation.

Challenges

  • Integrating Automation Solutions with Legacy Systems Creates Significant Challenges for Successful Adoption of Automation as a Service

A significant challenge to businesses adopting Automation as a Service is the integration of automation solutions with existing legacy systems. Many organizations still rely on older infrastructure that may not be compatible with modern, cloud-based automation technologies. The complexity of integration often requires substantial time, technical expertise, and resources to ensure seamless operation between the new and old systems. This may result in delay, surprise cost, and even failure in implementation. Moreover, legacy systems might not be flexible enough to smoothly integrate into new systems, further complicating the transition. Businesses may, therefore, face challenges in adopting automation solutions that could enhance efficiency without disrupting day-to-day operations or existing workflows.

Segment Analysis

By Component

The Solution segment dominated the Automation as a Service Market with the highest revenue share of about 64% in 2023 due to the increasing demand for comprehensive, end-to-end automation solutions that streamline business processes. These solutions offer scalability, efficiency, and customization, driving widespread adoption. The Services segment is expected to grow at the fastest CAGR of about 27.48% from 2024-2032, driven by the growing need for ongoing support, maintenance, and consulting services to ensure smooth implementation and optimization of automation solutions.

By Organization Size

The Large Enterprises segment dominated the Automation as a Service Market with the highest revenue share of about 60% in 2023 due to their significant resources, scale, and greater demand for complex, integrated automation solutions across diverse functions. The Small and Medium-sized Enterprises (SMEs) segment is expected to grow at the fastest CAGR of about 27.63% from 2024-2032, driven by the increasing affordability and scalability of automation solutions, which make them more accessible for SMEs to improve efficiency and compete with larger businesses.

By End User

The BFSI segment dominated the Automation as a Service Market with the highest revenue share of about 31% in 2023 due to the sector's need for enhanced efficiency, compliance, and customer service through automated solutions. The IT and Telecom segment is expected to grow at the fastest CAGR of about 28.75% from 2024-2032, driven by the increasing adoption of automation for network management, customer support, and operational optimization in these rapidly evolving industries.

By Deployment Model

The Public Cloud segment dominated the Automation as a Service Market with the highest revenue share of about 57% in 2023 due to its cost-effectiveness, scalability, and ease of access, allowing businesses to quickly deploy automation solutions without heavy infrastructure investments. The Hybrid Cloud segment is expected to grow at the fastest CAGR of about 28.32% from 2024-2032, driven by organizations seeking the flexibility to combine the benefits of both public and private cloud environments for better control, security, and compliance while maintaining scalability.

By Type

The Rule-based Automation segment dominated the Automation as a Service Market with the highest revenue share of about 60% in 2023 due to its simplicity, ease of implementation, and effectiveness in automating repetitive, well-defined tasks across various industries. The Knowledge-based Automation segment is expected to grow at the fastest CAGR of about 28.11% from 2024-2032, driven by the increasing adoption of AI, machine learning, and cognitive technologies that enable more complex, data-driven automation for decision-making and problem-solving in dynamic business environments.

Regional Analysis

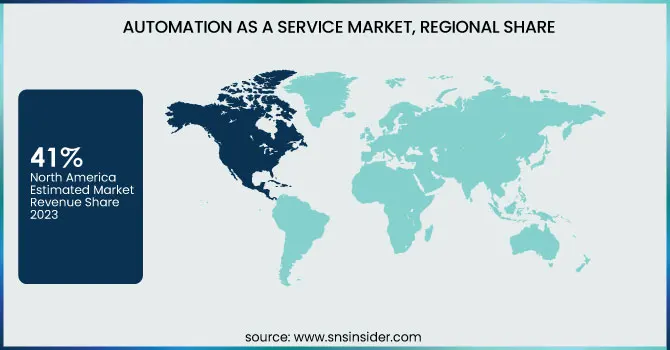
North America held the highest revenue share of about 41% in 2023, led by its superior technological infrastructure and high adoption of cloud-based automation solutions. Well-established industries and a strong focus on digital transformation across sectors like BFSI, healthcare, and manufacturing have driven substantial demand for automation solutions in the region. Major service providers and robust investments in AI and machine learning also made North America a leader in the market.

Asia Pacific is expected to grow at the fastest CAGR of about 28.48% from 2024-2032 due to the growing acceptance among businesses in emerging economies toward automation for the purpose of efficiency and innovation. Growing urbanization, a rapidly growing middle class, and increasing adoption of cloud technologies are driving this growth. Furthermore, the region's emphasis on smart manufacturing along with the push from governments towards digitalization has made Asia Pacific an emerging hotbed for the future of Automation as a Service.

Key Players

  • Amazon Web Services (AWS) (AWS Lambda, Amazon S3)

  • Google LLC (Google Cloud AI, Google Cloud Automation)

  • SAP SE (SAP Intelligent RPA, SAP Business Technology Platform)

  • Oracle Corporation (Oracle Autonomous Database, Oracle Cloud Infrastructure)

  • Accenture (Accenture myConcerto, Accenture Intelligent Automation)

  • AutomationEdge (AutomationEdge IT Automation, AutomationEdge Cloud Management)

  • WorkFusion (WorkFusion Intelligent Automation Cloud, WorkFusion RPA)

  • Cognizant Technology Solutions (Cognizant Intelligent Automation, Cognizant RPA)

  • ServiceNow (ServiceNow Automation Engine, ServiceNow Flow Designer)

  • Digital Workforce (Digital Workforce RPA, Digital Workforce Automation Suite)

  • Automation Anywhere Inc. (Automation 360, Bot Insight)

  • Blue Prism Limited (Blue Prism Cloud, Blue Prism RPA)

  • HCL Technologies Limited (HCL RPA, HCL Automation Hub)

  • Hewlett Packard Enterprise Development LP (HPE Ezmeral, HPE OneView)

  • International Business Machines Corporation (IBM Robotic Process Automation, IBM Cloud Pak for Automation)

  • Kofax Inc. (Kofax RPA, Kofax Intelligent Automation)

  • Microsoft Corporation (Power Automate, Azure Logic Apps)

  • NICE (NICE RPA, NICE Workforce Management)

  • Pegasystems Inc. (Pega Platform, Pega Robotic Automation)

  • UiPath (UiPath Studio, UiPath Orchestrator)

Recent Developments:

  • In December 2024, AWS launched the Security Incident Response service to automate triage and remediation of security events detected by Amazon GuardDuty, aiming to reduce response times for cyber threats and minimize alert fatigue for security teams.

  • In February 2024, UiPath and Google Cloud expanded their partnership, making UiPath’s AI-powered automation platform available on the Google Cloud Marketplace. This collaboration integrates with Google Vertex AI, enabling businesses to enhance automation with generative AI capabilities, machine learning models, and cloud-based workflows.

  • In October 2024, Oracle introduced new AI-powered service workflows within Oracle Fusion Cloud Service, designed to enhance the customer service lifecycle. These tools automate service request handling, improve response times, and boost overall customer satisfaction by using generative AI for task summarization and issue resolution.


Automation as a Service Market Report Scope:

Report Attributes Details
Market Size in 2023 USD 8.32 Billion
Market Size by 2032 USD 67.82 Billion
CAGR CAGR of 26.31% From 2024 to 2032
Base Year 2023
Forecast Period 2024-2032
Historical Data 2020-2022
Report Scope & Coverage Market Size, Segments Analysis, Competitive  Landscape, Regional Analysis, DROC & SWOT Analysis, Forecast Outlook
Key Segments • By Component (Solution, Services)
• By Type (Rule-based Automation, Knowledge-based Automation)
• By Deployment Model (Public Cloud, Private Cloud, Hybrid Cloud)
• By Organization Size (Small and Medium-sized Enterprises (SMEs), Large Enterprises)
• By End User (BFSI, Telecom and IT, Retail and Consumer Goods, Healthcare and Life Sciences, Manufacturing, Other End-user Industries)
Regional Analysis/Coverage North America (US, Canada, Mexico), Europe (Eastern Europe [Poland, Romania, Hungary, Turkey, Rest of Eastern Europe] Western Europe] Germany, France, UK, Italy, Spain, Netherlands, Switzerland, Austria, Rest of Western Europe]), Asia Pacific (China, India, Japan, South Korea, Vietnam, Singapore, Australia, Rest of Asia Pacific), Middle East & Africa (Middle East [UAE, Egypt, Saudi Arabia, Qatar, Rest of Middle East], Africa [Nigeria, South Africa, Rest of Africa], Latin America (Brazil, Argentina, Colombia, Rest of Latin America)
Company Profiles Amazon Web Services (AWS), Google LLC, SAP SE, Oracle Corporation, Accenture, AutomationEdge, WorkFusion, Cognizant Technology Solutions, ServiceNow, Digital Workforce, Automation Anywhere Inc., Blue Prism Limited, HCL Technologies Limited, Hewlett Packard Enterprise Development LP, International Business Machines Corporation (IBM), Kofax Inc., Microsoft Corporation, NICE, Pegasystems Inc., UiPath

Frequently Asked Questions

ANS: The Automation as a Service market was valued at USD 8.32 billion in 2023 and is expected to reach USD 67.82 billion by 2032, growing at a CAGR of 26.31% from 2024 to 2032.

ANS: The Solution segment holds the highest revenue share of about 64%.

ANS: Large Enterprises hold the largest market share at about 60%.

ANS: The BFSI sector has the largest revenue share at about 31%.

ANS: Asia Pacific is expected to grow at the fastest CAGR of 28.48% from 2024-2032.

Table of Contents:

1. Introduction

1.1 Market Definition

1.2 Scope (Inclusion and Exclusions)

1.3 Research Assumptions

2. Executive Summary

2.1 Market Overview

2.2 Regional Synopsis

2.3 Competitive Summary

3. Research Methodology

3.1 Top-Down Approach

3.2 Bottom-up Approach

3.3. Data Validation

3.4 Primary Interviews

4. Market Dynamics Impact Analysis

4.1 Market Driving Factors Analysis

4.1.1 Drivers

4.1.2 Restraints

4.2 PESTLE Analysis

4.3 Porter’s Five Forces Model

5. Statistical Insights and Trends Reporting

5.1 Adoption Rates of Emerging Technologies

5.2 User Demographics, 2023

5.3 Integration with Other Technologies

5.4 Cost-Savings Impact

6. Competitive Landscape

6.1 List of Major Companies, By Region

6.2 Market Share Analysis, By Region

6.3 Product Benchmarking

6.3.1 Product specifications and features

6.3.2 Pricing

6.4 Strategic Initiatives

6.4.1 Marketing and promotional activities

6.4.2 Distribution and supply chain strategies

6.4.3 Expansion plans and new product launches

6.4.4 Strategic partnerships and collaborations

6.5 Technological Advancements

6.6 Market Positioning and Branding

7. Automation as a Service Market Segmentation, By Component

7.1 Chapter Overview

7.2 Solution

7.2.1 Solution Market Trends Analysis (2020-2032)

7.2.2 Solution Market Size Estimates and Forecasts to 2032 (USD Billion)

7.3 Services

7.3.1 Software Market Trends Analysis (2020-2032)

7.3.2 Software Market Size Estimates and Forecasts to 2032 (USD Billion)

8. Automation as a Service Market Segmentation, By End User

8.1 Chapter Overview

8.2 BFSI

8.2.1 BFSI Market Trends Analysis (2020-2032)

8.2.2 BFSI Market Size Estimates And Forecasts To 2032 (USD Billion)

8.3 IT and Telecom

8.3.1 IT and Telecom Market Trends Analysis (2020-2032)

8.3.2 IT and Telecom Market Size Estimates And Forecasts To 2032 (USD Billion)

8.4 Retail and Consumer Goods

8.4.1 Retail and Consumer Goods Market Trends Analysis (2020-2032)

8.4.2 Retail and Consumer Goods Market Size Estimates And Forecasts To 2032 (USD Billion)

8.5 Healthcare and Life Sciences

8.5.1 Healthcare and Life Sciences Market Trends Analysis (2020-2032)

8.5.2 Healthcare and Life Sciences Market Size Estimates And Forecasts To 2032 (USD Billion)

8.6 Manufacturing

8.6.1 Manufacturing Market Trends Analysis (2020-2032)

8.6.2 Manufacturing Market Size Estimates And Forecasts To 2032 (USD Billion)

8.7 Other End-user Industries

8.7.1 Other End-user Industries Market Trends Analysis (2020-2032)

8.7.2 Other End-user Industries Market Size Estimates And Forecasts To 2032 (USD Billion)

9. Automation as a Service Market Segmentation, By Deployment Model

9.1 Chapter Overview

9.2 Public Cloud

9.2.1 Public Cloud Market Trends Analysis (2020-2032)

9.2.2 Public Cloud Market Size Estimates And Forecasts To 2032 (USD Billion)

9.3 Private Cloud

9.3.1 Private Cloud Market Trends Analysis (2020-2032)

9.3.2 Private Cloud Market Size Estimates And Forecasts To 2032 (USD Billion)

9.4 Hybrid Cloud

9.4.1 Hybrid Cloud Market Trends Analysis (2020-2032)

9.4.2 Hybrid Cloud Market Size Estimates And Forecasts To 2032 (USD Billion)

10. Automation as a Service Market Segmentation, By Type

10.1 Chapter Overview

10.2 Rule-based Automation

10.2.1 Rule-based Automation Market Trends Analysis (2020-2032)

10.2.2 Rule-based Automation Market Size Estimates And Forecasts To 2032 (USD Billion)

10.3 Knowledge-based Automation

10.3.1 Knowledge-based Automation Market Trends Analysis (2020-2032)

10.3.2 Knowledge-based Automation Market Size Estimates And Forecasts To 2032 (USD Billion)

11. Automation as a Service Market Segmentation, By Organization Size

11.1 Chapter Overview

11.2 Small and Medium-sized Enterprises (SMEs)

11.2.1 Small and Medium-sized Enterprises (SMEs) Market Trends Analysis (2020-2032)

11.2.2 Small and Medium-sized Enterprises (SMEs) Market Size Estimates And Forecasts To 2032 (USD Billion)

11.3 Large Enterprises

11.3.1 Large Enterprises Market Trends Analysis (2020-2032)

11.3.2 Large Enterprises Market Size Estimates And Forecasts To 2032 (USD Billion)

12. Regional Analysis

12.1 Chapter Overview

12.2 North America

12.2.1 Trends Analysis

12.2.2 North America Automation as a Service Market Estimates And Forecasts, By Country (2020-2032) (USD Billion)

12.2.3 North America Automation as a Service Market Estimates And Forecasts, By Component (2020-2032) (USD Billion)

12.2.4 North America Automation as a Service Market Estimates And Forecasts, By End User (2020-2032) (USD Billion)

12.2.5 North America Automation as a Service Market Estimates And Forecasts, By Deployment Model (2020-2032) (USD Billion)

12.2.6 North America Automation as a Service Market Estimates And Forecasts, By Type (2020-2032) (USD Billion)

12.2.7 North America Automation as a Service Market Estimates And Forecasts, By Organization Size (2020-2032) (USD Billion)

12.2.8 USA

12.2.8.1 USA Automation as a Service Market Estimates And Forecasts, By Component (2020-2032) (USD Billion)

12.2.8.2 USA Automation as a Service Market Estimates And Forecasts, By End User (2020-2032) (USD Billion)

12.2.8.3 USA Automation as a Service Market Estimates And Forecasts, By Deployment Model (2020-2032) (USD Billion)

12.2.8.4 USA Automation as a Service Market Estimates And Forecasts, By Type (2020-2032) (USD Billion)

12.2.8.5 USA Automation as a Service Market Estimates And Forecasts, By Organization Size (2020-2032) (USD Billion)

12.2.9 Canada

12.2.9.1 Canada Automation as a Service Market Estimates And Forecasts, By Component (2020-2032) (USD Billion)

12.2.9.2 Canada Automation as a Service Market Estimates And Forecasts, By End User (2020-2032) (USD Billion)

12.2.9.3 Canada Automation as a Service Market Estimates And Forecasts, By Deployment Model (2020-2032) (USD Billion)

12.2.9.4 Canada Automation as a Service Market Estimates And Forecasts, By Type (2020-2032) (USD Billion)

12.2.9.5 Canada Automation as a Service Market Estimates And Forecasts, By Organization Size (2020-2032) (USD Billion)

12.2.10 Mexico

12.2.10.1 Mexico Automation as a Service Market Estimates And Forecasts, By Component (2020-2032) (USD Billion)

12.2.10.2 Mexico Automation as a Service Market Estimates And Forecasts, By End User (2020-2032) (USD Billion)

12.2.10.3 Mexico Automation as a Service Market Estimates And Forecasts, By Deployment Model (2020-2032) (USD Billion)

12.2.10.4 Mexico Automation as a Service Market Estimates And Forecasts, By Type (2020-2032) (USD Billion)

12.2.10.5 Mexico Automation as a Service Market Estimates And Forecasts, By Organization Size (2020-2032) (USD Billion)

12.3 Europe

12.3.1 Eastern Europe

12.3.1.1 Trends Analysis

12.3.1.2 Eastern Europe Automation as a Service Market Estimates And Forecasts, By Country (2020-2032) (USD Billion)

12.3.1.3 Eastern Europe Automation as a Service Market Estimates And Forecasts, By Component (2020-2032) (USD Billion)

12.3.1.4 Eastern Europe Automation as a Service Market Estimates And Forecasts, By End User (2020-2032) (USD Billion)

12.3.1.5 Eastern Europe Automation as a Service Market Estimates And Forecasts, By Deployment Model (2020-2032) (USD Billion)

12.3.1.6 Eastern Europe Automation as a Service Market Estimates And Forecasts, By Type (2020-2032) (USD Billion)

12.3.1.7 Eastern Europe Automation as a Service Market Estimates And Forecasts, By Organization Size (2020-2032) (USD Billion)

12.3.1.8 Poland

12.3.1.8.1 Poland Automation as a Service Market Estimates And Forecasts, By Component (2020-2032) (USD Billion)

12.3.1.8.2 Poland Automation as a Service Market Estimates And Forecasts, By End User (2020-2032) (USD Billion)

12.3.1.8.3 Poland Automation as a Service Market Estimates And Forecasts, By Deployment Model (2020-2032) (USD Billion)

12.3.1.8.4 Poland Automation as a Service Market Estimates And Forecasts, By Type (2020-2032) (USD Billion)

12.3.1.8.5 Poland Automation as a Service Market Estimates And Forecasts, By Organization Size (2020-2032) (USD Billion)

12.3.1.9 Romania

12.3.1.9.1 Romania Automation as a Service Market Estimates And Forecasts, By Component (2020-2032) (USD Billion)

12.3.1.9.2 Romania Automation as a Service Market Estimates And Forecasts, By End User (2020-2032) (USD Billion)

12.3.1.9.3 Romania Automation as a Service Market Estimates And Forecasts, By Deployment Model (2020-2032) (USD Billion)

12.3.1.9.4 Romania Automation as a Service Market Estimates And Forecasts, By Type (2020-2032) (USD Billion)

12.3.1.9.5 Romania Automation as a Service Market Estimates And Forecasts, By Organization Size (2020-2032) (USD Billion)

12.3.1.10 Hungary

12.3.1.10.1 Hungary Automation as a Service Market Estimates And Forecasts, By Component (2020-2032) (USD Billion)

12.3.1.10.2 Hungary Automation as a Service Market Estimates And Forecasts, By End User (2020-2032) (USD Billion)

12.3.1.10.3 Hungary Automation as a Service Market Estimates And Forecasts, By Deployment Model (2020-2032) (USD Billion)

12.3.1.10.4 Hungary Automation as a Service Market Estimates And Forecasts, By Type (2020-2032) (USD Billion)

12.3.1.10.5 Hungary Automation as a Service Market Estimates And Forecasts, By Organization Size (2020-2032) (USD Billion)

12.3.1.11 Turkey

12.3.1.11.1 Turkey Automation as a Service Market Estimates And Forecasts, By Component (2020-2032) (USD Billion)

12.3.1.11.2 Turkey Automation as a Service Market Estimates And Forecasts, By End User (2020-2032) (USD Billion)

12.3.1.11.3 Turkey Automation as a Service Market Estimates And Forecasts, By Deployment Model (2020-2032) (USD Billion)

12.3.1.11.4 Turkey Automation as a Service Market Estimates And Forecasts, By Type (2020-2032) (USD Billion)

12.3.1.11.5 Turkey Automation as a Service Market Estimates And Forecasts, By Organization Size (2020-2032) (USD Billion)

12.3.1.12 Rest Of Eastern Europe

12.3.1.12.1 Rest Of Eastern Europe Automation as a Service Market Estimates And Forecasts, By Component (2020-2032) (USD Billion)

12.3.1.12.2 Rest Of Eastern Europe Automation as a Service Market Estimates And Forecasts, By End User (2020-2032) (USD Billion)

12.3.1.12.3 Rest Of Eastern Europe Automation as a Service Market Estimates And Forecasts, By Deployment Model (2020-2032) (USD Billion)

12.3.1.12.4 Rest Of Eastern Europe Automation as a Service Market Estimates And Forecasts, By Type (2020-2032) (USD Billion)

12.3.1.12.5 Rest Of Eastern Europe Automation as a Service Market Estimates And Forecasts, By Organization Size (2020-2032) (USD Billion)

12.3.2 Western Europe

12.3.2.1 Trends Analysis

12.3.2.2 Western Europe Automation as a Service Market Estimates And Forecasts, By Country (2020-2032) (USD Billion)

12.3.2.3 Western Europe Automation as a Service Market Estimates And Forecasts, By Component (2020-2032) (USD Billion)

12.3.2.4 Western Europe Automation as a Service Market Estimates And Forecasts, By End User (2020-2032) (USD Billion)

12.3.2.5 Western Europe Automation as a Service Market Estimates And Forecasts, By Deployment Model (2020-2032) (USD Billion)

12.3.2.6 Western Europe Automation as a Service Market Estimates And Forecasts, By Type (2020-2032) (USD Billion)

12.3.2.7 Western Europe Automation as a Service Market Estimates And Forecasts, By Organization Size (2020-2032) (USD Billion)

12.3.2.8 Germany

12.3.2.8.1 Germany Automation as a Service Market Estimates And Forecasts, By Component (2020-2032) (USD Billion)

12.3.2.8.2 Germany Automation as a Service Market Estimates And Forecasts, By End User (2020-2032) (USD Billion)

12.3.2.8.3 Germany Automation as a Service Market Estimates And Forecasts, By Deployment Model (2020-2032) (USD Billion)

12.3.2.8.4 Germany Automation as a Service Market Estimates And Forecasts, By Type (2020-2032) (USD Billion)

12.3.2.8.5 Germany Automation as a Service Market Estimates And Forecasts, By Organization Size (2020-2032) (USD Billion)

12.3.2.9 France

12.3.2.9.1 France Automation as a Service Market Estimates And Forecasts, By Component (2020-2032) (USD Billion)

12.3.2.9.2 France Automation as a Service Market Estimates And Forecasts, By End User (2020-2032) (USD Billion)

12.3.2.9.3 France Automation as a Service Market Estimates And Forecasts, By Deployment Model (2020-2032) (USD Billion)

12.3.2.9.4 France Automation as a Service Market Estimates And Forecasts, By Type (2020-2032) (USD Billion)

12.3.2.9.5 France Automation as a Service Market Estimates And Forecasts, By Organization Size (2020-2032) (USD Billion)

12.3.2.10 UK

12.3.2.10.1 UK Automation as a Service Market Estimates And Forecasts, By Component (2020-2032) (USD Billion)

12.3.2.10.2 UK Automation as a Service Market Estimates And Forecasts, By End User (2020-2032) (USD Billion)

12.3.2.10.3 UK Automation as a Service Market Estimates And Forecasts, By Deployment Model (2020-2032) (USD Billion)

12.3.2.10.4 UK Automation as a Service Market Estimates And Forecasts, By Type (2020-2032) (USD Billion)

12.3.2.10.5 UK Automation as a Service Market Estimates And Forecasts, By Organization Size (2020-2032) (USD Billion)

12.3.2.11 Italy

12.3.2.11.1 Italy Automation as a Service Market Estimates And Forecasts, By Component (2020-2032) (USD Billion)

12.3.2.11.2 Italy Automation as a Service Market Estimates And Forecasts, By End User (2020-2032) (USD Billion)

12.3.2.11.3 Italy Automation as a Service Market Estimates And Forecasts, By Deployment Model (2020-2032) (USD Billion)

12.3.2.11.4 Italy Automation as a Service Market Estimates And Forecasts, By Type (2020-2032) (USD Billion)

12.3.2.11.5 Italy Automation as a Service Market Estimates And Forecasts, By Organization Size (2020-2032) (USD Billion)

12.3.2.12 Spain

12.3.2.12.1 Spain Automation as a Service Market Estimates And Forecasts, By Component (2020-2032) (USD Billion)

12.3.2.12.2 Spain Automation as a Service Market Estimates And Forecasts, By End User (2020-2032) (USD Billion)

12.3.2.12.3 Spain Automation as a Service Market Estimates And Forecasts, By Deployment Model (2020-2032) (USD Billion)

12.3.2.12.4 Spain Automation as a Service Market Estimates And Forecasts, By Type (2020-2032) (USD Billion)

12.3.2.12.5 Spain Automation as a Service Market Estimates And Forecasts, By Organization Size (2020-2032) (USD Billion)

12.3.2.13 Netherlands

12.3.2.13.1 Netherlands Automation as a Service Market Estimates And Forecasts, By Component (2020-2032) (USD Billion)

12.3.2.13.2 Netherlands Automation as a Service Market Estimates And Forecasts, By End User (2020-2032) (USD Billion)

12.3.2.13.3 Netherlands Automation as a Service Market Estimates And Forecasts, By Deployment Model (2020-2032) (USD Billion)

12.3.2.13.4 Netherlands Automation as a Service Market Estimates And Forecasts, By Type (2020-2032) (USD Billion)

12.3.2.13.5 Netherlands Automation as a Service Market Estimates And Forecasts, By Organization Size (2020-2032) (USD Billion)

12.3.2.14 Switzerland

12.3.2.14.1 Switzerland Automation as a Service Market Estimates And Forecasts, By Component (2020-2032) (USD Billion)

12.3.2.14.2 Switzerland Automation as a Service Market Estimates And Forecasts, By End User (2020-2032) (USD Billion)

12.3.2.14.3 Switzerland Automation as a Service Market Estimates And Forecasts, By Deployment Model (2020-2032) (USD Billion)

12.3.2.14.4 Switzerland Automation as a Service Market Estimates And Forecasts, By Type (2020-2032) (USD Billion)

12.3.2.12.5 Switzerland Automation as a Service Market Estimates And Forecasts, By Organization Size (2020-2032) (USD Billion)

12.3.2.15 Austria

12.3.2.15.1 Austria Automation as a Service Market Estimates And Forecasts, By Component (2020-2032) (USD Billion)

12.3.2.15.2 Austria Automation as a Service Market Estimates And Forecasts, By End User (2020-2032) (USD Billion)

12.3.2.15.3 Austria Automation as a Service Market Estimates And Forecasts, By Deployment Model (2020-2032) (USD Billion)

12.3.2.15.4 Austria Automation as a Service Market Estimates And Forecasts, By Type (2020-2032) (USD Billion)

12.3.2.15.5 Austria Automation as a Service Market Estimates And Forecasts, By Organization Size (2020-2032) (USD Billion)

12.3.2.16 Rest Of Western Europe

12.3.2.16.1 Rest Of Western Europe Automation as a Service Market Estimates And Forecasts, By Component (2020-2032) (USD Billion)

12.3.2.16.2 Rest Of Western Europe Automation as a Service Market Estimates And Forecasts, By End User (2020-2032) (USD Billion)

12.3.2.16.3 Rest Of Western Europe Automation as a Service Market Estimates And Forecasts, By Deployment Model (2020-2032) (USD Billion)

12.3.2.16.4 Rest Of Western Europe Automation as a Service Market Estimates And Forecasts, By Type (2020-2032) (USD Billion)

12.3.2.16.5 Rest Of Western Europe Automation as a Service Market Estimates And Forecasts, By Organization Size (2020-2032) (USD Billion)

12.4 Asia Pacific

12.4.1 Trends Analysis

12.4.2 Asia Pacific Automation as a Service Market Estimates And Forecasts, By Country (2020-2032) (USD Billion)

12.4.3 Asia Pacific Automation as a Service Market Estimates And Forecasts, By Component (2020-2032) (USD Billion)

12.4.4 Asia Pacific Automation as a Service Market Estimates And Forecasts, By End User (2020-2032) (USD Billion)

12.4.5 Asia Pacific Automation as a Service Market Estimates And Forecasts, By Deployment Model (2020-2032) (USD Billion)

12.4.6 Asia Pacific Automation as a Service Market Estimates And Forecasts, By Type (2020-2032) (USD Billion)

12.4.7 Asia Pacific Automation as a Service Market Estimates And Forecasts, By Organization Size (2020-2032) (USD Billion)

12.4.8 China

12.4.8.1 China Automation as a Service Market Estimates And Forecasts, By Component (2020-2032) (USD Billion)

12.4.8.2 China Automation as a Service Market Estimates And Forecasts, By End User (2020-2032) (USD Billion)

12.4.8.3 China Automation as a Service Market Estimates And Forecasts, By Deployment Model (2020-2032) (USD Billion)

12.4.8.4 China Automation as a Service Market Estimates And Forecasts, By Type (2020-2032) (USD Billion)

12.4.8.5 China Automation as a Service Market Estimates And Forecasts, By Organization Size (2020-2032) (USD Billion)

12.4.9 India

12.4.9.1 India Automation as a Service Market Estimates And Forecasts, By Component (2020-2032) (USD Billion)

12.4.9.2 India Automation as a Service Market Estimates And Forecasts, By End User (2020-2032) (USD Billion)

12.4.9.3 India Automation as a Service Market Estimates And Forecasts, By Deployment Model (2020-2032) (USD Billion)

12.4.9.4 India Automation as a Service Market Estimates And Forecasts, By Type (2020-2032) (USD Billion)

12.4.9.5 India Automation as a Service Market Estimates And Forecasts, By Organization Size (2020-2032) (USD Billion)

12.4.10 Japan

12.4.10.1 Japan Automation as a Service Market Estimates And Forecasts, By Component (2020-2032) (USD Billion)

12.4.10.2 Japan Automation as a Service Market Estimates And Forecasts, By End User (2020-2032) (USD Billion)

12.4.10.3 Japan Automation as a Service Market Estimates And Forecasts, By Deployment Model (2020-2032) (USD Billion)

12.4.10.4 Japan Automation as a Service Market Estimates And Forecasts, By Type (2020-2032) (USD Billion)

12.4.10.5 Japan Automation as a Service Market Estimates And Forecasts, By Organization Size (2020-2032) (USD Billion)

12.4.11 South Korea

12.4.11.1 South Korea Automation as a Service Market Estimates And Forecasts, By Component (2020-2032) (USD Billion)

12.4.11.2 South Korea Automation as a Service Market Estimates And Forecasts, By End User (2020-2032) (USD Billion)

12.4.11.3 South Korea Automation as a Service Market Estimates And Forecasts, By Deployment Model (2020-2032) (USD Billion)

12.4.11.4 South Korea Automation as a Service Market Estimates And Forecasts, By Type (2020-2032) (USD Billion)

12.4.11.5 South Korea Automation as a Service Market Estimates And Forecasts, By Organization Size (2020-2032) (USD Billion)

12.4.12 Vietnam

12.4.12.1 Vietnam Automation as a Service Market Estimates And Forecasts, By Component (2020-2032) (USD Billion)

12.4.12.2 Vietnam Automation as a Service Market Estimates And Forecasts, By End User (2020-2032) (USD Billion)

12.4.12.3 Vietnam Automation as a Service Market Estimates And Forecasts, By Deployment Model (2020-2032) (USD Billion)

12.4.12.4 Vietnam Automation as a Service Market Estimates And Forecasts, By Type (2020-2032) (USD Billion)

12.4.12.5 Vietnam Automation as a Service Market Estimates And Forecasts, By Organization Size (2020-2032) (USD Billion)

12.4.13 Singapore

12.4.13.1 Singapore Automation as a Service Market Estimates And Forecasts, By Component (2020-2032) (USD Billion)

12.4.13.2 Singapore Automation as a Service Market Estimates And Forecasts, By End User (2020-2032) (USD Billion)

12.4.13.3 Singapore Automation as a Service Market Estimates And Forecasts, By Deployment Model (2020-2032) (USD Billion)

12.4.13.4 Singapore Automation as a Service Market Estimates And Forecasts, By Type (2020-2032) (USD Billion)

12.4.13.5 Singapore Automation as a Service Market Estimates And Forecasts, By Organization Size (2020-2032) (USD Billion)

12.4.14 Australia

12.4.14.1 Australia Automation as a Service Market Estimates And Forecasts, By Component (2020-2032) (USD Billion)

12.4.14.2 Australia Automation as a Service Market Estimates And Forecasts, By End User (2020-2032) (USD Billion)

12.4.14.3 Australia Automation as a Service Market Estimates And Forecasts, By Deployment Model (2020-2032) (USD Billion)

12.4.14.4 Australia Automation as a Service Market Estimates And Forecasts, By Type (2020-2032) (USD Billion)

12.4.14.5 Australia Automation as a Service Market Estimates And Forecasts, By Organization Size (2020-2032) (USD Billion)

12.4.15 Rest Of Asia Pacific

12.4.15.1 Rest Of Asia Pacific Automation as a Service Market Estimates And Forecasts, By Component (2020-2032) (USD Billion)

12.4.15.2 Rest Of Asia Pacific Automation as a Service Market Estimates And Forecasts, By End User (2020-2032) (USD Billion)

12.4.15.3 Rest Of Asia Pacific Automation as a Service Market Estimates And Forecasts, By Deployment Model (2020-2032) (USD Billion)

12.4.15.4 Rest Of Asia Pacific Automation as a Service Market Estimates And Forecasts, By Type (2020-2032) (USD Billion)

12.4.15.5 Rest Of Asia Pacific Automation as a Service Market Estimates And Forecasts, By Organization Size (2020-2032) (USD Billion)

12.5 Middle East And Africa

12.5.1 Middle East

12.5.1.1 Trends Analysis

12.5.1.2 Middle East Automation as a Service Market Estimates And Forecasts, By Country (2020-2032) (USD Billion)

12.5.1.3 Middle East Automation as a Service Market Estimates And Forecasts, By Component (2020-2032) (USD Billion)

12.5.1.4 Middle East Automation as a Service Market Estimates And Forecasts, By End User (2020-2032) (USD Billion)

12.5.1.5 Middle East Automation as a Service Market Estimates And Forecasts, By Deployment Model (2020-2032) (USD Billion)

12.5.1.6 Middle East Automation as a Service Market Estimates And Forecasts, By Type (2020-2032) (USD Billion)

12.5.1.7 Middle East Automation as a Service Market Estimates And Forecasts, By Organization Size (2020-2032) (USD Billion)

12.5.1.8 UAE

12.5.1.8.1 UAE Automation as a Service Market Estimates And Forecasts, By Component (2020-2032) (USD Billion)

12.5.1.8.2 UAE Automation as a Service Market Estimates And Forecasts, By End User (2020-2032) (USD Billion)

12.5.1.8.3 UAE Automation as a Service Market Estimates And Forecasts, By Deployment Model (2020-2032) (USD Billion)

12.5.1.8.4 UAE Automation as a Service Market Estimates And Forecasts, By Type (2020-2032) (USD Billion)

12.5.1.8.5 UAE Automation as a Service Market Estimates And Forecasts, By Organization Size (2020-2032) (USD Billion)

12.5.1.9 Egypt

12.5.1.9.1 Egypt Automation as a Service Market Estimates And Forecasts, By Component (2020-2032) (USD Billion)

12.5.1.9.2 Egypt Automation as a Service Market Estimates And Forecasts, By End User (2020-2032) (USD Billion)

12.5.1.9.3 Egypt Automation as a Service Market Estimates And Forecasts, By Deployment Model (2020-2032) (USD Billion)

12.5.1.9.4 Egypt Automation as a Service Market Estimates And Forecasts, By Type (2020-2032) (USD Billion)

12.5.1.9.5 Egypt Automation as a Service Market Estimates And Forecasts, By Organization Size (2020-2032) (USD Billion)

12.5.1.10 Saudi Arabia

12.5.1.10.1 Saudi Arabia Automation as a Service Market Estimates And Forecasts, By Component (2020-2032) (USD Billion)

12.5.1.10.2 Saudi Arabia Automation as a Service Market Estimates And Forecasts, By End User (2020-2032) (USD Billion)

12.5.1.10.3 Saudi Arabia Automation as a Service Market Estimates And Forecasts, By Deployment Model (2020-2032) (USD Billion)

12.5.1.10.4 Saudi Arabia Automation as a Service Market Estimates And Forecasts, By Type (2020-2032) (USD Billion)

12.5.1.10.5 Saudi Arabia Automation as a Service Market Estimates And Forecasts, By Organization Size (2020-2032) (USD Billion)

12.5.1.11 Qatar

12.5.1.11.1 Qatar Automation as a Service Market Estimates And Forecasts, By Component (2020-2032) (USD Billion)

12.5.1.11.2 Qatar Automation as a Service Market Estimates And Forecasts, By End User (2020-2032) (USD Billion)

12.5.1.11.3 Qatar Automation as a Service Market Estimates And Forecasts, By Deployment Model (2020-2032) (USD Billion)

12.5.1.11.4 Qatar Automation as a Service Market Estimates And Forecasts, By Type (2020-2032) (USD Billion)

12.5.1.11.5 Qatar Automation as a Service Market Estimates And Forecasts, By Organization Size (2020-2032) (USD Billion)

12.5.1.12 Rest Of Middle East

12.5.1.12.1 Rest Of Middle East Automation as a Service Market Estimates And Forecasts, By Component (2020-2032) (USD Billion)

12.5.1.12.2 Rest Of Middle East Automation as a Service Market Estimates And Forecasts, By End User (2020-2032) (USD Billion)

12.5.1.12.3 Rest Of Middle East Automation as a Service Market Estimates And Forecasts, By Deployment Model (2020-2032) (USD Billion)

12.5.1.12.4 Rest Of Middle East Automation as a Service Market Estimates And Forecasts, By Type (2020-2032) (USD Billion)

12.5.1.12.5 Rest Of Middle East Automation as a Service Market Estimates And Forecasts, By Organization Size (2020-2032) (USD Billion)

12.5.2 Africa

12.5.2.1 Trends Analysis

12.5.2.2 Africa Automation as a Service Market Estimates And Forecasts, By Country (2020-2032) (USD Billion)

12.5.2.3 Africa Automation as a Service Market Estimates And Forecasts, By Component (2020-2032) (USD Billion)

12.5.2.4 Africa Automation as a Service Market Estimates And Forecasts, By End User (2020-2032) (USD Billion)

12.5.2.5 Africa Automation as a Service Market Estimates And Forecasts, By Deployment Model (2020-2032) (USD Billion)

12.5.2.6 Africa Automation as a Service Market Estimates And Forecasts, By Type (2020-2032) (USD Billion)

12.5.2.7 Africa Automation as a Service Market Estimates And Forecasts, By Organization Size (2020-2032) (USD Billion)

12.5.2.8 South Africa

12.5.2.8.1 South Africa Automation as a Service Market Estimates And Forecasts, By Component (2020-2032) (USD Billion)

12.5.2.8.2 South Africa Automation as a Service Market Estimates And Forecasts, By End User (2020-2032) (USD Billion)

12.5.2.8.3 South Africa Automation as a Service Market Estimates And Forecasts, By Deployment Model (2020-2032) (USD Billion)

12.5.2.8.4 South Africa Automation as a Service Market Estimates And Forecasts, By Type (2020-2032) (USD Billion)

12.5.2.8.5 South Africa Automation as a Service Market Estimates And Forecasts, By Organization Size (2020-2032) (USD Billion)

12.5.2.9 Nigeria

12.5.2.9.1 Nigeria Automation as a Service Market Estimates And Forecasts, By Component (2020-2032) (USD Billion)

12.5.2.9.2 Nigeria Automation as a Service Market Estimates And Forecasts, By End User (2020-2032) (USD Billion)

12.5.2.9.3 Nigeria Automation as a Service Market Estimates And Forecasts, By Deployment Model (2020-2032) (USD Billion)

12.5.2.9.4 Nigeria Automation as a Service Market Estimates And Forecasts, By Type (2020-2032) (USD Billion)

12.5.2.9.5 Nigeria Automation as a Service Market Estimates And Forecasts, By Organization Size (2020-2032) (USD Billion)

12.5.2.10 Rest Of Africa

12.5.2.10.1 Rest Of Africa Automation as a Service Market Estimates And Forecasts, By Component (2020-2032) (USD Billion)

12.5.2.10.2 Rest Of Africa Automation as a Service Market Estimates And Forecasts, By End User (2020-2032) (USD Billion)

12.5.2.10.3 Rest Of Africa Automation as a Service Market Estimates And Forecasts, By Deployment Model (2020-2032) (USD Billion)

12.5.2.10.4 Rest Of Africa Automation as a Service Market Estimates And Forecasts, By Type (2020-2032) (USD Billion)

12.5.2.10.5 Rest Of Africa Automation as a Service Market Estimates And Forecasts, By Organization Size (2020-2032) (USD Billion)

12.6 Latin America

12.6.1 Trends Analysis

12.6.2 Latin America Automation as a Service Market Estimates And Forecasts, By Country (2020-2032) (USD Billion)

12.6.3 Latin America Automation as a Service Market Estimates And Forecasts, By Component (2020-2032) (USD Billion)

12.6.4 Latin America Automation as a Service Market Estimates And Forecasts, By End User (2020-2032) (USD Billion)

12.6.5 Latin America Automation as a Service Market Estimates And Forecasts, By Deployment Model (2020-2032) (USD Billion)

12.6.6 Latin America Automation as a Service Market Estimates And Forecasts, By Type (2020-2032) (USD Billion)

12.6.7 Latin America Automation as a Service Market Estimates And Forecasts, By Organization Size (2020-2032) (USD Billion)

12.6.8 Brazil

12.6.8.1 Brazil Automation as a Service Market Estimates And Forecasts, By Component (2020-2032) (USD Billion)

12.6.8.2 Brazil Automation as a Service Market Estimates And Forecasts, By End User (2020-2032) (USD Billion)

12.6.8.3 Brazil Automation as a Service Market Estimates And Forecasts, By Deployment Model (2020-2032) (USD Billion)

12.6.8.4 Brazil Automation as a Service Market Estimates And Forecasts, By Type (2020-2032) (USD Billion)

12.6.8.5 Brazil Automation as a Service Market Estimates And Forecasts, By Organization Size (2020-2032) (USD Billion)

12.6.9 Argentina

12.6.9.1 Argentina Automation as a Service Market Estimates And Forecasts, By Component (2020-2032) (USD Billion)

12.6.9.2 Argentina Automation as a Service Market Estimates And Forecasts, By End User (2020-2032) (USD Billion)

12.6.9.3 Argentina Automation as a Service Market Estimates And Forecasts, By Deployment Model (2020-2032) (USD Billion)

12.6.9.4 Argentina Automation as a Service Market Estimates And Forecasts, By Type (2020-2032) (USD Billion)

12.6.9.5 Argentina Automation as a Service Market Estimates And Forecasts, By Organization Size (2020-2032) (USD Billion)

12.6.10 Colombia

12.6.10.1 Colombia Automation as a Service Market Estimates And Forecasts, By Component (2020-2032) (USD Billion)

12.6.10.2 Colombia Automation as a Service Market Estimates And Forecasts, By End User (2020-2032) (USD Billion)

12.6.10.3 Colombia Automation as a Service Market Estimates And Forecasts, By Deployment Model (2020-2032) (USD Billion)

12.6.10.4 Colombia Automation as a Service Market Estimates And Forecasts, By Type (2020-2032) (USD Billion)

12.6.10.5 Colombia Automation as a Service Market Estimates And Forecasts, By Organization Size (2020-2032) (USD Billion)

12.6.11 Rest Of Latin America

12.6.11.1 Rest Of Latin America Automation as a Service Market Estimates And Forecasts, By Component (2020-2032) (USD Billion)

12.6.11.2 Rest Of Latin America Automation as a Service Market Estimates And Forecasts, By End User (2020-2032) (USD Billion)

12.6.11.3 Rest Of Latin America Automation as a Service Market Estimates And Forecasts, By Deployment Model (2020-2032) (USD Billion)

12.6.11.4 Rest Of Latin America Automation as a Service Market Estimates And Forecasts, By Type (2020-2032) (USD Billion)

12.6.11.5 Rest Of Latin America Automation as a Service Market Estimates And Forecasts, By Organization Size (2020-2032) (USD Billion)

13. Company Profiles

13.1 Amazon Web Services (AWS)

13.1.1 Company Overview

13.1.2 Financial

13.1.3 Products/ Services Offered

13.1.4 SWOT Analysis

13.2 Google LLC

13.2.1 Company Overview

13.2.2 Financial

13.2.3 Products/ Services Offered

13.2.4 SWOT Analysis

13.3 SAP SE

13.3.1 Company Overview

13.3.2 Financial

13.3.3 Products/ Services Offered

13.3.4 SWOT Analysis

13.4 Oracle Corporation

13.4.1 Company Overview

13.4.2 Financial

13.4.3 Products/ Services Offered

13.4.4 SWOT Analysis

13.5 Accenture

13.5.1 Company Overview

13.5.2 Financial

13.5.3 Products/ Services Offered

13.5.4 SWOT Analysis

13.6 AutomationEdge

13.6.1 Company Overview

13.6.2 Financial

13.6.3 Products/ Services Offered

13.6.4 SWOT Analysis

13.7 WorkFusion

13.7.1 Company Overview

13.7.2 Financial

13.7.3 Products/ Services Offered

13.7.4 SWOT Analysis

13.8 Cognizant Technology Solutions

13.8.1 Company Overview

13.8.2 Financial

13.8.3 Products/ Services Offered

13.8.4 SWOT Analysis

13.9 ServiceNow

13.9.1 Company Overview

13.9.2 Financial

13.9.3 Products/ Services Offered

13.9.4 SWOT Analysis

13.10 Digital Workforce

13.10.1 Company Overview

13.10.2 Financial

13.10.3 Products/ Services Offered

13.10.4 SWOT Analysis

14. Use Cases and Best Practices

15. Conclusion

An accurate research report requires proper strategizing as well as implementation. There are multiple factors involved in the completion of good and accurate research report and selecting the best methodology to compete the research is the toughest part. Since the research reports we provide play a crucial role in any company’s decision-making process, therefore we at SNS Insider always believe that we should choose the best method which gives us results closer to reality. This allows us to reach at a stage wherein we can provide our clients best and accurate investment to output ratio.

Each report that we prepare takes a timeframe of 350-400 business hours for production. Starting from the selection of titles through a couple of in-depth brain storming session to the final QC process before uploading our titles on our website we dedicate around 350 working hours. The titles are selected based on their current market cap and the foreseen CAGR and growth.


The 5 steps process:

Step 1: Secondary Research:

Secondary Research or Desk Research is as the name suggests is a research process wherein, we collect data through the readily available information. In this process we use various paid and unpaid databases which our team has access to and gather data through the same. This includes examining of listed companies’ annual reports, Journals, SEC filling etc. Apart from this our team has access to various associations across the globe across different industries. Lastly, we have exchange relationships with various university as well as individual libraries.

Secondary Research

Step 2: Primary Research

When we talk about primary research, it is a type of study in which the researchers collect relevant data samples directly, rather than relying on previously collected data.  This type of research is focused on gaining content specific facts that can be sued to solve specific problems. Since the collected data is fresh and first hand therefore it makes the study more accurate and genuine.

We at SNS Insider have divided Primary Research into 2 parts.

Part 1 wherein we interview the KOLs of major players as well as the upcoming ones across various geographic regions. This allows us to have their view over the market scenario and acts as an important tool to come closer to the accurate market numbers. As many as 45 paid and unpaid primary interviews are taken from both the demand and supply side of the industry to make sure we land at an accurate judgement and analysis of the market.

This step involves the triangulation of data wherein our team analyses the interview transcripts, online survey responses and observation of on filed participants. The below mentioned chart should give a better understanding of the part 1 of the primary interview.

Primary Research

Part 2: In this part of primary research the data collected via secondary research and the part 1 of the primary research is validated with the interviews from individual consultants and subject matter experts.

Consultants are those set of people who have at least 12 years of experience and expertise within the industry whereas Subject Matter Experts are those with at least 15 years of experience behind their back within the same space. The data with the help of two main processes i.e., FGDs (Focused Group Discussions) and IDs (Individual Discussions). This gives us a 3rd party nonbiased primary view of the market scenario making it a more dependable one while collation of the data pointers.

Step 3: Data Bank Validation

Once all the information is collected via primary and secondary sources, we run that information for data validation. At our intelligence centre our research heads track a lot of information related to the market which includes the quarterly reports, the daily stock prices, and other relevant information. Our data bank server gets updated every fortnight and that is how the information which we collected using our primary and secondary information is revalidated in real time.

Data Bank Validation

Step 4: QA/QC Process

After all the data collection and validation our team does a final level of quality check and quality assurance to get rid of any unwanted or undesired mistakes. This might include but not limited to getting rid of the any typos, duplication of numbers or missing of any important information. The people involved in this process include technical content writers, research heads and graphics people. Once this process is completed the title gets uploader on our platform for our clients to read it.

Step 5: Final QC/QA Process:

This is the last process and comes when the client has ordered the study. In this process a final QA/QC is done before the study is emailed to the client. Since we believe in giving our clients a good experience of our research studies, therefore, to make sure that we do not lack at our end in any way humanly possible we do a final round of quality check and then dispatch the study to the client.

Key Segments:

By Component

  • Solution

  • Services

By Type

  • Rule-based Automation

  • Knowledge-based Automation

By Deployment Model

  • Public Cloud

  • Private Cloud

  • Hybrid Cloud

By Organization Size

  • Small and Medium-sized Enterprises (SMEs)

  • Large Enterprises

By End User

  • BFSI

  • Telecom and IT

  • Retail and Consumer Goods

  • Healthcare and Life Sciences

  • Manufacturing

  • Other End-user Industries

Request for Segment Customization as per your Business Requirement: Segment Customization Request

Regional Coverage:

North America

  • US

  • Canada

  • Mexico

Europe

  • Eastern Europe

    • Poland

    • Romania

    • Hungary

    • Turkey

    • Rest of Eastern Europe

  • Western Europe

    • Germany

    • France

    • UK

    • Italy

    • Spain

    • Netherlands

    • Switzerland

    • Austria

    • Rest of Western Europe

Asia Pacific

  • China

  • India

  • Japan

  • South Korea

  • Vietnam

  • Singapore

  • Australia

  • Rest of Asia Pacific

Middle East & Africa

  • Middle East

    • UAE

    • Egypt

    • Saudi Arabia

    • Qatar

    • Rest of Middle East

  • Africa

    • Nigeria

    • South Africa

    • Rest of Africa

Latin America

  • Brazil

  • Argentina

  • Colombia

  • Rest of Latin America

Request for Country Level Research Report: Country Level Customization Request

Available Customization

With the given market data, SNS Insider offers customization as per the company’s specific needs. The following customization options are available for the report:

  • Detailed Volume Analysis

  • Criss-Cross segment analysis (e.g. Product X Application)

  • Competitive Product Benchmarking

  • Geographic Analysis

  • Additional countries in any of the regions

  • Customized Data Representation

  • Detailed analysis and profiling of additional market players


  •            5000 (33% Discount)


  •            8950 (40% Discount)


  •            3050 (23% Discount)

Start a Conversation

Hi! Click one of our member below to chat on Phone