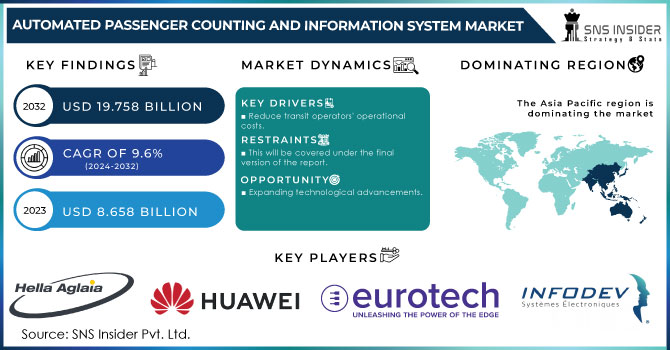
The Automated Passenger Counting and Information System Market Size was valued at USD 7.98 Billion in 2023 and is expected to reach USD 18.21 Billion by 2032 and grow at a CAGR of 9.7% over the forecast period 2024-2032. The market is driven by technological advancements, including the adoption of AI, machine learning, and IoT for enhanced passenger flow analytics and real-time data processing. Evolving sensor technologies like infrared, stereoscopic vision, and time-of-flight sensors are improving accuracy. Deployment trends show increased use across buses, trains, ferries, and airports, with a growing preference for cloud-based systems for scalability. Regulatory compliance, including GDPR, KYC, and AML, influences market dynamics. Additionally, the adoption of energy-efficient systems and sustainability initiatives is fueling market growth, reflecting a shift toward smarter, greener public transport.
Get more information on Automated Passenger Counting and Information System Market - Request Sample Report
Driver:
Increasing Demand for Real-Time Passenger Data Analytics and Smart Transport Solutions Boosts the Automated Passenger Counting and Information System Market Growth
The growing need for real-time passenger flow data analytics and smart transport solutions is significantly driving the growth of the Automated Passenger Counting and Information System (APCIS) market. Public transport agencies and operators seek systems that enable accurate, real-time monitoring of passenger numbers to optimize service delivery and operational efficiency. With rising urbanization and congestion, the demand for intelligent transport systems that leverage data to improve customer experiences, reduce costs, and manage traffic flow efficiently has amplified. APCIS technologies, such as AI-driven analytics and IoT-based sensors, are key to meeting this demand and facilitating smoother, more effective transportation networks.
Restraint:
High Initial Costs and Maintenance Expenses Associated with Automated Passenger Counting and Information Systems Limiting Market Growth Potential
Despite the advantages, the high initial investment and ongoing maintenance costs for Automated Passenger Counting and Information Systems (APCIS) present a significant restraint to market expansion. Many transportation agencies, especially in developing regions, face budget constraints that hinder their ability to implement advanced technologies like automated counting sensors and data management platforms. These systems often require substantial capital for deployment, as well as skilled personnel for operation and upkeep, making it a financial burden for smaller organizations. This financial limitation reduces the adoption rate, especially in less economically developed areas.
Opportunity:
Rising Adoption of Cloud-Based Solutions and IoT-Enabled Passenger Management Systems Creates Opportunities for Market Expansion
The growing adoption of cloud-based solutions and IoT-enabled passenger management systems presents a significant opportunity for the Automated Passenger Counting and Information System (APCIS) market. Cloud computing allows for more cost-effective data storage, real-time access, and scalable solutions, making it easier for public transportation agencies to adopt and integrate APCIS technologies. Furthermore, IoT-based systems facilitate better data collection and sharing between devices, improving operational efficiency. With increased investment in smart cities and public transport infrastructure, these technological advancements offer the potential to revolutionize the industry, leading to broader market adoption and expansion.
Challenge:
Data Privacy and Security Concerns in Handling Passenger Data Limit Widespread Adoption of Automated Passenger Counting Systems
A major challenge hindering the widespread adoption of Automated Passenger Counting and Information Systems (APCIS) is the growing concern over data privacy and security. With the increasing use of IoT and AI-powered technologies, the collection and storage of sensitive passenger data raises concerns about data breaches and unauthorized access. Stringent regulations, such as GDPR, require organizations to ensure compliance with data protection laws, making it challenging for many public transport operators to implement these systems without facing legal and security risks. Addressing these concerns is crucial for ensuring broader trust and acceptance of APCIS technologies.
By Type
In 2023, the Passenger Information Systems (PIS) segment led the market with a substantial 47% share, driven by increasing demand for real-time travel updates, better customer experiences, and efficient fleet management in the transportation industry.
For instance, Siemens unveiled a new digital platform that integrates predictive analytics for better passenger flow management. These developments align with the rise of Automated Passenger Counting (APC) and Information Systems, as both segments share a common goal of improving operational efficiency and enhancing passenger experience.
The Automated Passenger Counting Systems segment is growing at the highest CAGR of 10.45% within the forecast period, reflecting increasing investments in advanced tracking and monitoring technologies.
For example, Infodev Electronic Designers introduced a highly accurate, sensor-based APC solution that uses infrared sensors for precise data collection in real-time, offering seamless integration with transit systems. The demand for APC systems is fueled by a broader trend in the transportation industry towards data-driven decision-making and operational efficiency.
By Technology
In 2023, the Infrared technology segment captured the largest revenue share of 44%, driven by its reliability and accuracy in automated passenger counting systems. Infrared sensors are widely used for detecting the presence of passengers by measuring changes in infrared light as people move through entryways. Leading companies such as Infodev Electronic Designers and Vix Technology have made significant strides in this area by developing advanced infrared-based Automated Passenger Counting (APC) systems that ensure precision even in low-light or challenging environmental conditions.
The Stereoscopic Vision technology segment is witnessing the highest CAGR of 10.39% within the forecasted period, due to its advanced capabilities in depth perception and three-dimensional imaging. Companies such as Xovis and Eurotech are at the forefront of stereoscopic vision technology in passenger counting systems. Xovis recently introduced a 3D stereoscopic vision-based APC system that enhances the accuracy of passenger counting by capturing detailed images of passengers in motion, even in crowded environments.
By Application
In 2023, the Railways segment led the market with a 37% share, driven by increasing investments in advanced technology for efficient operations, passenger safety, and enhanced travel experiences. The integration of APC and PIS is particularly beneficial in the railway sector, as it enables train operators to track passenger numbers, optimize seating capacity, and manage schedules more effectively. The demand for advanced counting and information systems in railways is therefore aligned with the Automated Passenger Counting and Information System market, which is rapidly growing as rail operators seek more efficient and passenger-friendly solutions.
The Buses segment is expected to grow at the highest CAGR of 10.15% during the forecast period, reflecting the increasing demand for smart, data-driven solutions to enhance bus operations and passenger experiences.
For example, Vix Technology recently unveiled a new bus passenger counting system that utilizes infrared sensors and stereoscopic vision to improve accuracy and reliability in real-time passenger data collection. These systems help bus operators manage schedules better, optimize routes, and provide timely passenger updates.
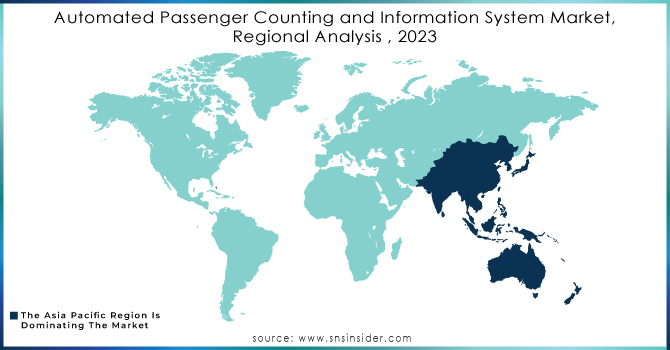
In 2023, North America dominated the Automated Passenger Counting and Information System market, holding a significant market share of approximately 40%. This dominance can be attributed to the strong infrastructure and technological advancements in transportation systems within the region. Countries like the United States and Canada are at the forefront of adopting smart transportation solutions, with major cities investing in advanced transit technologies to improve efficiency and passenger experience.
For example, New York City's Metropolitan Transportation Authority (MTA) has integrated advanced passenger counting and real-time information systems in its subway and bus networks, contributing to the region's market share.
The Asia Pacific region is the fastest-growing region in the Automated Passenger Counting and Information System market, with an estimated CAGR of 12.5% during the forecast period. This rapid growth is primarily driven by urbanization, increasing investments in transportation infrastructure, and a growing demand for more efficient public transit systems.
For instance, China's high-speed rail network has implemented integrated APC and PIS systems, provided real-time updates and improving operational efficiency. The fast adoption of these technologies is further supported by government initiatives promoting smart city development, making the region a key player in the global market's expansion.
Get Customized Report as per your Business Requirement - Request For Customized Report
Some of the major players in the Automated Passenger Counting and Information System Market are:
Eurotech (IRMA, EDGE AI Platform)
Iris-GmbH (IRMA 6 R2 Sensor, HYDRA IP Video Surveillance System)
DILAX Intelcom GmbH (DILAX APC System, DILAX DataHub)
HELLA Agalia Mobile Vision (Agalia Intelligent Camera Systems, Agalia Display System)
Infodev EDI (Passenger Counting System, EDI-Locator)
Siemens (Siemens Mobility Passenger Information System, Sitraffic)
Hitachi (Hitachi Passenger Counting System, Hitachi IoT-enabled Sensors)
ACOREL SAS (ACOREL Passenger Counting System, ACOREL Smart Displays)
Advantech Co., Ltd. (Advantech APC Solution, Advantech IoT Gateways)
BlueSurge Technologies (BlueSurge Passenger Information System, BlueSurge Smart Sensors)
Cisco Systems, Inc. (Cisco Connected Transport Solutions, Cisco Meraki Cameras)
Clever Devices Ltd. (Clever APC System, Clever Transit Management System)
Exeros Technologies Ltd. (Exeros APC Sensors, Exeros Data Analytics Platform)
EYERIDE (EYERIDE Passenger Monitoring System, EYERIDE Smart Sensors)
Giken Trastem Co., Ltd. (Giken APC System, Giken Data Management Platform)
GMV Syncromatics (Syncromatics APC System, Syncromatics Data Hub)
In November 2023, at the APTA EXPO 2023, iris-GMBH introduced the IRMA 6 R2 sensor generation and also launched the HYDRA IP video surveillance system, showcasing advanced technology in passenger monitoring and security solutions.
In July 2024, Siemens Mobility successfully secured four contracts valued at USD 690.5 million with HS2 Ltd, focusing on vital infrastructure and long-term maintenance, marking a major step forward in rail transport development.
In September 2024, DILAX joined the INIT Group, strengthening its expertise in automatic passenger counting technologies.
Report Attributes | Details |
---|---|
Market Size in 2023 | US$ 7.98 Billion |
Market Size by 2032 | US$ 18.21 Billion |
CAGR | CAGR of 9.7 % From 2024 to 2032 |
Base Year | 2023 |
Forecast Period | 2024-2032 |
Historical Data | 2020-2022 |
Report Scope & Coverage | Market Size, Segments Analysis, Competitive Landscape, Regional Analysis, DROC & SWOT Analysis, Forecast Outlook |
Key Segments | • By System Type (Automated Passenger Counting Systems, Passenger Information Systems, Display Systems, Announcement and Emergency Communication Systems, Infotainment Systems, Mobile Applications) • By Technology Type (Infrared, Stereoscopic Vision, Time of Flight, Others) • By Application Type (Buses, Trains and Trams, Ferries, Railways, Roadways, Airways) |
Regional Analysis/Coverage | North America (US, Canada, Mexico), Europe (Eastern Europe [Poland, Romania, Hungary, Turkey, Rest of Eastern Europe] Western Europe] Germany, France, UK, Italy, Spain, Netherlands, Switzerland, Austria, Rest of Western Europe]), Asia Pacific (China, India, Japan, South Korea, Vietnam, Singapore, Australia, Rest of Asia Pacific), Middle East & Africa (Middle East [UAE, Egypt, Saudi Arabia, Qatar, Rest of Middle East], Africa [Nigeria, South Africa, Rest of Africa], Latin America (Brazil, Argentina, Colombia, Rest of Latin America) |
Company Profiles | Eurotech, Iris-GmbH, DILAX Intelcom GmbH, HELLA Agalia Mobile Vision, Infodev EDI, Siemens, Hitachi, ACOREL SAS, Advantech Co., Ltd., BlueSurge Technologies, Cisco Systems, Inc., Clever Devices Ltd., Exeros Technologies Ltd., EYERIDE, Giken Trastem Co., Ltd., GMV Syncromatics |
Ans: The Automated Passenger Counting and Information System Market is expected to grow at a CAGR of 9.7% during 2024-2032.
Ans: The Automated Passenger Counting and Information System Market size was USD 7.98 billion in 2023 and is expected to Reach USD 18.21 billion by 2032.
Ans: The major growth factor of the Automated Passenger Counting and Information System market is the increasing demand for efficient, data-driven solutions to improve operational efficiency, reduce costs, and enhance the passenger experience in public transportation.
Ans: The passenger Information Systems segment dominated the Automated Passenger Counting and Information System Market.
Ans: North America dominated the Automated Passenger Counting and Information System Market in 2023.
Table Of Contents
1. Introduction
1.1 Market Definition
1.2 Scope (Inclusion and Exclusions)
1.3 Research Assumptions
2. Executive Summary
2.1 Market Overview
2.2 Regional Synopsis
2.3 Competitive Summary
3. Research Methodology
3.1 Top-Down Approach
3.2 Bottom-up Approach
3.3. Data Validation
3.4 Primary Interviews
4. Market Dynamics Impact Analysis
4.1 Market Driving Factors Analysis
4.1.1 Drivers
4.1.2 Restraints
4.1.3 Opportunities
4.1.4 Challenges
4.2 PESTLE Analysis
4.3 Porter’s Five Forces Model
5. Statistical Insights and Trends Reporting
5.1 System Accuracy and Efficiency Improvements (2023)
5.2 Revenue Contribution
5.3 Investment Trends (2023)
5.4 Government Initiatives
6. Competitive Landscape
6.1 List of Major Companies, By Region
6.2 Market Share Analysis, By Region
6.3 Product Benchmarking
6.3.1 Product specifications and features
6.3.2 Pricing
6.4 Strategic Initiatives
6.4.1 Marketing and promotional activities
6.4.2 Distribution and Supply Chain Strategies
6.4.3 Expansion plans and new product launches
6.4.4 Strategic partnerships and collaborations
6.5 Technological Advancements
6.6 Market Positioning and Branding
7. Automated Passenger Counting and Information System Market Segmentation, By Type
7.1 Chapter Overview
7.2 Automated Passenger Counting Systems
7.2.1 Automated Passenger Counting Systems Market Trends Analysis (2020-2032)
7.2.2 Automated Passenger Counting Systems Market Size Estimates and Forecasts to 2032 (USD Billion)
7.3 Passenger Information Systems
7.3.1 Passenger Information Systems Market Trends Analysis (2020-2032)
7.3.2 Passenger Information Systems Market Size Estimates and Forecasts to 2032 (USD Billion)
7.4 Display Systems
7.4.1 Display Systems Market Trends Analysis (2020-2032)
7.4.2 Display Systems Market Size Estimates and Forecasts to 2032 (USD Billion)
7.5 Announcement and Emergency Communication Systems
7.5.1 Announcement and Emergency Communication Systems Market Trends Analysis (2020-2032)
7.5.2 Announcement and Emergency Communication Systems Market Size Estimates and Forecasts to 2032 (USD Billion)
7.6 Infotainment Systems
7.6.1 Infotainment Systems Market Trends Analysis (2020-2032)
7.6.2 Infotainment Systems Market Size Estimates and Forecasts to 2032 (USD Billion)
7.7 Mobile Applications
7.7.1 Mobile Applications Market Trends Analysis (2020-2032)
7.7.2 Mobile Applications Market Size Estimates and Forecasts to 2032 (USD Billion)
8. Automated Passenger Counting and Information System Market Segmentation, By Application
8.1 Chapter Overview
8.2 Buses
8.2.1 Buses Market Trends Analysis (2020-2032)
8.2.2 Buses Market Size Estimates and Forecasts to 2032 (USD Billion)
8.3 Trains and Trams
8.3.1 Trains and Trams Market Trends Analysis (2020-2032)
8.3.2 Trains and Trams Market Size Estimates and Forecasts to 2032 (USD Billion)
8.4 Ferries
8.4.1 Ferries Market Trends Analysis (2020-2032)
8.4.2 Ferries Market Size Estimates and Forecasts to 2032 (USD Billion)
8.5 Railways
8.5.1 Railways Market Trends Analysis (2020-2032)
8.5.2 Railways Market Size Estimates and Forecasts to 2032 (USD Billion)
8.6 Roadways
8.6.1 Roadways Market Trends Analysis (2020-2032)
8.6.2 Roadways Market Size Estimates and Forecasts to 2032 (USD Billion)
8.7 Airways
8.7.1 Airways Market Trends Analysis (2020-2032)
8.7.2 Airways Market Size Estimates and Forecasts to 2032 (USD Billion)
9. Automated Passenger Counting and Information System Market Segmentation, By Technology
9.1 Chapter Overview
9.2 Infrared
9.2.1 Infrared Market Trends Analysis (2020-2032)
9.2.2 Infrared Market Size Estimates and Forecasts to 2032 (USD Billion)
9.3 Stereoscopic vision
9.3.1 Stereoscopic vision Market Trends Analysis (2020-2032)
9.3.2 Stereoscopic vision Market Size Estimates and Forecasts to 2032 (USD Billion)
9.4 Time of Flight
9.4.1 Time of Flight Market Trends Analysis (2020-2032)
9.4.2 Time of Flight Market Size Estimates and Forecasts to 2032 (USD Billion)
9.5 Others
9.5.1 Others Market Trends Analysis (2020-2032)
9.5.2 Others Market Size Estimates and Forecasts to 2032 (USD Billion)
10. Regional Analysis
10.1 Chapter Overview
10.2 North America
10.2.1 Trends Analysis
10.2.2 North America Automated Passenger Counting and Information System Market Estimates and Forecasts, by Country (2020-2032) (USD Billion)
10.2.3 North America Automated Passenger Counting and Information System Market Estimates and Forecasts, By Type (2020-2032) (USD Billion)
10.2.4 North America Automated Passenger Counting and Information System Market Estimates and Forecasts, By Application (2020-2032) (USD Billion)
10.2.5 North America Automated Passenger Counting and Information System Market Estimates and Forecasts, By Technology (2020-2032) (USD Billion)
10.2.6 USA
10.2.6.1 USA Automated Passenger Counting and Information System Market Estimates and Forecasts, By Type (2020-2032) (USD Billion)
10.2.6.2 USA Automated Passenger Counting and Information System Market Estimates and Forecasts, By Application (2020-2032) (USD Billion)
10.2.6.3 USA Automated Passenger Counting and Information System Market Estimates and Forecasts, By Technology (2020-2032) (USD Billion)
10.2.7 Canada
10.2.7.1 Canada Automated Passenger Counting and Information System Market Estimates and Forecasts, By Type (2020-2032) (USD Billion)
10.2.7.2 Canada Automated Passenger Counting and Information System Market Estimates and Forecasts, By Application (2020-2032) (USD Billion)
10.2.7.3 Canada Automated Passenger Counting and Information System Market Estimates and Forecasts, By Technology (2020-2032) (USD Billion)
10.2.8 Mexico
10.2.8.1 Mexico Automated Passenger Counting and Information System Market Estimates and Forecasts, By Type (2020-2032) (USD Billion)
10.2.8.2 Mexico Automated Passenger Counting and Information System Market Estimates and Forecasts, By Application (2020-2032) (USD Billion)
10.2.8.3 Mexico Automated Passenger Counting and Information System Market Estimates and Forecasts, By Technology (2020-2032) (USD Billion)
10.3 Europe
10.3.1 Eastern Europe
10.3.1.1 Trends Analysis
10.3.1.2 Eastern Europe Automated Passenger Counting and Information System Market Estimates and Forecasts, by Country (2020-2032) (USD Billion)
10.3.1.3 Eastern Europe Automated Passenger Counting and Information System Market Estimates and Forecasts, By Type (2020-2032) (USD Billion)
10.3.1.4 Eastern Europe Automated Passenger Counting and Information System Market Estimates and Forecasts, By Application (2020-2032) (USD Billion)
10.3.1.5 Eastern Europe Automated Passenger Counting and Information System Market Estimates and Forecasts, By Technology (2020-2032) (USD Billion)
10.3.1.6 Poland
10.3.1.6.1 Poland Automated Passenger Counting and Information System Market Estimates and Forecasts, By Type (2020-2032) (USD Billion)
10.3.1.6.2 Poland Automated Passenger Counting and Information System Market Estimates and Forecasts, By Application (2020-2032) (USD Billion)
10.3.1.6.3 Poland Automated Passenger Counting and Information System Market Estimates and Forecasts, By Technology (2020-2032) (USD Billion)
10.3.1.7 Romania
10.3.1.7.1 Romania Automated Passenger Counting and Information System Market Estimates and Forecasts, By Type (2020-2032) (USD Billion)
10.3.1.7.2 Romania Automated Passenger Counting and Information System Market Estimates and Forecasts, By Application (2020-2032) (USD Billion)
10.3.1.7.3 Romania Automated Passenger Counting and Information System Market Estimates and Forecasts, By Technology (2020-2032) (USD Billion)
10.3.1.8 Hungary
10.3.1.8.1 Hungary Automated Passenger Counting and Information System Market Estimates and Forecasts, By Type (2020-2032) (USD Billion)
10.3.1.8.2 Hungary Automated Passenger Counting and Information System Market Estimates and Forecasts, By Application (2020-2032) (USD Billion)
10.3.1.8.3 Hungary Automated Passenger Counting and Information System Market Estimates and Forecasts, By Technology (2020-2032) (USD Billion)
10.3.1.9 Turkey
10.3.1.9.1 Turkey Automated Passenger Counting and Information System Market Estimates and Forecasts, By Type (2020-2032) (USD Billion)
10.3.1.9.2 Turkey Automated Passenger Counting and Information System Market Estimates and Forecasts, By Application (2020-2032) (USD Billion)
10.3.1.9.3 Turkey Automated Passenger Counting and Information System Market Estimates and Forecasts, By Technology (2020-2032) (USD Billion)
10.3.1.10 Rest of Eastern Europe
10.3.1.10.1 Rest of Eastern Europe Automated Passenger Counting and Information System Market Estimates and Forecasts, By Type (2020-2032) (USD Billion)
10.3.1.10.2 Rest of Eastern Europe Automated Passenger Counting and Information System Market Estimates and Forecasts, By Application (2020-2032) (USD Billion)
10.3.1.10.3 Rest of Eastern Europe Automated Passenger Counting and Information System Market Estimates and Forecasts, By Technology (2020-2032) (USD Billion)
10.3.2 Western Europe
10.3.2.1 Trends Analysis
10.3.2.2 Western Europe Automated Passenger Counting and Information System Market Estimates and Forecasts, by Country (2020-2032) (USD Billion)
10.3.2.3 Western Europe Automated Passenger Counting and Information System Market Estimates and Forecasts, By Type (2020-2032) (USD Billion)
10.3.2.4 Western Europe Automated Passenger Counting and Information System Market Estimates and Forecasts, By Application (2020-2032) (USD Billion)
10.3.2.5 Western Europe Automated Passenger Counting and Information System Market Estimates and Forecasts, By Technology (2020-2032) (USD Billion)
10.3.2.6 Germany
10.3.2.6.1 Germany Automated Passenger Counting and Information System Market Estimates and Forecasts, By Type (2020-2032) (USD Billion)
10.3.2.6.2 Germany Automated Passenger Counting and Information System Market Estimates and Forecasts, By Application (2020-2032) (USD Billion)
10.3.2.6.3 Germany Automated Passenger Counting and Information System Market Estimates and Forecasts, By Technology (2020-2032) (USD Billion)
10.3.2.7 France
10.3.2.7.1 France Automated Passenger Counting and Information System Market Estimates and Forecasts, By Type (2020-2032) (USD Billion)
10.3.2.7.2 France Automated Passenger Counting and Information System Market Estimates and Forecasts, By Application (2020-2032) (USD Billion)
10.3.2.7.3 France Automated Passenger Counting and Information System Market Estimates and Forecasts, By Technology (2020-2032) (USD Billion)
10.3.2.8 UK
10.3.2.8.1 UK Automated Passenger Counting and Information System Market Estimates and Forecasts, By Type (2020-2032) (USD Billion)
10.3.2.8.2 UK Automated Passenger Counting and Information System Market Estimates and Forecasts, By Application (2020-2032) (USD Billion)
10.3.2.8.3 UK Automated Passenger Counting and Information System Market Estimates and Forecasts, By Technology (2020-2032) (USD Billion)
10.3.2.9 Italy
10.3.2.9.1 Italy Automated Passenger Counting and Information System Market Estimates and Forecasts, By Type (2020-2032) (USD Billion)
10.3.2.9.2 Italy Automated Passenger Counting and Information System Market Estimates and Forecasts, By Application (2020-2032) (USD Billion)
10.3.2.9.3 Italy Automated Passenger Counting and Information System Market Estimates and Forecasts, By Technology (2020-2032) (USD Billion)
10.3.2.10 Spain
10.3.2.10.1 Spain Automated Passenger Counting and Information System Market Estimates and Forecasts, By Type (2020-2032) (USD Billion)
10.3.2.10.2 Spain Automated Passenger Counting and Information System Market Estimates and Forecasts, By Application (2020-2032) (USD Billion)
10.3.2.10.3 Spain Automated Passenger Counting and Information System Market Estimates and Forecasts, By Technology (2020-2032) (USD Billion)
10.3.2.11 Netherlands
10.3.2.11.1 Netherlands Automated Passenger Counting and Information System Market Estimates and Forecasts, By Type (2020-2032) (USD Billion)
10.3.2.11.2 Netherlands Automated Passenger Counting and Information System Market Estimates and Forecasts, By Application (2020-2032) (USD Billion)
10.3.2.11.3 Netherlands Automated Passenger Counting and Information System Market Estimates and Forecasts, By Technology (2020-2032) (USD Billion)
10.3.2.12 Switzerland
10.3.2.12.1 Switzerland Automated Passenger Counting and Information System Market Estimates and Forecasts, By Type (2020-2032) (USD Billion)
10.3.2.12.2 Switzerland Automated Passenger Counting and Information System Market Estimates and Forecasts, By Application (2020-2032) (USD Billion)
10.3.2.12.3 Switzerland Automated Passenger Counting and Information System Market Estimates and Forecasts, By Technology (2020-2032) (USD Billion)
10.3.2.13 Austria
10.3.2.13.1 Austria Automated Passenger Counting and Information System Market Estimates and Forecasts, By Type (2020-2032) (USD Billion)
10.3.2.13.2 Austria Automated Passenger Counting and Information System Market Estimates and Forecasts, By Application (2020-2032) (USD Billion)
10.3.2.13.3 Austria Automated Passenger Counting and Information System Market Estimates and Forecasts, By Technology (2020-2032) (USD Billion)
10.3.2.14 Rest of Western Europe
10.3.2.14.1 Rest of Western Europe Automated Passenger Counting and Information System Market Estimates and Forecasts, By Type (2020-2032) (USD Billion)
10.3.2.14.2 Rest of Western Europe Automated Passenger Counting and Information System Market Estimates and Forecasts, By Application (2020-2032) (USD Billion)
10.3.2.14.3 Rest of Western Europe Automated Passenger Counting and Information System Market Estimates and Forecasts, By Technology (2020-2032) (USD Billion)
10.4 Asia Pacific
10.4.1 Trends Analysis
10.4.2 Asia Pacific Automated Passenger Counting and Information System Market Estimates and Forecasts, by Country (2020-2032) (USD Billion)
10.4.3 Asia Pacific Automated Passenger Counting and Information System Market Estimates and Forecasts, By Type (2020-2032) (USD Billion)
10.4.4 Asia Pacific Automated Passenger Counting and Information System Market Estimates and Forecasts, By Application (2020-2032) (USD Billion)
10.4.5 Asia Pacific Automated Passenger Counting and Information System Market Estimates and Forecasts, By Technology (2020-2032) (USD Billion)
10.4.6 China
10.4.6.1 China Automated Passenger Counting and Information System Market Estimates and Forecasts, By Type (2020-2032) (USD Billion)
10.4.6.2 China Automated Passenger Counting and Information System Market Estimates and Forecasts, By Application (2020-2032) (USD Billion)
10.4.6.3 China Automated Passenger Counting and Information System Market Estimates and Forecasts, By Technology (2020-2032) (USD Billion)
10.4.7 India
10.4.7.1 India Automated Passenger Counting and Information System Market Estimates and Forecasts, By Type (2020-2032) (USD Billion)
10.4.7.2 India Automated Passenger Counting and Information System Market Estimates and Forecasts, By Application (2020-2032) (USD Billion)
10.4.7.3 India Automated Passenger Counting and Information System Market Estimates and Forecasts, By Technology (2020-2032) (USD Billion)
10.4.8 Japan
10.4.8.1 Japan Automated Passenger Counting and Information System Market Estimates and Forecasts, By Type (2020-2032) (USD Billion)
10.4.8.2 Japan Automated Passenger Counting and Information System Market Estimates and Forecasts, By Application (2020-2032) (USD Billion)
10.4.8.3 Japan Automated Passenger Counting and Information System Market Estimates and Forecasts, By Technology (2020-2032) (USD Billion)
10.4.9 South Korea
10.4.9.1 South Korea Automated Passenger Counting and Information System Market Estimates and Forecasts, By Type (2020-2032) (USD Billion)
10.4.9.2 South Korea Automated Passenger Counting and Information System Market Estimates and Forecasts, By Application (2020-2032) (USD Billion)
10.4.9.3 South Korea Automated Passenger Counting and Information System Market Estimates and Forecasts, By Technology (2020-2032) (USD Billion)
10.4.10 Vietnam
10.4.10.1 Vietnam Automated Passenger Counting and Information System Market Estimates and Forecasts, By Type (2020-2032) (USD Billion)
10.4.10.2 Vietnam Automated Passenger Counting and Information System Market Estimates and Forecasts, By Application (2020-2032) (USD Billion)
10.4.10.3 Vietnam Automated Passenger Counting and Information System Market Estimates and Forecasts, By Technology (2020-2032) (USD Billion)
10.4.11 Singapore
10.4.11.1 Singapore Automated Passenger Counting and Information System Market Estimates and Forecasts, By Type (2020-2032) (USD Billion)
10.4.11.2 Singapore Automated Passenger Counting and Information System Market Estimates and Forecasts, By Application (2020-2032) (USD Billion)
10.4.11.3 Singapore Automated Passenger Counting and Information System Market Estimates and Forecasts, By Technology (2020-2032) (USD Billion)
10.4.12 Australia
10.4.12.1 Australia Automated Passenger Counting and Information System Market Estimates and Forecasts, By Type (2020-2032) (USD Billion)
10.4.12.2 Australia Automated Passenger Counting and Information System Market Estimates and Forecasts, By Application (2020-2032) (USD Billion)
10.4.12.3 Australia Automated Passenger Counting and Information System Market Estimates and Forecasts, By Technology (2020-2032) (USD Billion)
10.4.13 Rest of Asia Pacific
10.4.13.1 Rest of Asia Pacific Automated Passenger Counting and Information System Market Estimates and Forecasts, By Type (2020-2032) (USD Billion)
10.4.13.2 Rest of Asia Pacific Automated Passenger Counting and Information System Market Estimates and Forecasts, By Application (2020-2032) (USD Billion)
10.4.13.3 Rest of Asia Pacific Automated Passenger Counting and Information System Market Estimates and Forecasts, By Technology (2020-2032) (USD Billion)
10.5 Middle East and Africa
10.5.1 Middle East
10.5.1.1 Trends Analysis
10.5.1.2 Middle East Automated Passenger Counting and Information System Market Estimates and Forecasts, by Country (2020-2032) (USD Billion)
10.5.1.3 Middle East Automated Passenger Counting and Information System Market Estimates and Forecasts, By Type (2020-2032) (USD Billion)
10.5.1.4 Middle East Automated Passenger Counting and Information System Market Estimates and Forecasts, By Application (2020-2032) (USD Billion)
10.5.1.5 Middle East Automated Passenger Counting and Information System Market Estimates and Forecasts, By Technology (2020-2032) (USD Billion)
10.5.1.6 UAE
10.5.1.6.1 UAE Automated Passenger Counting and Information System Market Estimates and Forecasts, By Type (2020-2032) (USD Billion)
10.5.1.6.2 UAE Automated Passenger Counting and Information System Market Estimates and Forecasts, By Application (2020-2032) (USD Billion)
10.5.1.6.3 UAE Automated Passenger Counting and Information System Market Estimates and Forecasts, By Technology (2020-2032) (USD Billion)
10.5.1.7 Egypt
10.5.1.7.1 Egypt Automated Passenger Counting and Information System Market Estimates and Forecasts, By Type (2020-2032) (USD Billion)
10.5.1.7.2 Egypt Automated Passenger Counting and Information System Market Estimates and Forecasts, By Application (2020-2032) (USD Billion)
10.5.1.7.3 Egypt Automated Passenger Counting and Information System Market Estimates and Forecasts, By Technology (2020-2032) (USD Billion)
10.5.1.8 Saudi Arabia
10.5.1.8.1 Saudi Arabia Automated Passenger Counting and Information System Market Estimates and Forecasts, By Type (2020-2032) (USD Billion)
10.5.1.8.2 Saudi Arabia Automated Passenger Counting and Information System Market Estimates and Forecasts, By Application (2020-2032) (USD Billion)
10.5.1.8.3 Saudi Arabia Automated Passenger Counting and Information System Market Estimates and Forecasts, By Technology (2020-2032) (USD Billion)
10.5.1.9 Qatar
10.5.1.9.1 Qatar Automated Passenger Counting and Information System Market Estimates and Forecasts, By Type (2020-2032) (USD Billion)
10.5.1.9.2 Qatar Automated Passenger Counting and Information System Market Estimates and Forecasts, By Application (2020-2032) (USD Billion)
10.5.1.9.3 Qatar Automated Passenger Counting and Information System Market Estimates and Forecasts, By Technology (2020-2032) (USD Billion)
10.5.1.10 Rest of Middle East
10.5.1.10.1 Rest of Middle East Automated Passenger Counting and Information System Market Estimates and Forecasts, By Type (2020-2032) (USD Billion)
10.5.1.10.2 Rest of Middle East Automated Passenger Counting and Information System Market Estimates and Forecasts, By Application (2020-2032) (USD Billion)
10.5.1.10.3 Rest of Middle East Automated Passenger Counting and Information System Market Estimates and Forecasts, By Technology (2020-2032) (USD Billion)
10.5.2 Africa
10.5.2.1 Trends Analysis
10.5.2.2 Africa Automated Passenger Counting and Information System Market Estimates and Forecasts, by Country (2020-2032) (USD Billion)
10.5.2.3 Africa Automated Passenger Counting and Information System Market Estimates and Forecasts, By Type (2020-2032) (USD Billion)
10.5.2.4 Africa Automated Passenger Counting and Information System Market Estimates and Forecasts, By Application (2020-2032) (USD Billion)
10.5.2.5 Africa Automated Passenger Counting and Information System Market Estimates and Forecasts, By Technology (2020-2032) (USD Billion)
10.5.2.6 South Africa
10.5.2.6.1 South Africa Automated Passenger Counting and Information System Market Estimates and Forecasts, By Type (2020-2032) (USD Billion)
10.5.2.6.2 South Africa Automated Passenger Counting and Information System Market Estimates and Forecasts, By Application (2020-2032) (USD Billion)
10.5.2.6.3 South Africa Automated Passenger Counting and Information System Market Estimates and Forecasts, By Technology (2020-2032) (USD Billion)
10.5.2.7 Nigeria
10.5.2.7.1 Nigeria Automated Passenger Counting and Information System Market Estimates and Forecasts, By Type (2020-2032) (USD Billion)
10.5.2.7.2 Nigeria Automated Passenger Counting and Information System Market Estimates and Forecasts, By Application (2020-2032) (USD Billion)
10.5.2.7.3 Nigeria Automated Passenger Counting and Information System Market Estimates and Forecasts, By Technology (2020-2032) (USD Billion)
10.5.2.8 Rest of Africa
10.5.2.8.1 Rest of Africa Automated Passenger Counting and Information System Market Estimates and Forecasts, By Type (2020-2032) (USD Billion)
10.5.2.8.2 Rest of Africa Automated Passenger Counting and Information System Market Estimates and Forecasts, By Application (2020-2032) (USD Billion)
10.5.2.8.3 Rest of Africa Automated Passenger Counting and Information System Market Estimates and Forecasts, By Technology (2020-2032) (USD Billion)
10.6 Latin America
10.6.1 Trends Analysis
10.6.2 Latin America Automated Passenger Counting and Information System Market Estimates and Forecasts, by Country (2020-2032) (USD Billion)
10.6.3 Latin America Automated Passenger Counting and Information System Market Estimates and Forecasts, By Type (2020-2032) (USD Billion)
10.6.4 Latin America Automated Passenger Counting and Information System Market Estimates and Forecasts, By Application (2020-2032) (USD Billion)
10.6.5 Latin America Automated Passenger Counting and Information System Market Estimates and Forecasts, By Technology (2020-2032) (USD Billion)
10.6.6 Brazil
10.6.6.1 Brazil Automated Passenger Counting and Information System Market Estimates and Forecasts, By Type (2020-2032) (USD Billion)
10.6.6.2 Brazil Automated Passenger Counting and Information System Market Estimates and Forecasts, By Application (2020-2032) (USD Billion)
10.6.6.3 Brazil Automated Passenger Counting and Information System Market Estimates and Forecasts, By Technology (2020-2032) (USD Billion)
10.6.7 Argentina
10.6.7.1 Argentina Automated Passenger Counting and Information System Market Estimates and Forecasts, By Type (2020-2032) (USD Billion)
10.6.7.2 Argentina Automated Passenger Counting and Information System Market Estimates and Forecasts, By Application (2020-2032) (USD Billion)
10.6.7.3 Argentina Automated Passenger Counting and Information System Market Estimates and Forecasts, By Technology (2020-2032) (USD Billion)
10.6.8 Colombia
10.6.8.1 Colombia Automated Passenger Counting and Information System Market Estimates and Forecasts, By Type (2020-2032) (USD Billion)
10.6.8.2 Colombia Automated Passenger Counting and Information System Market Estimates and Forecasts, By Application (2020-2032) (USD Billion)
10.6.8.3 Colombia Automated Passenger Counting and Information System Market Estimates and Forecasts, By Technology (2020-2032) (USD Billion)
10.6.9 Rest of Latin America
10.6.9.1 Rest of Latin America Automated Passenger Counting and Information System Market Estimates and Forecasts, By Type (2020-2032) (USD Billion)
10.6.9.2 Rest of Latin America Automated Passenger Counting and Information System Market Estimates and Forecasts, By Application (2020-2032) (USD Billion)
10.6.9.3 Rest of Latin America Automated Passenger Counting and Information System Market Estimates and Forecasts, By Technology (2020-2032) (USD Billion)
11. Company Profiles
11.1 Eurotech
11.1.1 Company Overview
11.1.2 Financial
11.1.3 Products/ Services Offered
11.1.4 SWOT Analysis
11.2 Iris-GmbH
11.2.1 Company Overview
11.2.2 Financial
11.2.3 Products/ Services Offered
11.2.4 SWOT Analysis
11.3 DILAX Intelcom GmbH
11.3.1 Company Overview
11.3.2 Financial
11.3.3 Products/ Services Offered
11.3.4 SWOT Analysis
11.4 HELLA Agalia Mobile Vision
11.4.1 Company Overview
11.4.2 Financial
11.4.3 Products/ Services Offered
11.4.4 SWOT Analysis
11.5 Infodev EDI
11.5.1 Company Overview
11.5.2 Financial
11.5.3 Products/ Services Offered
11.5.4 SWOT Analysis
11.6 Siemens
11.6.1 Company Overview
11.6.2 Financial
11.6.3 Products/ Services Offered
11.6.4 SWOT Analysis
11.7 Hitachi
11.7.1 Company Overview
11.7.2 Financial
11.7.3 Products/ Services Offered
11.7.4 SWOT Analysis
11.8 ACOREL SAS
11.8.1 Company Overview
11.8.2 Financial
11.8.3 Products/ Services Offered
11.8.4 SWOT Analysis
11.9 Advantech Co., Ltd.
11.9.1 Company Overview
11.9.2 Financial
11.9.3 Products/ Services Offered
11.9.4 SWOT Analysis
11.10 BlueSurge Technologies
11.10.1 Company Overview
11.10.2 Financial
11.10.3 Products/ Services Offered
11.10.4 SWOT Analysis
12. Use Cases and Best Practices
13. Conclusion
An accurate research report requires proper strategizing as well as implementation. There are multiple factors involved in the completion of good and accurate research report and selecting the best methodology to compete the research is the toughest part. Since the research reports we provide play a crucial role in any company’s decision-making process, therefore we at SNS Insider always believe that we should choose the best method which gives us results closer to reality. This allows us to reach at a stage wherein we can provide our clients best and accurate investment to output ratio.
Each report that we prepare takes a timeframe of 350-400 business hours for production. Starting from the selection of titles through a couple of in-depth brain storming session to the final QC process before uploading our titles on our website we dedicate around 350 working hours. The titles are selected based on their current market cap and the foreseen CAGR and growth.
The 5 steps process:
Step 1: Secondary Research:
Secondary Research or Desk Research is as the name suggests is a research process wherein, we collect data through the readily available information. In this process we use various paid and unpaid databases which our team has access to and gather data through the same. This includes examining of listed companies’ annual reports, Journals, SEC filling etc. Apart from this our team has access to various associations across the globe across different industries. Lastly, we have exchange relationships with various university as well as individual libraries.
Step 2: Primary Research
When we talk about primary research, it is a type of study in which the researchers collect relevant data samples directly, rather than relying on previously collected data. This type of research is focused on gaining content specific facts that can be sued to solve specific problems. Since the collected data is fresh and first hand therefore it makes the study more accurate and genuine.
We at SNS Insider have divided Primary Research into 2 parts.
Part 1 wherein we interview the KOLs of major players as well as the upcoming ones across various geographic regions. This allows us to have their view over the market scenario and acts as an important tool to come closer to the accurate market numbers. As many as 45 paid and unpaid primary interviews are taken from both the demand and supply side of the industry to make sure we land at an accurate judgement and analysis of the market.
This step involves the triangulation of data wherein our team analyses the interview transcripts, online survey responses and observation of on filed participants. The below mentioned chart should give a better understanding of the part 1 of the primary interview.
Part 2: In this part of primary research the data collected via secondary research and the part 1 of the primary research is validated with the interviews from individual consultants and subject matter experts.
Consultants are those set of people who have at least 12 years of experience and expertise within the industry whereas Subject Matter Experts are those with at least 15 years of experience behind their back within the same space. The data with the help of two main processes i.e., FGDs (Focused Group Discussions) and IDs (Individual Discussions). This gives us a 3rd party nonbiased primary view of the market scenario making it a more dependable one while collation of the data pointers.
Step 3: Data Bank Validation
Once all the information is collected via primary and secondary sources, we run that information for data validation. At our intelligence centre our research heads track a lot of information related to the market which includes the quarterly reports, the daily stock prices, and other relevant information. Our data bank server gets updated every fortnight and that is how the information which we collected using our primary and secondary information is revalidated in real time.
Step 4: QA/QC Process
After all the data collection and validation our team does a final level of quality check and quality assurance to get rid of any unwanted or undesired mistakes. This might include but not limited to getting rid of the any typos, duplication of numbers or missing of any important information. The people involved in this process include technical content writers, research heads and graphics people. Once this process is completed the title gets uploader on our platform for our clients to read it.
Step 5: Final QC/QA Process:
This is the last process and comes when the client has ordered the study. In this process a final QA/QC is done before the study is emailed to the client. Since we believe in giving our clients a good experience of our research studies, therefore, to make sure that we do not lack at our end in any way humanly possible we do a final round of quality check and then dispatch the study to the client.
Key Segments:
By Type
Automated Passenger Counting Systems
Passenger Information Systems
Display Systems
Announcement and Emergency Communication Systems
Infotainment Systems
Mobile Applications
By Technology
Infrared
Stereoscopic vision
Time of Flight
Others
By Application
Buses
Trains and Trams
Ferries
Railways
Roadways
Airways
Request for Segment Customization as per your Business Requirement: Segment Customization Request
Regional Coverage:
North America
US
Canada
Mexico
Europe
Eastern Europe
Poland
Romania
Hungary
Turkey
Rest of Eastern Europe
Western Europe
Germany
France
UK
Italy
Spain
Netherlands
Switzerland
Austria
Rest of Western Europe
Asia Pacific
China
India
Japan
South Korea
Vietnam
Singapore
Australia
Rest of Asia Pacific
Middle East & Africa
Middle East
UAE
Egypt
Saudi Arabia
Qatar
Rest of Middle East
Africa
Nigeria
South Africa
Rest of Africa
Latin America
Brazil
Argentina
Colombia
Rest of Latin America
Request for Country Level Research Report: Country Level Customization Request
Available Customization
With the given market data, SNS Insider offers customization as per the company’s specific needs. The following customization options are available for the report:
Detailed Volume Analysis
Criss-Cross segment analysis (e.g. Product X Application)
Competitive Product Benchmarking
Geographic Analysis
Additional countries in any of the regions
Customized Data Representation
Detailed analysis and profiling of additional market players
The OLED Market Size was valued at USD 46.25 Billion in 2023 and is expected to grow at a CAGR of 19.64% to reach USD 232.22 Billion by 2032.
Volumetric Video Market Size was valued at USD 2.16 billion in 2023 and is expected to reach USD 20.92 billion by 2032, growing at a CAGR of 28.7 % over the forecast period 2024-2032.
The Energy Management Systems Market size was valued at USD 39.47 Billion in 2023. It is estimated to reach USD 129.22 Billion by 2032, growing at a CAGR of 14.11% during 2024-2032.
The 3D Projector Market was valued at USD 3.8 Billion in 2023 and is expected to reach USD 7.6 Billion by 2032, growing at a CAGR of 7.88%% from 2024-2032.
The Gesture Recognition and touchless Sensing Market Size was valued at USD 19.4 billion in 2023 and is expected to reach USD 127.78 billion by 2032 and grow at a CAGR of 23.3 % over the forecast period 2024-2032.
The Wearable Sensors Market Size was valued at USD 3.12 Billion in 2023 and is expected to reach USD 10.83 Billion by 2032, at CAGR of 14.96% From 2024-2032
Hi! Click one of our member below to chat on Phone