Automated Liquid Handling Technologies Market Report Scope & Overview:
Get More Information on Automated Liquid Handling Technologies Market - Request Sample Report
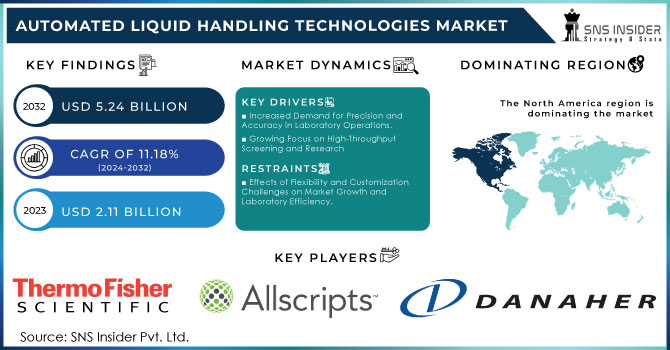
The Automated Liquid Handling Technologies Market Size was valued at USD 2.11 Billion in 2023 and is expected to reach USD 5.24 Billion by 2032 and grow at a CAGR of 11.18% over the forecast period 2024-2032.
The automated liquid handling technologies market has grown substantially in the past few years, fueled by the rising need for high-throughput screening, precision, and reproducibility in different laboratory procedures. Modern laboratories rely on automated liquid handling systems for accurate and efficient liquid dispensing, mixing, and transferring tasks. In sectors like pharmaceuticals, biotechnology, Drug Discovery & ADME-Tox Research, and academic research, these technologies are essential for their crucial roles in ensuring accuracy and efficiency. The increasing demand for automation in labs to improve workflow efficiency and lower human errors is a major factor driving the automated liquid handling technologies market. More than 70% of major pharmaceutical and biotech firms have implemented varying degrees of laboratory automation. Liquid handling systems, with a value of approximately USD 2 billion in 2023, are the biggest category. This ability is especially important in fields like drug development, where extensive examination of chemical substances is needed to find possible treatments.
Pharmaceutical and biotechnology firms are among the primary users of automated liquid handling technologies. In the field of drug discovery, these systems are utilized for activities like compound dilution, plate replication, and assay development, speeding up the screening process greatly. Automating these monotonous and labor-intensive tasks allows researchers to dedicate their attention to more intricate facets of drug development, ultimately expediting the time it takes for new drugs to reach the market. Additionally, precision in managing small liquid volumes is crucial in the advancement of biologics and personalized medicine, as the accuracy of each process can influence the result of treatment.
Market Dynamics
Drivers
-
Increased Demand for Precision and Accuracy in Laboratory Operations.
Automated liquid handling technologies play a crucial role in improving precision and accuracy in laboratory procedures. Due to the growing complexity of scientific research and pharmaceutical development, there is an increasing need for accurate and consistent results. Automated systems help decrease the possibility of mistakes made by humans, guaranteeing consistent liquid transfers, which is important for experiments where small differences can affect results. Moreover, automated systems increase efficiency by enabling labs to handle more samples within a reduced timeframe. This higher throughput is crucial for applications with high volumes, like clinical Drug Discovery & ADME-Tox Research and large research studies. The increasing need for efficiency in research and development is driving the use of automated liquid handling technologies, which can perform tasks quickly and accurately. The demand for accuracy is also driven by strict quality control regulations and industry standards. Automated systems make it easier to comply with these standards by offering thorough documentation of processes and outcomes. Having traceability is crucial for complying with regulations and guaranteeing the reproducibility of research results.
-
Growing Focus on High-Throughput Screening and Research
The automation of the liquid handling technologies market is driven significantly by the growing focus on high-throughput screening (HTS) in drug discovery and research. High-throughput screening (HTS) is the quick evaluation of numerous samples to pinpoint potential drug candidates or research targets. Automated systems for liquid handling are crucial for handling the high quantities of samples and reagents needed for High Throughput Screening (HTS). Automated systems allow researchers to carry out intricate assays and screening procedures with great precision and efficiency. Automating liquid handling tasks in labs can speed up screening, lessen manual work, and boost experiment throughput. This ability is essential for fulfilling the requirements of current drug development and investigation, where rapidity and effectiveness are crucial. The increasing emphasis on personalized medicine and the exploration of new drug targets is fueling the demand for high-throughput screening. Researchers are more and more searching for methods to analyze extensive collections of compounds or genetic variations to discover potential therapeutic options. Automated technologies make the process easier by offering the required speed and precision for managing large amounts of samples and data.
Restraints
-
Effects of Flexibility and Customization Challenges on Market Growth and Laboratory Efficiency.
Although automated liquid handling systems provide accurate and efficient performance, they may lack flexibility and customization options. Certain systems are tailored for particular applications or protocols, limiting their flexibility for varying tasks or shifts in research needs. Automated systems may not offer enough flexibility for laboratories needing versatile and customizable solutions. Modifying automated liquid handling systems to suit various applications or merging with current lab processes could require extra expenses and technical obstacles. This restriction may influence how the systems are valued and can hinder their use in labs with various or changing requirements. Moreover, the customization of automated systems may not necessarily correspond with the distinct needs of individual research projects or protocols. Laboratories with specific requirements may discover that pre-made solutions do not completely meet their needs, resulting in possible inefficiencies or the necessity for alternative methods. In brief, the constrained flexibility and customization choices of automated liquid handling systems may hinder market growth. Laboratories with varied or changing needs may discover that traditional systems do not completely fulfill their needs, affecting their acceptance and overall market expansion.
Market Segmentation
By Product
Automated liquid handling workstations dominated in 2023 with a market share of over 57% because of their important function in high-throughput screening, drug discovery, genomics, and proteomics. These desk spaces facilitate accurate and effective liquid movement, reducing mistakes by humans and enhancing productivity in the laboratory. Their ability to grow and adapt effectively in extensive research and clinical environments is crucial, leading to their extensive use. An instance of this is the widespread utilization of Tecan's Freedom EVO series in genomics research, which allows for automated DNA/RNA extraction and PCR setup. In the same way, the Microlab STAR from Hamilton is used for drug discovery, enabling automated management of compounds and development of assays.
Reagents & consumables are expected to have a rapid growth rate during 2024-2032, due to the ongoing demand for replacement items and the rising prevalence of automated workstations in labs. This section contains important items like pipette tips, tubes, plates, and reagents necessary for automated liquid handling systems to work effectively. The regularity of their utilization guarantees a consistent need. Beckman Coulter provides a variety of consumables tailored for their Biomek series workstations to ensure optimal performance and compatibility. In the same way, Agilent Technologies offers specific chemicals for its Bravo Automated Liquid Handling Platform, which is utilized in genomics and drug discovery.
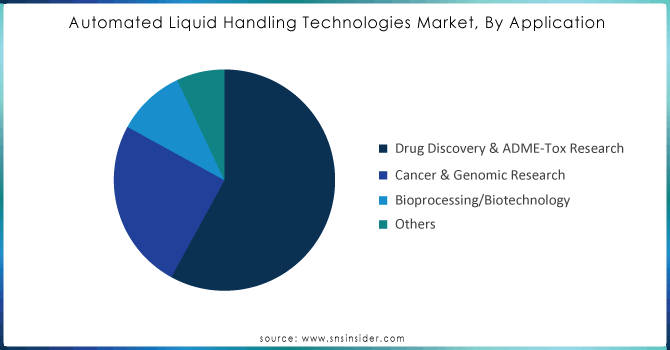
By Application
Drug Discovery & ADME-Tox Research held a major market share of 58% in 2023. The growing complexity and size of drug development procedures fuel this dominance. Automated systems for handling liquids improve efficiency and precision in drug discovery by simplifying the preparation and testing of compounds. These technologies are essential for conducting high-throughput screening (HTS) tests, fine-tuning primary compounds, and assessing drug metabolism and toxicity (ADME-Tox). Thermo Fisher Scientific and Hamilton Company utilize these systems to speed up drug discovery processes and enhance research efficiency. Thermo Fisher's Multidrop Combi and Hamilton's STARlet are advanced systems specifically created for precise liquid handling in drug discovery processes.
The cancer & genomic research segment is the fastest-growing segment during the forecast period 2024-2032. The increased interest in personalized medicine and genomic research has driven the need for automated solutions capable of efficiently managing complex, large-scale assays. Automated liquid handling systems play a critical role in activities like genomic sequencing, gene expression analysis, and cancer biomarker discovery. These systems allow scientists to efficiently handle large volumes of genetic data, which is essential for progress in cancer research and the creation of targeted treatments. Companies such as Beckman Coulter and Agilent Technologies lead the way with offerings like Beckman Coulter’s Biomek i7 and Agilent’s Bravo Automated Liquid Handling Platform, supporting high-throughput genomics and cancer research.
Need any customization research on Automated Liquid Handling Technologies Market - Enquiry Now
Regional Analysis
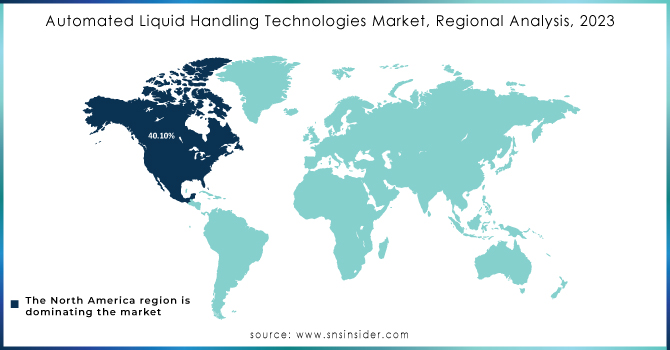
In 2023, North America dominated the market with a 40% market share, thanks to its top-notch healthcare infrastructure, significant investments in research and development, and the participation of major market stakeholders. Automation technologies play a crucial role in labs and research facilities in the US, supporting the leadership of the area. Thermo Fisher Scientific and Beckman Coulter are vital companies providing sophisticated liquid handling systems to streamline processes in genomics, drug discovery, and clinical Drug Discovery & ADME-Tox Research. Moreover, the North American market is being driven by the increasing focus on personalized medicine and the expanding demand for high-throughput screening.
Asia-Pacific region is expected to grow quickly from 2024 to 2032, driven by the expansion of pharmaceutical and biotechnology sectors, increased healthcare expenditure, and a growing focus on lab automation in countries like China, Japan, and India. The region is experiencing growth as a result of government initiatives aimed at enhancing healthcare infrastructure and advancing research in drug development and genomic research. PerkinElmer and Agilent Technologies are expanding their presence in APAC by offering automated solutions to address the growing demand for accuracy and effectiveness in laboratory operations in the area.
Key Players
The major key players are Mettler Toledo, Tecan Trading AG, Thermo Fisher Inc., Agilent Technologies, Qiagen, Aurora Biomed, PerkinElmer Inc., Autogen, Lonza, Danaher, Labcyte Inc., BioTek Instruments, Hudson Robotics, Analytik Jena, Hamilton, Eppendorf AG, Gilson Inc., and other key players.
Recent Development
-
In July 2023, Tecan introduced the Fluent Mix and Pierce Module to advance its Fluent Automation Workstation. This product allows maximizing the potential of automated liquid handling provided by the Workstation through reagent container mixing/piercing. Such capabilities minimize manual input and enhance the Workstation’s workflow efficiency.
-
In June 2023, Agilent Technologies launched the Bravo NGS Automated Liquid Handling Platform to simplify the preparation of next-generation sequencing libraries. The platform offers laboratories that specialize in genomics its flexibility and precise status.
| Report Attributes | Details |
|---|---|
| Market Size in 2023 | USD 2.11 Billion |
| Market Size by 2032 | USD 5.24 Billion |
| CAGR | CAGR of 11.18% From 2024 to 2032 |
| Base Year | 2023 |
| Forecast Period | 2024-2032 |
| Historical Data | 2020-2022 |
| Report Scope & Coverage | Market Size, Segments Analysis, Competitive Landscape, Regional Analysis, DROC & SWOT Analysis, Forecast Outlook |
| Key Segments | • By Product (Automated Liquid Handling Workstations, Reagents & Consumables) • By Application (Drug Discovery & ADME-Tox Research, Cancer & Genomic Research, Bioprocessing/Biotechnology, Others) • By End User (Academic & Research Institutes, Pharmaceutical & Biotechnology Companies, Contract Research Organizations) |
| Regional Analysis/Coverage | North America (US, Canada, Mexico), Europe (Eastern Europe [Poland, Romania, Hungary, Turkey, Rest of Eastern Europe] Western Europe] Germany, France, UK, Italy, Spain, Netherlands, Switzerland, Austria, Rest of Western Europe]), Asia Pacific (China, India, Japan, South Korea, Vietnam, Singapore, Australia, Rest of Asia Pacific), Middle East & Africa (Middle East [UAE, Egypt, Saudi Arabia, Qatar, Rest of Middle East], Africa [Nigeria, South Africa, Rest of Africa], Latin America (Brazil, Argentina, Colombia, Rest of Latin America) |
| Company Profiles | Mettler Toledo, Tecan Trading AG, Thermo Fisher Inc., Agilent Technologies, Qiagen, Aurora Biomed, PerkinElmer Inc., Autogen, Lonza, Danaher, Labcyte Inc., BioTek Instruments, Hudson Robotics, Analytik Jena, Hamilton, Eppendorf AG, Gilson Inc |
| Key Drivers | • Increased Demand for Precision and Accuracy in Laboratory Operations. • Growing Focus on High-Throughput Screening and Research. |
| RESTRAINTS | • Effects of Flexibility and Customization Challenges on Market Growth and Laboratory Efficiency. |
