Get More Information on Automated Fare Collection Market- Request Sample Report
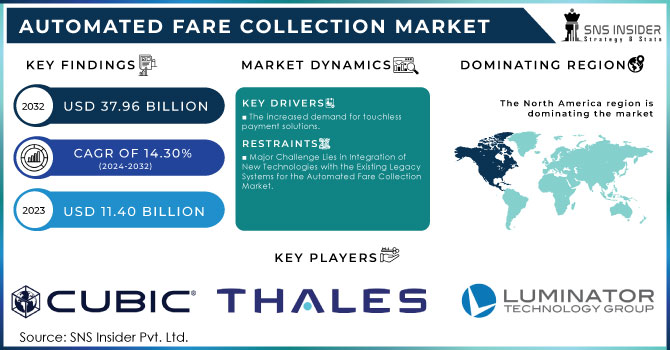
The Automated Fare Collection Market Size was valued at USD 11.40 billion in 2023 and is expected to reach USD 37.96 billion by 2032, growing at a CAGR of 14.30% over the forecast period of 2024-2032.
The Automated Fare Collection market is growing highly attributable to general technology advancement and growth in demand for efficient transit systems. Remarkably, as of now, about 75% of public transportation agencies use some level of AFC technology or enhanced fare management and improved user experience. Second, 65% of the operators said that contactless payment solutions have increased their ridership by 30% because the passengers enjoy the speed and convenience of the transaction. About user preference, 82% of passengers prefer mobile ticketing most. Again, it illustrates a switchover to digital fare collection. Furthermore, 58% of the transit agencies have deployed smart payment systems. With these payment systems, passengers can travel in a horizontal direction across different modes of public transport, making them more satisfied with the transport services. The deployment of smart card systems is also another notable fact as 48% of the agencies have reduced cash transactions to some extent up to 40%. Today, they have switched towards cashless fare collection. In this regard, the increasing role of automation in improving efficiency in the service, thus improving customer experience, would make the AFC market in the U.S. an integral part of the future public transportation landscape.
The AFC market is slowly evolving and growing based on the enhanced realization through technological progress coupled with the immense demand for more efficient payment in public transport. Another key trend in this industry is the rise in adoption of contactless payment systems, as 56 percent of the responding transit agencies reported increased usage of contactless smart cards and mobile applications, which is a shift towards more seamless travel experiences. Also, the increase of its usage in tandem with mobile wallets, where 48% of the transit systems have allowed riders to be able to use a digital wallet for fare payments, showing good consumer preference in convenience and speed. Open payment systems, which enable riders to use personal payment methods, are gaining traction; 42% of U.S. transit agencies report plans to implement or upgrade those systems in the next year. In addition, the push for data analytics as a call to action for operational efficiency is still imperative; 60 percent of transit agencies say they are applying data-driven insights to optimize fare collection and reduce fraud. This trend enables the creation of a better user experience with improved revenue protection and operational efficiency with the rapid transformation taking place in the transportation landscape. As it continues to advance in technology, the AFC market will further advance and bring about much more integrated solutions, which tend toward user-friendliness.
Drivers:
The increased demand for touchless payment solutions.
Need for contactless payment solutions is one of the factors driving growth in the Automated Fare Collection (AFC) market. Public transport agencies are increasingly seeking contactless payment systems intended to offer better customer experience and better operational performance, and this need has picked up specifically after the COVID-19 pandemic, as more and more customers want to avoid the inconvenience of traditional cash or card-based payments. This step is also evident by the rising number of mobile wallet and contactless smart cards adoption, which enables boarding passes without cash or card usage, thereby expelling queues and increasing optimal collection.
The shift in the option of digital payment also goes hand-in-glove with the market trend of embracing technology for convenience, hence making a transit system more likely to attract tech-friendly riders. In response to demand, transit agencies invest in infrastructure for these payment methods with enhancing ridership and revenue. More ridership also generates more revenue, and the drive toward contactless payment solutions has the end-user experience improve while supporting operational efficiencies to change the face of public transportation fare collection in the future.
Restrains:
Major Challenge Lies in Integration of New Technologies with the Existing Legacy Systems for the Automated Fare Collection Market.
Among the key challenges to the Automated Fare Collection (AFC) market is the integration of new technologies with existing legacy systems. Most of the transport entities run on legacy infrastructures that are not in sync with today's contactless card pay and mobile wallet payment methods. Such incompatibility can limit the smooth running of modern AFC systems, thereby increasing the cost and complexity incurred. The process of migrating to a fully integrated system may also demand much new hardware and software investment that can be quite financially expensive for agencies. Agencies operating under tight budgets may be financially burdened.
Furthermore, the integration process normally disrupts the existing operations of the agencies. Hence, it necessitates extensive one-on-one training for employees and time for riders who are accustomed to the habitual mode of payment. Many agencies will encounter resistance from different stakeholders reluctant to change long-known procedures. Issues of data security and privacy further complicate the integration process. The agencies must be sure that new systems comply with regulations and heed the sense of protecting sensitive customer information. The challenge of integrating the innovative solutions with legacy systems would slow and limit the full potential of automated fare collection technologies, even though there is a strong push for modernization in fare collection.
By Component:
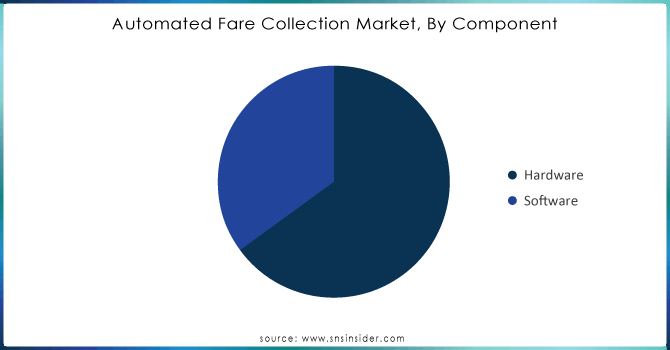
Hardware dominated the market, holding over 60% of the total market share. It includes ticket vending machines, turnstiles, and contactless card readers, all of which are necessary to install automated fare collection. As transit agencies and parking facilities modernize their infrastructures to support seamless fare collection, demand for such advanced hardware solutions will likely skyrocket.
The other critically important category is software, which stands at around 40% of the market share. This also encapsulates fare management applications, data analytics, and payment processing, in terms of applications. Key drivers of this segment are cloud-based solutions as well as mobile application development, which ensure greater rider convenience and provide transit agencies with essential insights into ridership and revenue management.
Need any customization research on Automated Fare Collection market - Enquiry Now
By Application:
The market for AFC is bifurcated across different applications, and all of them prove to be rich sources for revenue generation in the period of 2018 to 2032. The segment of rail and transportation forms the largest share with about 45% of total revenue and is expected to increase further with the increasing demand for efficient fare systems as urban populations go up and public transit usage increases. By steadily investing in new solutions that better improve user experience and enhance the operationality of the service of the transit agency, revenue in this segment is expected to grow. The market share for the parking segment stands at about 30%, which is also gaining momentum, because cities are now focusing on streamlining both parking space and payment processes; with automated systems, there is a greater convenience and speed in dealing with customers. This segment relies on smart city initiatives that boost efficient infrastructure to increase its revenues. The second segment is theme parks, concerts, and sports venues- around 15% segment and gradually implementing AFC systems to provide greater experiences to guests.
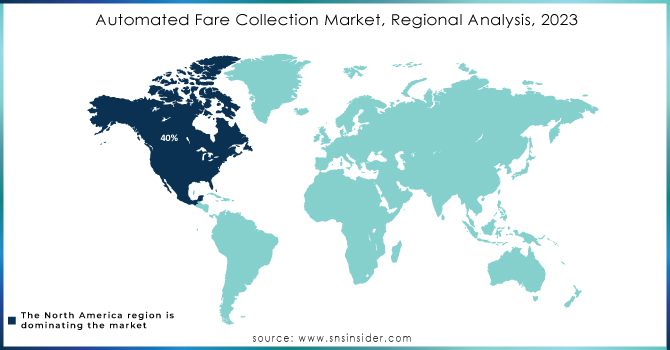
The Automated Fare Collection market has strong regional variations and is characterized by dominance from North America, Europe, and Asia Pacific. Region-wise, North America holds the greatest share, with around 40% market revenue share. This is because the region has a very robust public transportation infrastructure and a very strong focus on integrating all advanced technologies in order to improve user experiences. Such big cities as New York, Chicago, and San Francisco have modern fare collection systems that ease operations and keep up with the ever-rising demand for contactless payment.
Europe follows close behind, taking an approximate 30% of the market share. AFC technologies have been among the front-runners in European countries due to their governments' integration of various programs meant to improve efficiency and sustainability in the use of public transport. Cities such as London and Paris have managed to rollout fully-fledged automated fare collection systems, which are now role models for other geographies.
The Asia Pacific accounts for about 25% of the market share and is driving the adoption of AFC due to rampant urbanization and increasing investment in the public transportation infrastructure. Countries such as China, India, and Japan focus on the modernization of their transit system, contactless payment methods, and overall operational efficiency.
Some of the major key players are:
Cubic Corporation: (Cubic Ticketing Solutions, Cubic Fare Management System)
Thales Group: (Thales Transit Ticketing Solutions, Thales Contactless Payment Systems)
Luminator Technology Group: (SmartFare Collection System, Luminator Bus Validation Solutions)
Siemens AG: (Siemens Mobility Ticketing Solutions, Siemens Contactless Fare Collection Systems)
Genfare (a division of SPX Corporation): (Genfare Automated Fare Collection Systems, Genfare Ticket Vending Machines)
Kapsch TrafficCom AG: (Kapsch AFC Solutions, Kapsch E-Ticketing Systems)
Verifone Systems, Inc.: (Verifone Contactless Payment Solutions, Verifone Transit Fare Collection Devices)
NEC Corporation: (NEC Transit Ticketing Systems, NEC Smart Card Solutions)
Infineon Technologies AG: (Infineon Smart Payment Solutions, Infineon Security ICs for Fare Collection)
Parkeon (now Flowbird): (Flowbird Parking Payment Solutions, Flowbird Ticket Vending Machines)
Scheidt & Bachmann GmbH: (Scheidt & Bachmann Ticketing Solutions, Scheidt & Bachmann Fare Collection Systems)
Cennatek: (Cennatek Smart Fare Collection Systems, Cennatek Cloud-Based Payment Solutions)
Giesecke+Devrient (G+D): (G+D Contactless Payment Cards, G+D Mobile Security Solutions)
INIT Innovations in Transportation, Inc.: (INIT Fare Management Solutions, INIT Mobile Ticketing Apps)
Ticketer Ltd: (Ticketer Contactless Ticket Machines, Ticketer Mobile Ticketing Solutions)
Masabi Ltd: (Masabi Justride Mobile Ticketing, Masabi Fare Payment SDK)
Edenred: (Edenred Ticketing Solutions, Edenred Employee Mobility Solutions)
Civitas Solutions: (Civitas Fare Collection Software, Civitas Mobile Payment Solutions)
AEP Ticketing Solutions: (AEP Smart Fare Solutions, AEP Automated Ticket Vending Machines)
TransLink: (TransLink Smart Card Solutions, TransLink Mobile Payment Application)
| Report Attributes | Details |
|---|---|
| Market Size in 2023 | USD 11.40 Billion |
| Market Size by 2032 | USD 37.96 Billion |
| CAGR | CAGR of 14.30% From 2024 to 2032 |
| Base Year | 2023 |
| Forecast Period | 2024-2032 |
| Historical Data | 2020-2022 |
| Report Scope & Coverage | Market Size, Segments Analysis, Competitive Landscape, Regional Analysis, DROC & SWOT Analysis, Forecast Outlook |
| Key Segments | • By Component: (Hardware, Software) • By Technology: (Smart Card, Magnetic Stripe, Near-field communication (NFC), Optical Character Recognition (OCR)) • By System: (Ticket Vending Machine (TVM), Ticket Office Machine (TOM), Fare Gates, IC Cards) • By Application: (Railways & Transportation, Parking, Entertainment) |
| Regional Analysis/Coverage | North America (US, Canada, Mexico), Europe (Eastern Europe [Poland, Romania, Hungary, Turkey, Rest of Eastern Europe] Western Europe] Germany, France, UK, Italy, Spain, Netherlands, Switzerland, Austria, Rest of Western Europe]), Asia Pacific (China, India, Japan, South Korea, Vietnam, Singapore, Australia, Rest of Asia Pacific), Middle East & Africa (Middle East [UAE, Egypt, Saudi Arabia, Qatar, Rest of Middle East], Africa [Nigeria, South Africa, Rest of Africa], Latin America (Brazil, Argentina, Colombia, Rest of Latin America) |
| Company Profiles | Cubic Corporation, Thales Group, Luminator Technology Group, Siemens AG, Genfare, NEC Corporation, Others |
| Key Drivers | • This has led to an increased demand for touchless payment solutions. |
| RESTRAINTS | • Major Challenge Lies in Integration of New Technologies with the Existing Legacy Systems for the Automated Fare Collection Market. |
Ans: Major Challenge Lies in Integration of New Technologies with the Existing Legacy Systems for the Automated Fare Collection Market.
Ans: The Automated Fare Collection Market size was valued at USD 11.40 billion in 2023 and is expected to reach USD 37.96 billion by 2032.
Ans: This has led to an increased demand for touchless payment solutions.
Ans: Hardware dominated the market, holding over 60% of the total market share.
Ans: North America holds the greatest share, with around 40% market revenue share.
Table of Contents:
1. Introduction
1.1 Market Definition
1.2 Scope (Inclusion and Exclusions)
1.3 Research Assumptions
2. Executive Summary
2.1 Market Overview
2.2 Regional Synopsis
2.3 Competitive Summary
3. Research Methodology
3.1 Top-Down Approach
3.2 Bottom-up Approach
3.3. Data Validation
3.4 Primary Interviews
4. Market Dynamics Impact Analysis
4.1 Market Driving Factors Analysis
4.1.1 Drivers
4.1.2 Restraints
4.1.3 Opportunities
4.1.4 Challenges
4.2 PESTLE Analysis
4.3 Porter’s Five Forces Model
5. Statistical Insights and Trends Reporting
5.1 Vehicle Production and Sales Volumes, 2020-2032, by Region
5.2 Emission Standards Compliance, by Region
5.3 Vehicle Technology Adoption, by Region
5.4 Consumer Preferences, by Region
5.5 Aftermarket Trends (Data on vehicle maintenance, parts, and services)
6. Competitive Landscape
6.1 List of Major Companies, By Region
6.2 Market Share Analysis, By Region
6.3 Product Benchmarking
6.3.1 Product specifications and features
6.3.2 Pricing
6.4 Strategic Initiatives
6.4.1 Marketing and promotional activities
6.4.2 Distribution and supply chain strategies
6.4.3 Expansion plans and new product launches
6.4.4 Strategic partnerships and collaborations
6.5 Technological Advancements
6.6 Market Positioning and Branding
7. Automated Fare Collection Market Segmentation, By Component
7.1 Chapter Overview
7.2 Hardware
7.2.1 Hardware Market Trends Analysis (2020-2032)
7.2.2 Hardware Market Size Estimates and Forecasts to 2032 (USD Billion)
7.3 Software
7.3.1 Software Market Trends Analysis (2020-2032)
7.3.2 Software Market Size Estimates and Forecasts to 2032 (USD Billion)
8. Automated Fare Collection Market Segmentation, By Technology
8.1 Chapter Overview
8.2 Smart Card
8.2.1 Smart Card Market Trends Analysis (2020-2032)
8.2.2 Smart Card Market Size Estimates and Forecasts to 2032 (USD Billion)
8.3 Magnetic Stripe
8.3.1 Magnetic Stripe Market Trends Analysis (2020-2032)
8.3.2 Magnetic Stripe Market Size Estimates and Forecasts to 2032 (USD Billion)
8.4 Near-field communication (NFC)
8.4.1 Near-field communication (NFC) Market Trends Analysis (2020-2032)
8.4.2 Near-field communication (NFC) Market Size Estimates and Forecasts to 2032 (USD Billion)
8.5 Optical Character Recognition (OCR)
8.5.1 Optical Character Recognition (OCR) Market Trends Analysis (2020-2032)
8.5.2 Optical Character Recognition (OCR) Market Size Estimates and Forecasts to 2032 (USD Billion)
9. Automated Fare Collection Market Segmentation, by System
9.1 Chapter Overview
9.2 Ticket Vending Machine (TVM)
9.2.1 Ticket Vending Machine (TVM) Market Trends Analysis (2020-2032)
9.2.2 Ticket Vending Machine (TVM) Market Size Estimates and Forecasts to 2032 (USD Billion)
9.3 Ticket Office Machine (TOM)
9.3.1 Ticket Office Machine (TOM) Market Trends Analysis (2020-2032)
9.3.2 Ticket Office Machine (TOM) Market Size Estimates and Forecasts to 2032 (USD Billion)
9.4 Fare Gates
9.4.1 Fare Gates Market Trends Analysis (2020-2032)
9.4.2 Fare Gates Market Size Estimates and Forecasts to 2032 (USD Billion)
9.5 IC Cards
9.5.1 IC Cards Market Trends Analysis (2020-2032)
9.5.2 IC Cards Market Size Estimates and Forecasts to 2032 (USD Billion)
10. Automated Fare Collection Market Segmentation, By Application
10.1 Chapter Overview
10.2 Railways & Transportation
10.2.1 Railways & Transportation Market Trends Analysis (2020-2032)
10.2.2 Railways & Transportation Market Size Estimates and Forecasts to 2032 (USD Billion)
10.3 Parking
10.3.1 Parking Market Trends Analysis (2020-2032)
10.3.2 Parking Market Size Estimates and Forecasts to 2032 (USD Billion)
10.4 Entertainment
10.4.1 Entertainment Market Trends Analysis (2020-2032)
10.4.2 Entertainment Market Size Estimates and Forecasts to 2032 (USD Billion)
10.5 Others
10.5.1 Others Market Trends Analysis (2020-2032)
10.5.2 Others Market Size Estimates and Forecasts to 2032 (USD Billion)
11. Regional Analysis
11.1 Chapter Overview
11.2 North America
11.2.1 Trends Analysis
11.2.2 North America Automated Fare Collection Market Estimates and Forecasts, by Country (2020-2032) (USD Billion)
11.2.3 North America Automated Fare Collection Market Estimates and Forecasts, By Component (2020-2032) (USD Billion)
11.2.4 North America Automated Fare Collection Market Estimates and Forecasts, By Technology (2020-2032) (USD Billion)
11.2.5 North America Automated Fare Collection Market Estimates and Forecasts, by System (2020-2032) (USD Billion)
11.2.6 North America Automated Fare Collection Market Estimates and Forecasts, By Application (2020-2032) (USD Billion)
11.2.7 USA
11.2.7.1 USA Automated Fare Collection Market Estimates and Forecasts, By Component (2020-2032) (USD Billion)
11.2.7.2 USA Automated Fare Collection Market Estimates and Forecasts, By Technology (2020-2032) (USD Billion)
11.2.7.3 USA Automated Fare Collection Market Estimates and Forecasts, by System (2020-2032) (USD Billion)
11.2.7.4 USA Automated Fare Collection Market Estimates and Forecasts, By Application (2020-2032) (USD Billion)
11.2.7 Canada
11.2.7.1 Canada Automated Fare Collection Market Estimates and Forecasts, By Component (2020-2032) (USD Billion)
11.2.7.2 Canada Automated Fare Collection Market Estimates and Forecasts, By Technology (2020-2032) (USD Billion)
11.2.7.3 Canada Automated Fare Collection Market Estimates and Forecasts, by System (2020-2032) (USD Billion)
11.2.7.3 Canada Automated Fare Collection Market Estimates and Forecasts, By Application (2020-2032) (USD Billion)
11.2.8 Mexico
11.2.8.1 Mexico Automated Fare Collection Market Estimates and Forecasts, By Component (2020-2032) (USD Billion)
11.2.8.2 Mexico Automated Fare Collection Market Estimates and Forecasts, By Technology (2020-2032) (USD Billion)
11.2.8.3 Mexico Automated Fare Collection Market Estimates and Forecasts, by System (2020-2032) (USD Billion)
11.2.8.3 Mexico Automated Fare Collection Market Estimates and Forecasts, By Application (2020-2032) (USD Billion)
11.3 Europe
11.3.1 Eastern Europe
11.3.1.1 Trends Analysis
11.3.1.2 Eastern Europe Automated Fare Collection Market Estimates and Forecasts, by Country (2020-2032) (USD Billion)
11.3.1.3 Eastern Europe Automated Fare Collection Market Estimates and Forecasts, By Component (2020-2032) (USD Billion)
11.3.1.4 Eastern Europe Automated Fare Collection Market Estimates and Forecasts, By Technology (2020-2032) (USD Billion)
11.3.1.5 Eastern Europe Automated Fare Collection Market Estimates and Forecasts, by System (2020-2032) (USD Billion)
11.3.1.5 Eastern Europe Automated Fare Collection Market Estimates and Forecasts, By Application (2020-2032) (USD Billion)
11.3.1.6 Poland
11.3.1.6.1 Poland Automated Fare Collection Market Estimates and Forecasts, By Component (2020-2032) (USD Billion)
11.3.1.6.2 Poland Automated Fare Collection Market Estimates and Forecasts, By Technology (2020-2032) (USD Billion)
11.3.1.6.3 Poland Automated Fare Collection Market Estimates and Forecasts, by System (2020-2032) (USD Billion)
11.3.1.6.3 Poland Automated Fare Collection Market Estimates and Forecasts, By Application (2020-2032) (USD Billion)
11.3.1.7 Romania
11.3.1.7.1 Romania Automated Fare Collection Market Estimates and Forecasts, By Component (2020-2032) (USD Billion)
11.3.1.7.2 Romania Automated Fare Collection Market Estimates and Forecasts, By Technology (2020-2032) (USD Billion)
11.3.1.7.3 Romania Automated Fare Collection Market Estimates and Forecasts, by System (2020-2032) (USD Billion)
11.3.1.7.3 Romania Automated Fare Collection Market Estimates and Forecasts, By Application (2020-2032) (USD Billion)
11.3.1.8 Hungary
11.3.1.8.1 Hungary Automated Fare Collection Market Estimates and Forecasts, By Component (2020-2032) (USD Billion)
11.3.1.8.2 Hungary Automated Fare Collection Market Estimates and Forecasts, By Technology (2020-2032) (USD Billion)
11.3.1.8.3 Hungary Automated Fare Collection Market Estimates and Forecasts, by System (2020-2032) (USD Billion)
11.3.1.8.3 Hungary Automated Fare Collection Market Estimates and Forecasts, By Application (2020-2032) (USD Billion)
11.3.1.9 Turkey
11.3.1.9.1 Turkey Automated Fare Collection Market Estimates and Forecasts, By Component (2020-2032) (USD Billion)
11.3.1.9.2 Turkey Automated Fare Collection Market Estimates and Forecasts, By Technology (2020-2032) (USD Billion)
11.3.1.9.3 Turkey Automated Fare Collection Market Estimates and Forecasts, by System (2020-2032) (USD Billion)
11.3.1.9.3 Turkey Automated Fare Collection Market Estimates and Forecasts, By Application (2020-2032) (USD Billion)
11.3.1.11 Rest of Eastern Europe
11.3.1.11.1 Rest of Eastern Europe Automated Fare Collection Market Estimates and Forecasts, By Component (2020-2032) (USD Billion)
11.3.1.11.2 Rest of Eastern Europe Automated Fare Collection Market Estimates and Forecasts, By Technology (2020-2032) (USD Billion)
11.3.1.11.3 Rest of Eastern Europe Automated Fare Collection Market Estimates and Forecasts, by System (2020-2032) (USD Billion)
11.3.1.11.3 Rest of Eastern Europe Automated Fare Collection Market Estimates and Forecasts, By Application (2020-2032) (USD Billion)
11.3.2 Western Europe
11.3.2.1 Trends Analysis
11.3.2.2 Western Europe Automated Fare Collection Market Estimates and Forecasts, by Country (2020-2032) (USD Billion)
11.3.2.3 Western Europe Automated Fare Collection Market Estimates and Forecasts, By Component (2020-2032) (USD Billion)
11.3.2.4 Western Europe Automated Fare Collection Market Estimates and Forecasts, By Technology (2020-2032) (USD Billion)
11.3.2.5 Western Europe Automated Fare Collection Market Estimates and Forecasts, by System (2020-2032) (USD Billion)
11.3.2.5 Western Europe Automated Fare Collection Market Estimates and Forecasts, By Application (2020-2032) (USD Billion)
11.3.2.6 Germany
11.3.2.6.1 Germany Automated Fare Collection Market Estimates and Forecasts, By Component (2020-2032) (USD Billion)
11.3.2.6.2 Germany Automated Fare Collection Market Estimates and Forecasts, By Technology (2020-2032) (USD Billion)
11.3.2.6.3 Germany Automated Fare Collection Market Estimates and Forecasts, by System (2020-2032) (USD Billion)
11.3.2.6.3 Germany Automated Fare Collection Market Estimates and Forecasts, By Application (2020-2032) (USD Billion)
11.3.2.7 France
11.3.2.7.1 France Automated Fare Collection Market Estimates and Forecasts, By Component (2020-2032) (USD Billion)
11.3.2.7.2 France Automated Fare Collection Market Estimates and Forecasts, By Technology (2020-2032) (USD Billion)
11.3.2.7.3 France Automated Fare Collection Market Estimates and Forecasts, by System (2020-2032) (USD Billion)
11.3.2.7.3 France Automated Fare Collection Market Estimates and Forecasts, By Application (2020-2032) (USD Billion)
11.3.2.8 UK
11.3.2.8.1 UK Automated Fare Collection Market Estimates and Forecasts, By Component (2020-2032) (USD Billion)
11.3.2.8.2 UK Automated Fare Collection Market Estimates and Forecasts, By Technology (2020-2032) (USD Billion)
11.3.2.8.3 UK Automated Fare Collection Market Estimates and Forecasts, by System (2020-2032) (USD Billion)
11.3.2.8.3 UK Automated Fare Collection Market Estimates and Forecasts, By Application (2020-2032) (USD Billion)
11.3.2.9 Italy
11.3.2.9.1 Italy Automated Fare Collection Market Estimates and Forecasts, By Component (2020-2032) (USD Billion)
11.3.2.9.2 Italy Automated Fare Collection Market Estimates and Forecasts, By Technology (2020-2032) (USD Billion)
11.3.2.9.3 Italy Automated Fare Collection Market Estimates and Forecasts, by System (2020-2032) (USD Billion)
11.3.2.9.3 Italy Automated Fare Collection Market Estimates and Forecasts, By Application (2020-2032) (USD Billion)
11.3.2.11 Spain
11.3.2.11.1 Spain Automated Fare Collection Market Estimates and Forecasts, By Component (2020-2032) (USD Billion)
11.3.2.11.2 Spain Automated Fare Collection Market Estimates and Forecasts, By Technology (2020-2032) (USD Billion)
11.3.2.11.3 Spain Automated Fare Collection Market Estimates and Forecasts, by System (2020-2032) (USD Billion)
11.3.2.11.3 Spain Automated Fare Collection Market Estimates and Forecasts, By Application (2020-2032) (USD Billion)
11.3.2.11 Netherlands
11.3.2.11.1 Netherlands Automated Fare Collection Market Estimates and Forecasts, By Component (2020-2032) (USD Billion)
11.3.2.11.2 Netherlands Automated Fare Collection Market Estimates and Forecasts, By Technology (2020-2032) (USD Billion)
11.3.2.11.3 Netherlands Automated Fare Collection Market Estimates and Forecasts, by System (2020-2032) (USD Billion)
11.3.2.11.3 Netherlands Automated Fare Collection Market Estimates and Forecasts, By Application (2020-2032) (USD Billion)
11.3.2.12 Switzerland
11.3.2.12.1 Switzerland Automated Fare Collection Market Estimates and Forecasts, By Component (2020-2032) (USD Billion)
11.3.2.12.2 Switzerland Automated Fare Collection Market Estimates and Forecasts, By Technology (2020-2032) (USD Billion)
11.3.2.12.3 Switzerland Automated Fare Collection Market Estimates and Forecasts, by System (2020-2032) (USD Billion)
11.3.2.12.3 Switzerland Automated Fare Collection Market Estimates and Forecasts, By Application (2020-2032) (USD Billion)
11.3.2.13 Austria
11.3.2.13.1 Austria Automated Fare Collection Market Estimates and Forecasts, By Component (2020-2032) (USD Billion)
11.3.2.13.2 Austria Automated Fare Collection Market Estimates and Forecasts, By Technology (2020-2032) (USD Billion)
11.3.2.13.3 Austria Automated Fare Collection Market Estimates and Forecasts, by System (2020-2032) (USD Billion)
11.3.2.13.3 Austria Automated Fare Collection Market Estimates and Forecasts, By Application (2020-2032) (USD Billion)
11.3.2.14 Rest of Western Europe
11.3.2.14.1 Rest of Western Europe Automated Fare Collection Market Estimates and Forecasts, By Component (2020-2032) (USD Billion)
11.3.2.14.2 Rest of Western Europe Automated Fare Collection Market Estimates and Forecasts, By Technology (2020-2032) (USD Billion)
11.3.2.14.3 Rest of Western Europe Automated Fare Collection Market Estimates and Forecasts, by System (2020-2032) (USD Billion)
11.3.2.14.3 Rest of Western Europe Automated Fare Collection Market Estimates and Forecasts, By Application (2020-2032) (USD Billion)
11.4 Asia Pacific
11.4.1 Trends Analysis
11.4.2 Asia Pacific Automated Fare Collection Market Estimates and Forecasts, by Country (2020-2032) (USD Billion)
11.4.3 Asia Pacific Automated Fare Collection Market Estimates and Forecasts, By Component (2020-2032) (USD Billion)
11.4.4 Asia Pacific Automated Fare Collection Market Estimates and Forecasts, By Technology (2020-2032) (USD Billion)
11.4.5 Asia Pacific Automated Fare Collection Market Estimates and Forecasts, by System (2020-2032) (USD Billion)
11.4.5 Asia Pacific Automated Fare Collection Market Estimates and Forecasts, By Application (2020-2032) (USD Billion)
11.4.6 China
11.4.6.1 China Automated Fare Collection Market Estimates and Forecasts, By Component (2020-2032) (USD Billion)
11.4.6.2 China Automated Fare Collection Market Estimates and Forecasts, By Technology (2020-2032) (USD Billion)
11.4.6.3 China Automated Fare Collection Market Estimates and Forecasts, by System (2020-2032) (USD Billion)
11.4.6.3 China Automated Fare Collection Market Estimates and Forecasts, By Application (2020-2032) (USD Billion)
11.4.7 India
11.4.7.1 India Automated Fare Collection Market Estimates and Forecasts, By Component (2020-2032) (USD Billion)
11.4.7.2 India Automated Fare Collection Market Estimates and Forecasts, By Technology (2020-2032) (USD Billion)
11.4.7.3 India Automated Fare Collection Market Estimates and Forecasts, by System (2020-2032) (USD Billion)
11.4.7.3 India Automated Fare Collection Market Estimates and Forecasts, By Application (2020-2032) (USD Billion)
11.4.8 Japan
11.4.8.1 Japan Automated Fare Collection Market Estimates and Forecasts, By Component (2020-2032) (USD Billion)
11.4.8.2 Japan Automated Fare Collection Market Estimates and Forecasts, By Technology (2020-2032) (USD Billion)
11.4.8.3 Japan Automated Fare Collection Market Estimates and Forecasts, by System (2020-2032) (USD Billion)
11.4.8.3 Japan Automated Fare Collection Market Estimates and Forecasts, By Application (2020-2032) (USD Billion)
11.4.9 South Korea
11.4.9.1 South Korea Automated Fare Collection Market Estimates and Forecasts, By Component (2020-2032) (USD Billion)
11.4.9.2 South Korea Automated Fare Collection Market Estimates and Forecasts, By Technology (2020-2032) (USD Billion)
11.4.9.3 South Korea Automated Fare Collection Market Estimates and Forecasts, by System (2020-2032) (USD Billion)
11.4.9.3 South Korea Automated Fare Collection Market Estimates and Forecasts, By Application (2020-2032) (USD Billion)
11.4.11 Vietnam
11.4.11.1 Vietnam Automated Fare Collection Market Estimates and Forecasts, By Component (2020-2032) (USD Billion)
11.4.11.2 Vietnam Automated Fare Collection Market Estimates and Forecasts, By Technology (2020-2032) (USD Billion)
11.4.11.3 Vietnam Automated Fare Collection Market Estimates and Forecasts, by System (2020-2032) (USD Billion)
11.4.11.3 Vietnam Automated Fare Collection Market Estimates and Forecasts, By Application (2020-2032) (USD Billion)
11.4.11 Singapore
11.4.11.1 Singapore Automated Fare Collection Market Estimates and Forecasts, By Component (2020-2032) (USD Billion)
11.4.11.2 Singapore Automated Fare Collection Market Estimates and Forecasts, By Technology (2020-2032) (USD Billion)
11.4.11.3 Singapore Automated Fare Collection Market Estimates and Forecasts, by System (2020-2032) (USD Billion)
11.4.11.3 Singapore Automated Fare Collection Market Estimates and Forecasts, By Application (2020-2032) (USD Billion)
11.4.12 Australia
11.4.12.1 Australia Automated Fare Collection Market Estimates and Forecasts, By Component (2020-2032) (USD Billion)
11.4.12.2 Australia Automated Fare Collection Market Estimates and Forecasts, By Technology (2020-2032) (USD Billion)
11.4.12.3 Australia Automated Fare Collection Market Estimates and Forecasts, by System (2020-2032) (USD Billion)
11.4.12.3 Australia Automated Fare Collection Market Estimates and Forecasts, By Application (2020-2032) (USD Billion)
11.4.13 Rest of Asia Pacific
11.4.13.1 Rest of Asia Pacific Automated Fare Collection Market Estimates and Forecasts, By Component (2020-2032) (USD Billion)
11.4.13.2 Rest of Asia Pacific Automated Fare Collection Market Estimates and Forecasts, By Technology (2020-2032) (USD Billion)
11.4.13.3 Rest of Asia Pacific Automated Fare Collection Market Estimates and Forecasts, by System (2020-2032) (USD Billion)
11.4.13.3 Rest of Asia Pacific Automated Fare Collection Market Estimates and Forecasts, By Application (2020-2032) (USD Billion)
11.5 Middle East and Africa
11.5.1 Middle East
11.5.1.1 Trends Analysis
11.5.1.2 Middle East Automated Fare Collection Market Estimates and Forecasts, by Country (2020-2032) (USD Billion)
11.5.1.3 Middle East Automated Fare Collection Market Estimates and Forecasts, By Component (2020-2032) (USD Billion)
11.5.1.4 Middle East Automated Fare Collection Market Estimates and Forecasts, By Technology (2020-2032) (USD Billion)
11.5.1.5 Middle East Automated Fare Collection Market Estimates and Forecasts, by System (2020-2032) (USD Billion)
11.5.1.5 Middle East Automated Fare Collection Market Estimates and Forecasts, By Application (2020-2032) (USD Billion)
11.5.1.6 UAE
11.5.1.6.1 UAE Automated Fare Collection Market Estimates and Forecasts, By Component (2020-2032) (USD Billion)
11.5.1.6.2 UAE Automated Fare Collection Market Estimates and Forecasts, By Technology (2020-2032) (USD Billion)
11.5.1.6.3 UAE Automated Fare Collection Market Estimates and Forecasts, by System (2020-2032) (USD Billion)
11.5.1.6.3 UAE Automated Fare Collection Market Estimates and Forecasts, By Application (2020-2032) (USD Billion)
11.5.1.7 Egypt
11.5.1.7.1 Egypt Automated Fare Collection Market Estimates and Forecasts, By Component (2020-2032) (USD Billion)
11.5.1.7.2 Egypt Automated Fare Collection Market Estimates and Forecasts, By Technology (2020-2032) (USD Billion)
11.5.1.7.3 Egypt Automated Fare Collection Market Estimates and Forecasts, by System (2020-2032) (USD Billion)
11.5.1.7.3 Egypt Automated Fare Collection Market Estimates and Forecasts, By Application (2020-2032) (USD Billion)
11.5.1.8 Saudi Arabia
11.5.1.8.1 Saudi Arabia Automated Fare Collection Market Estimates and Forecasts, By Component (2020-2032) (USD Billion)
11.5.1.8.2 Saudi Arabia Automated Fare Collection Market Estimates and Forecasts, By Technology (2020-2032) (USD Billion)
11.5.1.8.3 Saudi Arabia Automated Fare Collection Market Estimates and Forecasts, by System (2020-2032) (USD Billion)
11.5.1.8.3 Saudi Arabia Automated Fare Collection Market Estimates and Forecasts, By Application (2020-2032) (USD Billion)
11.5.1.9 Qatar
11.5.1.9.1 Qatar Automated Fare Collection Market Estimates and Forecasts, By Component (2020-2032) (USD Billion)
11.5.1.9.2 Qatar Automated Fare Collection Market Estimates and Forecasts, By Technology (2020-2032) (USD Billion)
11.5.1.9.3 Qatar Automated Fare Collection Market Estimates and Forecasts, by System (2020-2032) (USD Billion)
11.5.1.9.3 Qatar Automated Fare Collection Market Estimates and Forecasts, By Application (2020-2032) (USD Billion)
11.5.1.11 Rest of Middle East
11.5.1.11.1 Rest of Middle East Automated Fare Collection Market Estimates and Forecasts, By Component (2020-2032) (USD Billion)
11.5.1.11.2 Rest of Middle East Automated Fare Collection Market Estimates and Forecasts, By Technology (2020-2032) (USD Billion)
11.5.1.11.3 Rest of Middle East Automated Fare Collection Market Estimates and Forecasts, by System (2020-2032) (USD Billion)
11.5.1.11.3 Rest of Middle East Automated Fare Collection Market Estimates and Forecasts, By Application (2020-2032) (USD Billion)
11.5.2 Africa
11.5.2.1 Trends Analysis
11.5.2.2 Africa Automated Fare Collection Market Estimates and Forecasts, by Country (2020-2032) (USD Billion)
11.5.2.3 Africa Automated Fare Collection Market Estimates and Forecasts, By Component (2020-2032) (USD Billion)
11.5.2.4 Africa Automated Fare Collection Market Estimates and Forecasts, By Technology (2020-2032) (USD Billion)
11.5.2.5 Africa Automated Fare Collection Market Estimates and Forecasts, by System (2020-2032) (USD Billion)
11.5.2.8.3 Africa Automated Fare Collection Market Estimates and Forecasts, By Application (2020-2032) (USD Billion)
11.5.2.6 South Africa
11.5.2.6.1 South Africa Automated Fare Collection Market Estimates and Forecasts, By Component (2020-2032) (USD Billion)
11.5.2.6.2 South Africa Automated Fare Collection Market Estimates and Forecasts, By Technology (2020-2032) (USD Billion)
11.5.2.6.3 South Africa Automated Fare Collection Market Estimates and Forecasts, by System (2020-2032) (USD Billion)
11.5.2.8.3 South Africa Automated Fare Collection Market Estimates and Forecasts, By Application (2020-2032) (USD Billion)
11.5.2.7 Nigeria
11.5.2.7.1 Nigeria Automated Fare Collection Market Estimates and Forecasts, By Component (2020-2032) (USD Billion)
11.5.2.7.2 Nigeria Automated Fare Collection Market Estimates and Forecasts, By Technology (2020-2032) (USD Billion)
11.5.2.7.3 Nigeria Automated Fare Collection Market Estimates and Forecasts, by System (2020-2032) (USD Billion)
11.5.2.8.3 Nigeria Automated Fare Collection Market Estimates and Forecasts, By Application (2020-2032) (USD Billion)
11.5.2.8 Rest of Africa
11.5.2.8.1 Rest of Africa Automated Fare Collection Market Estimates and Forecasts, By Component (2020-2032) (USD Billion)
11.5.2.8.2 Rest of Africa Automated Fare Collection Market Estimates and Forecasts, By Technology (2020-2032) (USD Billion)
11.5.2.8.3 Rest of Africa Automated Fare Collection Market Estimates and Forecasts, by System (2020-2032) (USD Billion)
11.5.2.8.3 Rest of Africa Automated Fare Collection Market Estimates and Forecasts, By Application (2020-2032) (USD Billion)
11.6 Latin America
11.6.1 Trends Analysis
11.6.2 Latin America Automated Fare Collection Market Estimates and Forecasts, by Country (2020-2032) (USD Billion)
11.6.3 Latin America Automated Fare Collection Market Estimates and Forecasts, By Component (2020-2032) (USD Billion)
11.6.4 Latin America Automated Fare Collection Market Estimates and Forecasts, By Technology (2020-2032) (USD Billion)
11.6.5 Latin America Automated Fare Collection Market Estimates and Forecasts, by System (2020-2032) (USD Billion)
11.6.5 Latin America Automated Fare Collection Market Estimates and Forecasts, By Application (2020-2032) (USD Billion)
11.6.6 Brazil
11.6.6.1 Brazil Automated Fare Collection Market Estimates and Forecasts, By Component (2020-2032) (USD Billion)
11.6.6.2 Brazil Automated Fare Collection Market Estimates and Forecasts, By Technology (2020-2032) (USD Billion)
11.6.6.3 Brazil Automated Fare Collection Market Estimates and Forecasts, by System (2020-2032) (USD Billion)
11.6.6.3 Brazil Automated Fare Collection Market Estimates and Forecasts, By Application (2020-2032) (USD Billion)
11.6.7 Argentina
11.6.7.1 Argentina Automated Fare Collection Market Estimates and Forecasts, By Component (2020-2032) (USD Billion)
11.6.7.2 Argentina Automated Fare Collection Market Estimates and Forecasts, By Technology (2020-2032) (USD Billion)
11.6.7.3 Argentina Automated Fare Collection Market Estimates and Forecasts, by System (2020-2032) (USD Billion)
11.6.7.3 Argentina Automated Fare Collection Market Estimates and Forecasts, By Application (2020-2032) (USD Billion)
11.6.8 Colombia
11.6.8.1 Colombia Automated Fare Collection Market Estimates and Forecasts, By Component (2020-2032) (USD Billion)
11.6.8.2 Colombia Automated Fare Collection Market Estimates and Forecasts, By Technology (2020-2032) (USD Billion)
11.6.8.3 Colombia Automated Fare Collection Market Estimates and Forecasts, by System (2020-2032) (USD Billion)
11.6.8.3 Colombia Automated Fare Collection Market Estimates and Forecasts, By Application (2020-2032) (USD Billion)
11.6.9 Rest of Latin America
11.6.9.1 Rest of Latin America Automated Fare Collection Market Estimates and Forecasts, By Component (2020-2032) (USD Billion)
11.6.9.2 Rest of Latin America Automated Fare Collection Market Estimates and Forecasts, By Technology (2020-2032) (USD Billion)
11.6.9.3 Rest of Latin America Automated Fare Collection Market Estimates and Forecasts, by System (2020-2032) (USD Billion)
11.6.9.3 Rest of Latin America Automated Fare Collection Market Estimates and Forecasts, By Application (2020-2032) (USD Billion)
12. Company Profiles
12.1 Cubic Corporation
12.1.1 Company Overview
12.1.2 Financial
12.1.3 Products/ Services Offered
12.1.4 SWOT Analysis
12.2 Thales Group
12.2.1 Company Overview
12.2.2 Financial
12.2.3 Products/ Services Offered
12.2.4 SWOT Analysis
12.3 Luminator Technology Group
12.3.1 Company Overview
12.3.2 Financial
12.3.3 Products/ Services Offered
12.3.4 SWOT Analysis
12.4 Siemens AG
12.4.1 Company Overview
12.4.2 Financial
12.4.3 Products/ Services Offered
12.4.4 SWOT Analysis
12.5 Genfare
12.5.1 Company Overview
12.5.2 Financial
12.5.3 Products/ Services Offered
12.5.4 SWOT Analysis
12.6 Kapsch TrafficCom AG
12.6.1 Company Overview
12.6.2 Financial
12.6.3 Products/ Services Offered
12.6.4 SWOT Analysis
12.7 NEC Corporation
12.7.1 Company Overview
12.7.2 Financial
12.7.3 Products/ Services Offered
12.7.4 SWOT Analysis
12.8 Parkeon
12.8.1 Company Overview
12.8.2 Financial
12.8.3 Products/ Services Offered
12.8.4 SWOT Analysis
12.9 Ticketer Ltd
12.9.1 Company Overview
12.9.2 Financial
12.9.3 Products/ Services Offered
12.9.4 SWOT Analysis
12.10 Others
12.10.1 Company Overview
12.10.2 Financial
12.10.3 Products/ Services Offered
12.10.4 SWOT Analysis
13. Use Cases and Best Practices
14. Conclusion
An accurate research report requires proper strategizing as well as implementation. There are multiple factors involved in the completion of good and accurate research report and selecting the best methodology to compete the research is the toughest part. Since the research reports we provide play a crucial role in any company’s decision-making process, therefore we at SNS Insider always believe that we should choose the best method which gives us results closer to reality. This allows us to reach at a stage wherein we can provide our clients best and accurate investment to output ratio.
Each report that we prepare takes a timeframe of 350-400 business hours for production. Starting from the selection of titles through a couple of in-depth brain storming session to the final QC process before uploading our titles on our website we dedicate around 350 working hours. The titles are selected based on their current market cap and the foreseen CAGR and growth.
The 5 steps process:
Step 1: Secondary Research:
Secondary Research or Desk Research is as the name suggests is a research process wherein, we collect data through the readily available information. In this process we use various paid and unpaid databases which our team has access to and gather data through the same. This includes examining of listed companies’ annual reports, Journals, SEC filling etc. Apart from this our team has access to various associations across the globe across different industries. Lastly, we have exchange relationships with various university as well as individual libraries.

Step 2: Primary Research
When we talk about primary research, it is a type of study in which the researchers collect relevant data samples directly, rather than relying on previously collected data. This type of research is focused on gaining content specific facts that can be sued to solve specific problems. Since the collected data is fresh and first hand therefore it makes the study more accurate and genuine.
We at SNS Insider have divided Primary Research into 2 parts.
Part 1 wherein we interview the KOLs of major players as well as the upcoming ones across various geographic regions. This allows us to have their view over the market scenario and acts as an important tool to come closer to the accurate market numbers. As many as 45 paid and unpaid primary interviews are taken from both the demand and supply side of the industry to make sure we land at an accurate judgement and analysis of the market.
This step involves the triangulation of data wherein our team analyses the interview transcripts, online survey responses and observation of on filed participants. The below mentioned chart should give a better understanding of the part 1 of the primary interview.

Part 2: In this part of primary research the data collected via secondary research and the part 1 of the primary research is validated with the interviews from individual consultants and subject matter experts.
Consultants are those set of people who have at least 12 years of experience and expertise within the industry whereas Subject Matter Experts are those with at least 15 years of experience behind their back within the same space. The data with the help of two main processes i.e., FGDs (Focused Group Discussions) and IDs (Individual Discussions). This gives us a 3rd party nonbiased primary view of the market scenario making it a more dependable one while collation of the data pointers.
Step 3: Data Bank Validation
Once all the information is collected via primary and secondary sources, we run that information for data validation. At our intelligence centre our research heads track a lot of information related to the market which includes the quarterly reports, the daily stock prices, and other relevant information. Our data bank server gets updated every fortnight and that is how the information which we collected using our primary and secondary information is revalidated in real time.

Step 4: QA/QC Process
After all the data collection and validation our team does a final level of quality check and quality assurance to get rid of any unwanted or undesired mistakes. This might include but not limited to getting rid of the any typos, duplication of numbers or missing of any important information. The people involved in this process include technical content writers, research heads and graphics people. Once this process is completed the title gets uploader on our platform for our clients to read it.
Step 5: Final QC/QA Process:
This is the last process and comes when the client has ordered the study. In this process a final QA/QC is done before the study is emailed to the client. Since we believe in giving our clients a good experience of our research studies, therefore, to make sure that we do not lack at our end in any way humanly possible we do a final round of quality check and then dispatch the study to the client.
By Component
Hardware
Software
By Technology
Smart Card
Magnetic Stripe
Near-field communication (NFC)
Optical Character Recognition (OCR)
System
Ticket Vending Machine (TVM)
Ticket Office Machine (TOM)
Fare Gates
IC Cards
Application
Railways & Transportation
Parking
Entertainment
Others (Government, Retail)
Request for Segment Customization as per your Business Requirement: Segment Customization Request
Regional Coverage
North America
US
Canada
Mexico
Europe
Eastern Europe
Poland
Romania
Hungary
Turkey
Rest of Eastern Europe
Western Europe
Germany
France
UK
Italy
Spain
Netherlands
Switzerland
Austria
Rest of Western Europe
Asia Pacific
China
India
Japan
South Korea
Vietnam
Singapore
Australia
Rest of Asia Pacific
Middle East & Africa
Middle East
UAE
Egypt
Saudi Arabia
Qatar
Rest of Middle East
Africa
Nigeria
South Africa
Rest of Africa
Latin America
Brazil
Argentina
Colombia
Rest of Latin America
Request for Country Level Research Report: Country Level Customization Request
Available Customization
With the given market data, SNS Insider offers customization as per the company’s specific needs. The following customization options are available for the report:
Product Analysis
Criss-Cross segment analysis (e.g. Product X Application)
Product Matrix which gives a detailed comparison of product portfolio of each company
Geographic Analysis
Additional countries in any of the regions
Company Information
Detailed analysis and profiling of additional market players (Up to five)
The Automotive Electronic Expansion Valve Market size was $0.79 billion in 2023 and will reach $1.18 billion by 2031 and grow at a CAGR of 5.14% by 2031.
The Power Sport Vehicle Tire Market Size was valued at USD 4.80 billion in 2023 and is expected to reach USD 7.24 billion by 2032, and grow at a CAGR of 4.67% over the forecast period 2024-2032.
The Cell to Pack Battery Market size was estimated at USD 18.53 billion in 2023 & is expected to reach USD 66.94 Bn by 2032 at a CAGR of 15.35% by 2024-2032.
The Head-Up Display Market Size was valued at USD 1.15 billion in 2023 and will reach USD 4.72 billion by 2032 and grow at a CAGR of 17% by 2024-2032
The Automotive Intelligence Park Assist System Market size was valued at USD 10.93 billion in 2023 and is expected to reach USD 25.12 billion by 2031 and grow at a CAGR of 11.05% over the forecast period 2024-2031.
Automotive Active Purge Pump Market Size was valued at USD 94.90 million in 2023 and is expected to reach USD 1910 million by 2031 and grow at a CAGR of 45.73% over the forecast period 2024-2031.

Hi! Click one of our member below to chat on Phone
© 2025 All Rights Reserved by SNS Insider Pvt Ltd


