image

Automated Breach and Attack Simulation Market Size:
Automated Breach and Attack Simulation Market Revenue Analysis

Get More Information on Automated Breach and Attack Simulation Market - Request Sample Report

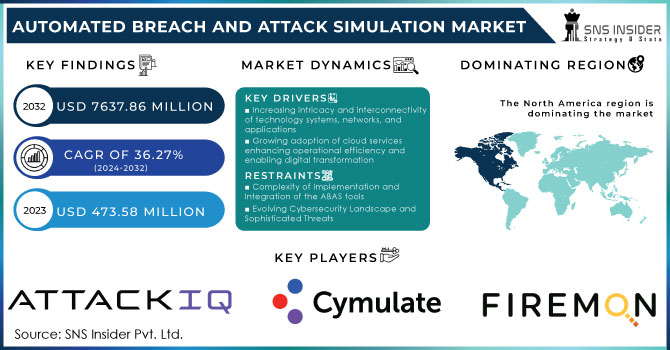
The Automated Breach and Attack Simulation Market size was valued at USD 473.58 million in 2023 and is expected to reach USD 7637.86 million by 2032 and grow at a CAGR of 36.27% over the forecast period 2024-2032.

The automated breach and attack simulation market (ABAS) is growing rapidly due to the increasing number of existing and potential cyber threats that encourage organizations to pay more attention to cybersecurity. The growing number of cyberattacks focused on ransom, phishing, and advanced persistent threats is one of the main drivers of the automated breach and attack simulation market. In 2023, about 57% of companies suffer from phishing attempts, and almost 3.4 billion daily malicious emails are detected, making up nearly 1.2% of all the sent e-mails. The financial losses are estimated to be $17,700 due to phishing scams in 2023.

While data breaches remain a major financial hurdle for organizations, as the average cost has reached a record high of USD 4.45 million in 2023, ransomware attacks cause even higher damage, averaging USD 5.13 million per incident. The country with the highest average cost of a breach is the United States, with USD 9.48 million, followed by the Middle East, which spends USD 8.07 million on average. Moreover, the methods used by the attackers also affect the costs, with phishing being the most expensive initial attack, costing organizations an average of USD 4.9 million per breach for attacks initiated through phishing emails. Finally, breaches of entities with poor compliance practices cost more, with the average being USD 5.05 million in 2023. Therefore, ABAS solutions are highly important because they allow organizations to determine vulnerabilities and test the existing security tools under real-world cyberattack simulation.  

Market Dynamics

Drivers

  • Increasing intricacy and interconnectivity of technology systems, networks, and applications

IT in the modern world is becoming more complex, and organizations often choose several technology solutions like cloud computing, the use of the Internet of Things, and even mobile applications. However, the complexity of their frequent use complicates providing their security, as the traditional approaches to safety do not work in many respects. ABAS tools refer to automated types of security applications and highlight this type of service among other applications for their continuous testing, which determines their advantages in the protection of the growing IT power. Automated BAS tools can simulate adversary actions against various layers of IT, including networks, applications, devices, and even the cloud system. This ability appears to be a benefit due to protection testing for any possible action. Together with this, the test will identify all detectable vulnerabilities, which, in turn, allows for ensuring continuous implementation across the entire attacked surface. The same advantages are related to the use of this type of protection for the annual exhibition area environment, but the automated variant performs better due to its ability to change along with actions.

  • Growing adoption of cloud services enhancing operational efficiency and enabling digital transformation

Cloud computing services have gained widespread acceptance over the years, driving significant changes to the IT environment of organizations by providing them with scalable, flexible, and low-cost systems to match their needs. The global IT industry has been heavily affected by the rapid adoption of cloud computing services, becoming a truly groundbreaking side of today’s IT environment. These services provide companies with scalable, flexible, and easily manageable solutions. In 2023, the number of cloud intrusions has increased by 75%, whereas the cases of compromised cloud data have grown by 110%. Automated BAS tools may help in continuously validating and testing cloud security. Zero trust security is a security framework that is different from the traditional where everything inside the network perimeter is trusted. ABAS tools are essential for testing and validating zero-trust environments and ensuring that they run securely. Such requirements have already been introduced in 24% of companies in 2023, which proves the relevance of such a proactive approach to cyber security.

Restraints

  • Complexity of Implementation and Integration of the ABAS tools

Implementing automated BAS solutions is a complicated and labor-intensive task that becomes one of the leading restraints for clients. The problems are evident both for small organizations and global corporations with complicated and big IT settings. The most significant difficulty is that automated BAS has to be included in the general security system, which consists of security policies, devices, and security specialists. From the system perspective, the BAS tool has to become a part of the particular SIEM platform, which combines data from firewalls, IDS, and other tools. This reflects the whole complexity and the number of different tasks that BAS tools have to solve. At the same time, the complex implementation procedure also hinders the adoption rate, as many organizations do not have professionals to complete Automated BAS solution deployment.

  • The evolving cybersecurity threat landscape continuously changing and an increasingly sophisticated array of cyber threats

The threat landscape in cybersecurity is not still and continues to evolve with time. As such, new attack methods are being developed commonly and frequently. Moreover, since the threat landscape is continuously changing, so are the tools that should be able to simulate and arrange these threats change. Hence, the development and maintenance of these tools are directly tied to the rate of development and the appearance of new threats. This implies that monitoring the new and changing threat landscape and adjusting these automated BAS tools is a costly affair. A potential solution is to use AI and ML for developing the Automated BAS solutions. With regular and updated data, AI and ML can be easily developed to identify the threats that are new or emerging and automatically simulate these attacks.

Market Segmentation

By Deployment

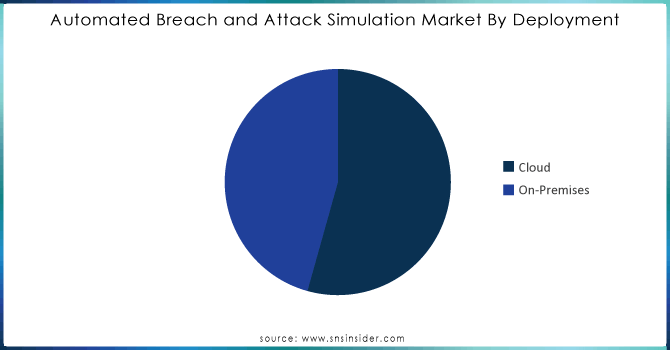
The cloud segment accounted for the largest market share of 54.35% in 2023. Up to 94% of malware is delivered to organizations via email which increases the demand for BAS to simulate the use of this type of commonly used attack vector. The service is used to simulate cyberattacks on an enterprise’s cloud environment on an ongoing basis, allowing the system’s weaknesses to be identified, and the effectiveness of security controls to be proven. The implementation of the service in the form of a cloud-based one makes it scalable and flexible, and, therefore, such a system can be applied by both small and large businesses.

The on-premises segment has a CAGR rate of 36.66% during the forecast period 2024-2032. Security testing might be entirely within an organization’s infrastructure, especially those working in highly regulated industries like healthcare sectors. In February 2024, a ransomware attack was launched on United States health-owned technology company Change Healthcare. A new cybersecurity program has been unveiled by the United States Department of Health and Human Services (HHS) agency to better protect hospitals amid the rising cyber threats affecting the health sector and disrupting patient care. The Advanced Research Projects Agency for Health decided to invest more than $50 million to develop a suite of software that could automatically scan the model hospital environments looking for potential vulnerabilities that hackers might target and come up with solutions as fast as possible to fix it.
Automated-Breach-and-Attack-Simulation-Market-By-Deployment.

Need any customization research on Automated Breach and Attack Simulation Market - Enquiry Now

By Offering

The platform and tools segment dominated the market with a market share of over 62.89% in 2023. The growth is driven by the ease of tools’ implementation into the existing framework. Smooth implementation of various platforms and tools improves their security setting without switching to an entirely new infrastructure and makes the usage of automated breach and attack simulation tools more appealing. For example, AttackIQ is a leader in BAS technologies, and its full-stack platform includes a library of pre-built attack simulations and gives one the ability to create custom attacks.

The services segment is the fastest-growing with a CAGR of 36.67% during the forecast period 2024-2032. The lack of the in-house needed expertise or resources represents a problem for security testing with the periodicity required to properly protect companies, especially SMBs. In 2023, 41% of small businesses were hit by ransomware, which is nearly double the 22% observed in 2021. Further, 95% of SMB incidents in cybersecurity cost firms from $826 to $653,587. Lastly, in the past 12 months, US small and mid businesses have paid over $16,000 in cyber ransoms. The service providers can fill in the gap and they are known for scalable and affordable solutions that can make regular simulations.

By Application

The configured management segment led the market and accounted for a share of 36.02% in 2023. Configuration management tools are software that enhances the stability and agility of a system. They are designed to automate the management and tracking of IT infrastructure. It assists DevOps teams by automating the provisioning, configuration, and deployment of software and hardware resources across diverse environments. For Instance, Puppet Enterprise delivers the tools businesses need to manage secure infrastructure more efficiently at the scale of secure solutions through its agent-based automation.

The patch management segment is expected to grow at a CAGR of 36.90% during 2024-2032. According to Microsoft, 80% of cyberattacks happen because of unpatched software vulnerabilities. From a survey of 500 organizations, 75% of them think that they are vulnerable to any cyber-attacks because of the unpatched software they are using now. Patch management applications of automated breach and attack simulation tools continue to be used by organizations to ensure that all devices are updated with the necessary security patches at all times.

By End User

The enterprises and data centers segment held a market share of over 61.29% in 2023. The creation of new tools and increasingly complicated threats determine a more proactive approach to identifying vulnerabilities that can be exploited by cybercriminals. The total breaches triggered by the ransomware attack reduced by 41% in 2023. It is still important to improve approaches and implement special practices with the help of which the number of cases might be this small.

The managed service providers segment is expected to grow at 36.73% CAGR during the forecast period. These providers are responsible for the overall management of multiple client organizations’ IT infrastructure and the security of this infrastructure. The reliance of different entities on the managed service providers increases sales and requests for the implementation of testing mechanisms to ensure the overall reliability of defense.  

Regional Analysis

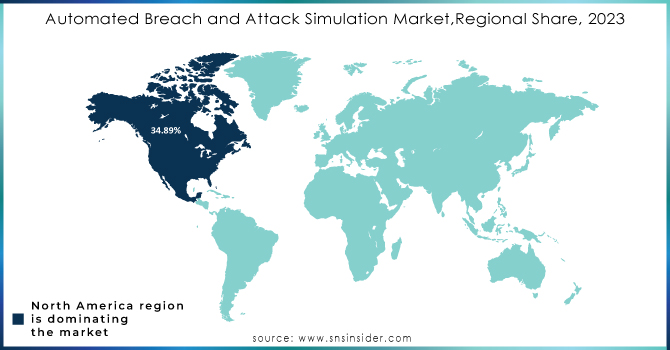
North America held the major share of over 34.89% in 2023 and dominates the market. Better awareness about cybersecurity risks among regional enterprises is driving the growth of the market across the region, especially the U.S. is showing substantial market growth. The increasing complexity of the IT environment is the major driving factor influencing the growth of the market in the U.S. In 2023, around 100+ cases were filed in the U.S. for data breaches in top IT companies, which has consequently affected around 15 million people. ABAS tools aim at continuous and automated testing of all the security controls across the diverse IT environments of enterprises to identify and fix the actual security vulnerabilities in real-time.

Asia Pacific is expected to grow fast at a CAGR of 36.70% in the forecast period 2024-2032. System intrusion, social engineering, and basic web application attacks represent 95% of breaches in APAC. As the number of cyberattacks rises, the vital economic sectors of Asia become more susceptible to the threat. The most frequent victims of cyberattacks included government agencies, industrial, and IT companies, and financial institutions. Out of the mentioned organizations, government agencies were the most affected, as they were targeted in 22% of the total. Moreover, the emergence of SMEs across the region is also augmenting the growth of the market, as SMEs are now implementing feasible automated breach and attack simulation tools to safeguard their digital assets and customer data from evolving cyber risks.
Automated-Breach-and-Attack-Simulation-MarketRegional-Share-2023

Key Players

The major market players are AttackIQ, Cymulate, IronNet Inc., CronusCyber.Com, FireMon LLC, Keysight Technologies, Mandiant, Qualys Inc., Rapid7, Scythe, ReliaQuest LLC, SafeBreach Inc., Sophos Inc., XM Cyber, Skybox Security Inc., Verodin, NopSec, CyCognito, Aujas, BitDam, Phoenix Datacom, Picus Security, Balbis, GuardiCore, and others.

Recent Development

  • Picus Security (December 2023): Launched a new channel partner program to simplify partnerships with VARs and help MSSPs add a differentiating offering to their lineups.

  • Skyhawk Security (May 2024): Unveiled a cloud-native Continuous Threat Exposure Management (CTEM) solution, empowering organizations to automate their CTEM program and operationalize it through the AI-based Synthesis Security Platform.

  • AttackIQ (March 2024): Announced AttackIQ Ready! 2.0, a managed breach and attack simulation-as-a-service combining fully automated and on-demand adversary emulation testing.

Automated Breach and Attack Simulation Market Scope:

Report Attributes Details
Market Size in 2023 USD 473.58 million
Market Size by 2032 USD 7637.86 million
CAGR CAGR of 36.27% From 2024 to 2032
Base Year 2023
Forecast Period 2024-2032
Historical Data 2020-2022
Report Scope & Coverage Market Size, Segments Analysis, Competitive  Landscape, Regional Analysis, DROC & SWOT Analysis, Forecast Outlook
Key Segments • By Deployment (Cloud, On-premises)
• By Offering (Platforms & Tools, Services)
• By End User (Configured, Patch, Threat, Others)
• By Application (Enterprises & Data Centers, Managed Service Provider)
Regional Analysis/Coverage North America (US, Canada, Mexico), Europe (Eastern Europe [Poland, Romania, Hungary, Turkey, Rest of Eastern Europe] Western Europe] Germany, France, UK, Italy, Spain, Netherlands, Switzerland, Austria, Rest of Western Europe]), Asia Pacific (China, India, Japan, South Korea, Vietnam, Singapore, Australia, Rest of Asia Pacific), Middle East & Africa (Middle East [UAE, Egypt, Saudi Arabia, Qatar, Rest of Middle East], Africa [Nigeria, South Africa, Rest of Africa], Latin America (Brazil, Argentina, Colombia, Rest of Latin America)
Company Profiles AttackIQ, Cymulate, IronNet Inc., CronusCyber.Com, FireMon LLC, Keysight Technologies, Mandiant, Qualys Inc., Rapid7, Scythe, ReliaQuest LLC, SafeBreach Inc., Sophos Inc., XM Cyber, Skybox Security Inc., Verodin, NopSec, CyCognito, Aujas, BitDam, Phoenix Datacom, Picus Security, Balbis, GuardiCore
Key Drivers • Increasing intricacy and interconnectivity of technology systems, networks, and applications
• Growing adoption of cloud services enhancing operational efficiency and enabling digital transformation
RESTRAINTS • Complexity of Implementation and Integration of the ABAS tools
• The evolving cybersecurity threat landscape continuously changing and an increasingly sophisticated array of cyber threats

Frequently Asked Questions

Ans:  The Automated Breach and Attack Simulation Market is expected to grow at a CAGR of 36.27%.

Ans: Automated Breach and Attack Simulation Market size was USD 473.58 million in 2023 and is expected to reach USD 7637.86 million by 2032.

Ans: Increasing intricacy and interconnectivity of technology systems, networks, and applications drives the ABAS Market.

Ans: The Cloud segment by deployment dominates the automated breach and attack simulation market.

Ans: North America is the dominating region in the Automated Breach and Attack Simulation Market.

TABLE OF CONTENTS

1. Introduction

1.1 Market Definition

1.2 Scope

1.3 Research Assumptions

2. Industry Flowchart

3. Research Methodology

4. Market Dynamics

4.1 Drivers

4.2 Restraints

4.3 Opportunities

4.4 Challenges

5. Porter’s 5 Forces Model

6. Pest Analysis

7. Automated Breach and Attack Simulation Market Segmentation, By Deployment

7.1 Introduction

7.2 Cloud

7.3 On-Premises

8. Automated Breach and Attack Simulation Market Segmentation, By Offering

8.1 Introduction

8.2 Platforms and Tools

8.3 Services

9. Automated Breach and Attack Simulation Market Segmentation, By Application

9.1 Introduction

9.2 Configured Management

9.3 Patch Management

9.4 Threat Management

9.5 Others

10. Automated Breach and Attack Simulation Market Segmentation, By End User

10.1 Introduction

10.2 Enterprises and Data Centers

10.3 Managed Service providers

11. Regional Analysis

11.1 Introduction

11.2 North America

11.2.1 Trend Analysis

11.2.2 North America Automated Breach and Attack Simulation Market by Country

11.2.3 North America Automated Breach and Attack Simulation Market By Deployment

11.2.4 North America Automated Breach and Attack Simulation Market By Offering

11.2.5 North America Automated Breach and Attack Simulation Market By Application

11.2.6 North America Automated Breach and Attack Simulation Market By End User

11.2.7 USA

11.2.7.1 USA Automated Breach and Attack Simulation Market By Deployment

11.2.7.2 USA Automated Breach and Attack Simulation Market By Offering

11.2.7.3 USA Automated Breach and Attack Simulation Market By Application

11.2.7.4 USA Automated Breach and Attack Simulation Market By End User

11.2.8 Canada

11.2.8.1 Canada Automated Breach and Attack Simulation Market By Deployment

11.2.8.2 Canada Automated Breach and Attack Simulation Market By Offering

11.2.8.3 Canada Automated Breach and Attack Simulation Market By Application

11.2.8.4 Canada Automated Breach and Attack Simulation Market By End User

11.2.9 Mexico

11.2.9.1 Mexico Automated Breach and Attack Simulation Market By Deployment

11.2.9.2 Mexico Automated Breach and Attack Simulation Market By Offering

11.2.9.3 Mexico Automated Breach and Attack Simulation Market By Application

11.2.9.4 Mexico Automated Breach and Attack Simulation Market By End User

11.3 Europe

11.3.1 Trend Analysis

11.3.2 Eastern Europe

11.3.2.1 Eastern Europe Automated Breach and Attack Simulation Market by Country

11.3.2.2 Eastern Europe Automated Breach and Attack Simulation Market By Deployment

11.3.2.3 Eastern Europe Automated Breach and Attack Simulation Market By Offering

11.3.2.4 Eastern Europe Automated Breach and Attack Simulation Market By Application

11.3.2.5 Eastern Europe Automated Breach and Attack Simulation Market By End User

11.3.2.6 Poland

11.3.2.6.1 Poland Automated Breach and Attack Simulation Market By Deployment

11.3.2.6.2 Poland Automated Breach and Attack Simulation Market By Offering

11.3.2.6.3 Poland Automated Breach and Attack Simulation Market By Application

11.3.2.6.4 Poland Automated Breach and Attack Simulation Market By End User

11.3.2.7 Romania

11.3.2.7.1 Romania Automated Breach and Attack Simulation Market By Deployment

11.3.2.7.2 Romania Automated Breach and Attack Simulation Market By Offering

11.3.2.7.3 Romania Automated Breach and Attack Simulation Market By Application

11.3.2.7.4 Romania Automated Breach and Attack Simulation Market By End User

11.3.2.8 Hungary

11.3.2.8.1 Hungary Automated Breach and Attack Simulation Market By Deployment

11.3.2.8.2 Hungary Automated Breach and Attack Simulation Market By Offering

11.3.2.8.3 Hungary Automated Breach and Attack Simulation Market By Application

11.3.2.8.4 Hungary Automated Breach and Attack Simulation Market By End User

11.3.2.9 Turkey

11.3.2.9.1 Turkey Automated Breach and Attack Simulation Market By Deployment

11.3.2.9.2 Turkey Automated Breach and Attack Simulation Market By Offering

11.3.2.9.3 Turkey Automated Breach and Attack Simulation Market By Application

11.3.2.9.4 Turkey Automated Breach and Attack Simulation Market By End User

11.3.2.10 Rest of Eastern Europe

11.3.2.10.1 Rest of Eastern Europe Automated Breach and Attack Simulation Market By Deployment

11.3.2.10.2 Rest of Eastern Europe Automated Breach and Attack Simulation Market By Offering

11.3.2.10.3 Rest of Eastern Europe Automated Breach and Attack Simulation Market By Application

11.3.2.10.4 Rest of Eastern Europe Automated Breach and Attack Simulation Market By End User

11.3.3 Western Europe

11.3.3.1 Western Europe Automated Breach and Attack Simulation Market by Country

11.3.3.2 Western Europe Automated Breach and Attack Simulation Market By Deployment

11.3.3.3 Western Europe Automated Breach and Attack Simulation Market By Offering

11.3.3.4 Western Europe Automated Breach and Attack Simulation Market By Application

11.3.3.5 Western Europe Automated Breach and Attack Simulation Market By End User

11.3.3.6 Germany

11.3.3.6.1 Germany Automated Breach and Attack Simulation Market By Deployment

11.3.3.6.2 Germany Automated Breach and Attack Simulation Market By Offering

11.3.3.6.3 Germany Automated Breach and Attack Simulation Market By Application

11.3.3.6.4 Germany Automated Breach and Attack Simulation Market By End User

11.3.3.7 France

11.3.3.7.1 France Automated Breach and Attack Simulation Market By Deployment

11.3.3.7.2 France Automated Breach and Attack Simulation Market By Offering

11.3.3.7.3 France Automated Breach and Attack Simulation Market By Application

11.3.3.7.4 France Automated Breach and Attack Simulation Market By End User

11.3.3.8 UK

11.3.3.8.1 UK Automated Breach and Attack Simulation Market By Deployment

11.3.3.8.2 UK Automated Breach and Attack Simulation Market By Offering

11.3.3.8.3 UK Automated Breach and Attack Simulation Market By Application

11.3.3.8.4 UK Automated Breach and Attack Simulation Market By End User

11.3.3.9 Italy

11.3.3.9.1 Italy Automated Breach and Attack Simulation Market By Deployment

11.3.3.9.2 Italy Automated Breach and Attack Simulation Market By Offering

11.3.3.9.3 Italy Automated Breach and Attack Simulation Market By Application

11.3.3.9.4 Italy Automated Breach and Attack Simulation Market By End User

11.3.3.10 Spain

11.3.3.10.1 Spain Automated Breach and Attack Simulation Market By Deployment

11.3.3.10.2 Spain Automated Breach and Attack Simulation Market By Offering

11.3.3.10.3 Spain Automated Breach and Attack Simulation Market By Application

11.3.3.10.4 Spain Automated Breach and Attack Simulation Market By End User

11.3.3.11 Netherlands

11.3.3.11.1 Netherlands Automated Breach and Attack Simulation Market By Deployment

11.3.3.11.2 Netherlands Automated Breach and Attack Simulation Market By Offering

11.3.3.11.3 Netherlands Automated Breach and Attack Simulation Market By Application

11.3.3.11.4 Netherlands Automated Breach and Attack Simulation Market By End User

11.3.3.12 Switzerland

11.3.3.12.1 Switzerland Automated Breach and Attack Simulation Market By Deployment

11.3.3.12.2 Switzerland Automated Breach and Attack Simulation Market By Offering

11.3.3.12.3 Switzerland Automated Breach and Attack Simulation Market By Application

11.3.3.12.4 Switzerland Automated Breach and Attack Simulation Market By End User

11.3.3.13 Austria

11.3.3.13.1 Austria Automated Breach and Attack Simulation Market By Deployment

11.3.3.13.2 Austria Automated Breach and Attack Simulation Market By Offering

11.3.3.13.3 Austria Automated Breach and Attack Simulation Market By Application

11.3.3.13.4 Austria Automated Breach and Attack Simulation Market By End User

11.3.3.14 Rest of Western Europe

11.3.3.14.1 Rest of Western Europe Automated Breach and Attack Simulation Market By Deployment

11.3.3.14.2 Rest of Western Europe Automated Breach and Attack Simulation Market By Offering

11.3.3.14.3 Rest of Western Europe Automated Breach and Attack Simulation Market By Application

11.3.3.14.4 Rest of Western Europe Automated Breach and Attack Simulation Market By End User

11.4 Asia-Pacific

11.4.1 Trend Analysis

11.4.2 Asia-Pacific Automated Breach and Attack Simulation Market by Country

11.4.3 Asia-Pacific Automated Breach and Attack Simulation Market By Deployment

11.4.4 Asia-Pacific Automated Breach and Attack Simulation Market By Offering

11.4.5 Asia-Pacific Automated Breach and Attack Simulation Market By Application

11.4.6 Asia-Pacific Automated Breach and Attack Simulation Market By End User

11.4.7 China

11.4.7.1 China Automated Breach and Attack Simulation Market By Deployment

11.4.7.2 China Automated Breach and Attack Simulation Market By Offering

11.4.7.3 China Automated Breach and Attack Simulation Market By Application

11.4.7.4 China Automated Breach and Attack Simulation Market By End User

11.4.8 India

11.4.8.1 India Automated Breach and Attack Simulation Market By Deployment

11.4.8.2 India Automated Breach and Attack Simulation Market By Offering

11.4.8.3 India Automated Breach and Attack Simulation Market By Application

11.4.8.4 India Automated Breach and Attack Simulation Market By End User

11.4.9 Japan

11.4.9.1 Japan Automated Breach and Attack Simulation Market By Deployment

11.4.9.2 Japan Automated Breach and Attack Simulation Market By Offering

11.4.9.3 Japan Automated Breach and Attack Simulation Market By Application

11.4.9.4 Japan Automated Breach and Attack Simulation Market By End User

11.4.10 South Korea

11.4.10.1 South Korea Automated Breach and Attack Simulation Market By Deployment

11.4.10.2 South Korea Automated Breach and Attack Simulation Market By Offering

11.4.10.3 South Korea Automated Breach and Attack Simulation Market By Application

11.4.10.4 South Korea Automated Breach and Attack Simulation Market By End User

11.4.11 Vietnam

11.4.11.1 Vietnam Automated Breach and Attack Simulation Market By Deployment

11.4.11.2 Vietnam Automated Breach and Attack Simulation Market By Offering

11.4.11.3 Vietnam Automated Breach and Attack Simulation Market By Application

11.4.11.4 Vietnam Automated Breach and Attack Simulation Market By End User

11.4.12 Singapore

11.4.12.1 Singapore Automated Breach and Attack Simulation Market By Deployment

11.4.12.2 Singapore Automated Breach and Attack Simulation Market By Offering

11.4.12.3 Singapore Automated Breach and Attack Simulation Market By Application

11.4.12.4 Singapore Automated Breach and Attack Simulation Market By End User

11.4.13 Australia

11.4.13.1 Australia Automated Breach and Attack Simulation Market By Deployment

11.4.13.2 Australia Automated Breach and Attack Simulation Market By Offering

11.4.13.3 Australia Automated Breach and Attack Simulation Market By Application

11.4.13.4 Australia Automated Breach and Attack Simulation Market By End User

11.4.14 Rest of Asia-Pacific

11.4.14.1 Rest of Asia-Pacific Automated Breach and Attack Simulation Market By Deployment

11.4.14.2 Rest of Asia-Pacific Automated Breach and Attack Simulation Market By Offering

11.4.14.3 Rest of Asia-Pacific Automated Breach and Attack Simulation Market By Application

11.4.14.4 Rest of Asia-Pacific Automated Breach and Attack Simulation Market By End User

11.5 Middle East & Africa

11.5.1 Trend Analysis

11.5.2 Middle East

11.5.2.1 Middle East Automated Breach and Attack Simulation Market by Country

11.5.2.2 Middle East Automated Breach and Attack Simulation Market By Deployment

11.5.2.3 Middle East Automated Breach and Attack Simulation Market By Offering

11.5.2.4 Middle East Automated Breach and Attack Simulation Market By Application

11.5.2.5 Middle East Automated Breach and Attack Simulation Market By End User

11.5.2.6 UAE

11.5.2.6.1 UAE Automated Breach and Attack Simulation Market By Deployment

11.5.2.6.2 UAE Automated Breach and Attack Simulation Market By Offering

11.5.2.6.3 UAE Automated Breach and Attack Simulation Market By Application

11.5.2.6.4 UAE Automated Breach and Attack Simulation Market By End User

11.5.2.7 Egypt

11.5.2.7.1 Egypt Automated Breach and Attack Simulation Market By Deployment

11.5.2.7.2 Egypt Automated Breach and Attack Simulation Market By Offering

11.5.2.7.3 Egypt Automated Breach and Attack Simulation Market By Application

11.5.2.7.4 Egypt Automated Breach and Attack Simulation Market By End User

11.5.2.8 Saudi Arabia

11.5.2.8.1 Saudi Arabia Automated Breach and Attack Simulation Market By Deployment

11.5.2.8.2 Saudi Arabia Automated Breach and Attack Simulation Market By Offering

11.5.2.8.3 Saudi Arabia Automated Breach and Attack Simulation Market By Application

11.5.2.8.4 Saudi Arabia Automated Breach and Attack Simulation Market By End User

11.5.2.9 Qatar

11.5.2.9.1 Qatar Automated Breach and Attack Simulation Market By Deployment

11.5.2.9.2 Qatar Automated Breach and Attack Simulation Market By Offering

11.5.2.9.3 Qatar Automated Breach and Attack Simulation Market By Application

11.5.2.9.4 Qatar Automated Breach and Attack Simulation Market By End User

11.5.2.10 Rest of Middle East

11.5.2.10.1 Rest of Middle East Automated Breach and Attack Simulation Market By Deployment

11.5.2.10.2 Rest of Middle East Automated Breach and Attack Simulation Market By Offering

11.5.2.10.3 Rest of Middle East Automated Breach and Attack Simulation Market By Application

11.5.2.10.4 Rest of Middle East Automated Breach and Attack Simulation Market By End User

11.5.3 Africa

11.5.3.1 Africa Automated Breach and Attack Simulation Market by Country

11.5.3.2 Africa Automated Breach and Attack Simulation Market By Deployment

11.5.3.3 Africa Automated Breach and Attack Simulation Market By Offering

11.5.3.4 Africa Automated Breach and Attack Simulation Market By Application

11.5.3.5 Africa Automated Breach and Attack Simulation Market By End User

11.5.3.6 Nigeria

11.5.3.6.1 Nigeria Automated Breach and Attack Simulation Market By Deployment

11.5.3.6.2 Nigeria Automated Breach and Attack Simulation Market By Offering

11.5.3.6.3 Nigeria Automated Breach and Attack Simulation Market By Application

11.5.3.6.4 Nigeria Automated Breach and Attack Simulation Market By End User

11.5.3.7 South Africa

11.5.3.7.1 South Africa Automated Breach and Attack Simulation Market By Deployment

11.5.3.7.2 South Africa Automated Breach and Attack Simulation Market By Offering

11.5.3.7.3 South Africa Automated Breach and Attack Simulation Market By Application

11.5.3.7.4 South Africa Automated Breach and Attack Simulation Market By End User

11.5.3.8 Rest of Africa

11.5.3.8.1 Rest of Africa Automated Breach and Attack Simulation Market By Deployment

11.5.3.8.2 Rest of Africa Automated Breach and Attack Simulation Market By Offering

11.5.3.8.3 Rest of Africa Automated Breach and Attack Simulation Market By Application

11.5.3.8.4 Rest of Africa Automated Breach and Attack Simulation Market By End User

11.6 Latin America

11.6.1 Trend Analysis

11.6.2 Latin America Automated Breach and Attack Simulation Market by Country

11.6.3 Latin America Automated Breach and Attack Simulation Market By Deployment

11.6.4 Latin America Automated Breach and Attack Simulation Market By Offering

11.6.5 Latin America Automated Breach and Attack Simulation Market By Application

11.6.6 Latin America Automated Breach and Attack Simulation Market By End User

11.6.7 Brazil

11.6.7.1 Brazil Automated Breach and Attack Simulation Market By Deployment

11.6.7.2 Brazil Automated Breach and Attack Simulation Market By Offering

11.6.7.3 Brazil Automated Breach and Attack Simulation Market By Application

11.6.7.4 Brazil Automated Breach and Attack Simulation Market By End User

11.6.8 Argentina

11.6.8.1 Argentina Automated Breach and Attack Simulation Market By Deployment

11.6.8.2 Argentina Automated Breach and Attack Simulation Market By Offering

11.6.8.3 Argentina Automated Breach and Attack Simulation Market By Application

11.6.8.4 Argentina Automated Breach and Attack Simulation Market By End User

11.6.9 Colombia

11.6.9.1 Colombia Automated Breach and Attack Simulation Market By Deployment

11.6.9.2 Colombia Automated Breach and Attack Simulation Market By Offering

11.6.9.3 Colombia Automated Breach and Attack Simulation Market By Application

11.6.9.4 Colombia Automated Breach and Attack Simulation Market By End User

11.6.10 Rest of Latin America

11.6.10.1 Rest of Latin America Automated Breach and Attack Simulation Market By Deployment

11.6.10.2 Rest of Latin America Automated Breach and Attack Simulation Market By Offering

11.6.10.3 Rest of Latin America Automated Breach and Attack Simulation Market By Application

11.6.10.4 Rest of Latin America Automated Breach and Attack Simulation Market By End User

12. Company Profiles

12.1 AttackIQ

12.1.1 Company Overview

12.1.2 Financial

12.1.3 Products/ Services Offered

12.1.4 The SNS View

12.2 Cymulate

12.2.1 Company Overview

12.2.2 Financial

12.2.3 Products/ Services Offered

12.2.4 The SNS View

12.3 IronNet Inc.

12.3.1 Company Overview

12.3.2 Financial

12.3.3 Products/ Services Offered

12.3.4 The SNS View

12.4 CronusCyber.Com

12.4.1 Company Overview

12.4.2 Financial

12.4.3 Products/ Services Offered

12.4.4 The SNS View

12.5 FireMon LLC

12.5.1 Company Overview

12.5.2 Financial

12.5.3 Products/ Services Offered

12.5.4 The SNS View

12.6 Keysight Technologies

12.6.1 Company Overview

12.6.2 Financial

12.6.3 Products/ Services Offered

12.6.4 The SNS View

12.7 Mandiant

12.7.1 Company Overview

12.7.2 Financial

12.7.3 Products/ Services Offered

12.7.4 The SNS View

12.8 Qualys Inc.

12.8.1 Company Overview

12.8.2 Financial

12.8.3 Products/ Services Offered

12.8.4 The SNS View

12.9 Rapid7

12.9.1 Company Overview

12.9.2 Financial

12.9.3 Products/ Services Offered

12.9.4 The SNS View

12.10 Scythe

12.10.1 Company Overview

12.10.2 Financial

12.10.3 Products/ Services Offered

12.10.4 The SNS View

13. Competitive Landscape

13.1 Competitive Benchmarking

13.2 Market Share Analysis

13.3 Recent Developments

13.3.1 Industry News

13.3.2 Company News

13.3.3 Mergers & Acquisitions

14. Use Case and Best Practices

15. Conclusion

An accurate research report requires proper strategizing as well as implementation. There are multiple factors involved in the completion of good and accurate research report and selecting the best methodology to compete the research is the toughest part. Since the research reports we provide play a crucial role in any company’s decision-making process, therefore we at SNS Insider always believe that we should choose the best method which gives us results closer to reality. This allows us to reach at a stage wherein we can provide our clients best and accurate investment to output ratio.

Each report that we prepare takes a timeframe of 350-400 business hours for production. Starting from the selection of titles through a couple of in-depth brain storming session to the final QC process before uploading our titles on our website we dedicate around 350 working hours. The titles are selected based on their current market cap and the foreseen CAGR and growth.


The 5 steps process:

Step 1: Secondary Research:

Secondary Research or Desk Research is as the name suggests is a research process wherein, we collect data through the readily available information. In this process we use various paid and unpaid databases which our team has access to and gather data through the same. This includes examining of listed companies’ annual reports, Journals, SEC filling etc. Apart from this our team has access to various associations across the globe across different industries. Lastly, we have exchange relationships with various university as well as individual libraries.

Secondary Research

Step 2: Primary Research

When we talk about primary research, it is a type of study in which the researchers collect relevant data samples directly, rather than relying on previously collected data.  This type of research is focused on gaining content specific facts that can be sued to solve specific problems. Since the collected data is fresh and first hand therefore it makes the study more accurate and genuine.

We at SNS Insider have divided Primary Research into 2 parts.

Part 1 wherein we interview the KOLs of major players as well as the upcoming ones across various geographic regions. This allows us to have their view over the market scenario and acts as an important tool to come closer to the accurate market numbers. As many as 45 paid and unpaid primary interviews are taken from both the demand and supply side of the industry to make sure we land at an accurate judgement and analysis of the market.

This step involves the triangulation of data wherein our team analyses the interview transcripts, online survey responses and observation of on filed participants. The below mentioned chart should give a better understanding of the part 1 of the primary interview.

Primary Research

Part 2: In this part of primary research the data collected via secondary research and the part 1 of the primary research is validated with the interviews from individual consultants and subject matter experts.

Consultants are those set of people who have at least 12 years of experience and expertise within the industry whereas Subject Matter Experts are those with at least 15 years of experience behind their back within the same space. The data with the help of two main processes i.e., FGDs (Focused Group Discussions) and IDs (Individual Discussions). This gives us a 3rd party nonbiased primary view of the market scenario making it a more dependable one while collation of the data pointers.

Step 3: Data Bank Validation

Once all the information is collected via primary and secondary sources, we run that information for data validation. At our intelligence centre our research heads track a lot of information related to the market which includes the quarterly reports, the daily stock prices, and other relevant information. Our data bank server gets updated every fortnight and that is how the information which we collected using our primary and secondary information is revalidated in real time.

Data Bank Validation

Step 4: QA/QC Process

After all the data collection and validation our team does a final level of quality check and quality assurance to get rid of any unwanted or undesired mistakes. This might include but not limited to getting rid of the any typos, duplication of numbers or missing of any important information. The people involved in this process include technical content writers, research heads and graphics people. Once this process is completed the title gets uploader on our platform for our clients to read it.

Step 5: Final QC/QA Process:

This is the last process and comes when the client has ordered the study. In this process a final QA/QC is done before the study is emailed to the client. Since we believe in giving our clients a good experience of our research studies, therefore, to make sure that we do not lack at our end in any way humanly possible we do a final round of quality check and then dispatch the study to the client.

Key Segments:

By Deployment

  • Cloud

  • On-Premises

By Offering

  • Platforms and Tools

  • Services

By Application

  • Configured Management

  • Patch Management

  • Threat Management

  • Others

By End User

  • Enterprises and Data Centers

  • Managed Service providers

Request for Segment Customization as per your Business Requirement: Segment Customization Request

REGIONAL COVERAGE:

North America

  • US

  • Canada

  • Mexico

Europe

  • Eastern Europe

    • Poland

    • Romania

    • Hungary

    • Turkey

    • Rest of Eastern Europe

  • Western Europe

    • Germany

    • France

    • UK

    • Italy

    • Spain

    • Netherlands

    • Switzerland

    • Austria

    • Rest of Western Europe

Asia Pacific

  • China

  • India

  • Japan

  • South Korea

  • Vietnam

  • Singapore

  • Australia

  • Rest of Asia Pacific

Middle East & Africa

  • Middle East

    • UAE

    • Egypt

    • Saudi Arabia

    • Qatar

    • Rest of the Middle East

  • Africa

    • Nigeria

    • South Africa

    • Rest of Africa

Latin America

  • Brazil

  • Argentina

  • Colombia

Request for Country Level Research Report: Country Level Customization Request

Available Customization

With the given market data, SNS Insider offers customization as per the company’s specific needs. The following customization options are available for the report:

  • Product Analysis

  • Criss-Cross segment analysis (e.g. Product X Application)

  • Product Matrix which gives a detailed comparison of the product portfolio of each company

  • Geographic Analysis

  • Additional countries in any of the regions

  • Company Information

  • Detailed analysis and profiling of additional market players (Up to five)


  •            5000 (33% Discount)


  •            8950 (40% Discount)


  •            3050 (23% Discount)

Start a Conversation

Hi! Click one of our member below to chat on Phone