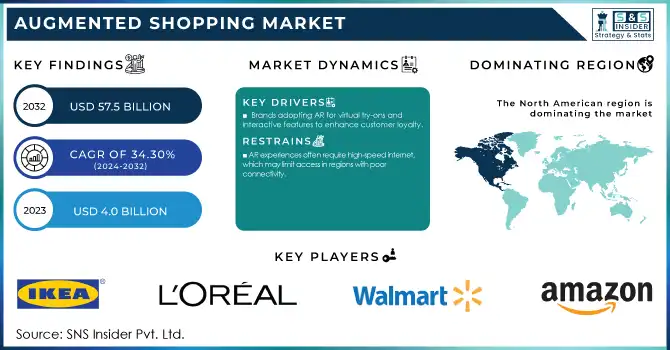
The Augmented Shopping Market was valued at USD 4.0 Billion in 2023 and is expected to reach USD 57.5 Billion by 2032, growing at a CAGR of 34.30% from 2024-2032.
To get more information on Augmented Shopping Market - Request Free Sample Report
Technological advancements and evolving consumer behaviors are set to drive strong growth in an Augmented Shopping Market. Augmented Reality and Virtual Reality will turn consumers' shopping experiences upside down as consumers can visualize the products in front of their eyes and their environments. It has transformed the way consumers engage and convert in the market, making it an essential component in the growth of the Consumer Experience market where immersion in content makes an impression. With the growth of e-commerce, there is a growing need for interactive shopping experiences that connect online users with brick-and-mortar stores. This is where augmented shopping solutions come in — they provide a seamless mix of online shopping convenience and the tactile sensation of shopping in a physical store.
Increasing consumer inclination toward personalized shopping experiences is another key factor fuelling the demand for augmented shopping in the world market. AR technologies provide retailers with the means to offer personalized product recommendations as well as augmented try-ons, increasing customer satisfaction and loyalty. By offering augmented shopping solutions, retailers are setting themselves apart from the competition, enticing and retaining customers through creative, experience-focused interactions. In addition to this, the proliferation of smartphones and tablets has made augmented shopping applications easier and more convenient to use, leading to rapid adoption.
A growing trend in the augmented shopping space is evident from the recent developments. As an example, augmented reality features such as virtual try-ons have been implemented by many brands including, Nars Cosmetics. Moreover, virtual stores – in particular, those inside Roblox – are changing the very nature of retail. These interactive stores, which enable physical goods to be sold via a 3D model, create an immersive shopping experience that appeals to buyers. As this demographic grows, expect virtual stores to take off as AI and augmented reality are blended into one electronic shopping experience. The Augmented Shopping Market is poised for significant growth, fuelled by technological advancements, the growing e-commerce boom, and a trend toward personalized and immersive shopping experiences. The augmented shopping market will continue to develop as retailers adopt innovative approaches and consumers are presented with fresh opportunities for engaging shopping experiences.
Market Dynamics
Drivers
Brands adopting AR for virtual try-ons and interactive features to enhance customer loyalty.
The role of brands that are using Augmented Reality for Virtual try-ons and kind of interactive features is changing the shopping experience. With AR tech implementation, retailers are allowing customers to virtually try their products—apparel, accessories, makeup, eyewear, and the like—without any physical touch. This benefits the fashion and beauty industry by helping consumers visualize how products will appear on them in real-time. Brands such as Nars Cosmetics, for example, have released AR tools for customers to try on makeup virtually, creating an interactive personalized experience.
Additionally, AR-enabled virtual try-ons make for a more interactive and immersive shopping experience, which can also enhance customer loyalty. It minimizes the ambiguity that comes with retail on the internet making fewer returns and a confident purchasing decision. Thus, immersive and personalized experiences create an emotional bond between brands and customers that results in repeat and sustained business. In addition, AR allows retailers the opportunity to integrate interactive elements like virtual fitting rooms, product customization, and tailored suggestions. These aspects make the shopping experience more personalized, which adds a layer of exclusivity. As a result, brands that utilize AR can set themselves apart in a saturated marketplace, attract technologically driven shoppers, and foster connections with continuous customers. This trend is likely to drive the sustained growth of the Augmented Shopping Market, with more retailers accepting AR to enhance customer engagement and experience.
Innovations in AR and VR enhance immersive shopping experiences, driving consumer engagement.
The rise of online shopping increases demand for interactive, virtual shopping solutions.
Restraints
AR experiences often require high-speed internet, which may limit access in regions with poor connectivity.
Augmented Reality, relies on the fast and stable internet as an integral part and suffers to perform in poorly connected areas. AR applications in the Augmented Shopping Market typically necessitate solving complex visual data in real-time, rendering 3D models, or having virtual try-on scenarios. The demand for high-bandwidth data transfer that this requires can result in lag, interruptions, or even prevent users in areas with slow or unreliable internet from using certain features.
The whole AR tech potential is not yet realized, which limits the way it works and is being used by some regions, especially where mobile networks and the Internet at large have not yet truly developed, especially in rural or low-bandwidth areas. They would be unable to enjoy the optimal virtual experiences such as trying on clothes, testing makeup, or placing furniture in their homes to see how it would look all together. This can weaken the benefits of AR in improving the shopping experience and make it less attractive in these areas. Slow internet speeds may lead to pixelation or distortion of AR content, also affecting the experience quality. Certainly, for the brands and retailers wanting to leverage AR in their customer shopping experiences, it will be important to keep regional limits in mind and work on optimizing AR applications that will work with lower bandwidths or provide contingency shopping solutions for consumers in zones with poor connectivity. This is a major challenge to overcome for AR to truly become widespread in the global Augmented Shopping Market.
The initial investment required for AR technology and infrastructure can be prohibitive for smaller retailers.
AR experiences may not be seamless across all devices, limiting accessibility for some consumers.
By Component
In 2023, the solutions segment dominated the market and accounted for 69% of revenue share. This can be attributed to the increase in demand for all-in-one AR solutions that can be easily integrated into current e-commerce platforms, mobile apps, and retail stores. There is an immensely growing demand among retailers for end-to-end solutions that cover content creation, software development, deployment, and evergreen support and maintenance. AR solutions additionally assist in offering retailers the one-stop shop, which provides them with the scalability and a customizable AR platform to tailor the app to their distinct business requirements. In addition, allowing retailers to capitalize on AR tech without the need for a high initial investment in in-house development or expertise in this area, appealing across all sizes of business.
The augmented shopping services segment is projected to grow at the fastest CAGR during the forecast period. Massive growth is predicted to be supported by the high demand for specialized services which should allow retailers to successfully combine AR technologies with their operations at the right level. While AR shopping experiences are on the rise, retailers need strategic guidance on AR strategy, content, and implementation to reap the highest rewards of AR adoption. This services segment consisting of consulting, training, maintenance, and support services has emerged solutions for retailers in overcoming the complexities of AR technology for maximizing return on investment.
By Application
The automotive sector dominated the market and represented a significant revenue share. The industry consists of complex and high-value products that require immersive and interactive customer experiences, thus laying a solid foundation for AR adoption. AR has been used by automobile companies and dealers to have customers interact with automobiles virtually, customize cars by viewing features and options, and even go for virtual test drives. As an example in this category, the automaker Toyota developed an AR app based on machine learning and Apple's ARkit. With this app, customers can identify their car using their phone camera and add the accessories virtually, without any requirement of physical markers, resulting in a more interesting and smooth shopping experience. These efforts drive customer engagement as well as enhance sales. A sizeable investment by the automobile sector in digital transformation and customer experience initiatives has made AR a competitive differentiator among automakers.
The footwear segment is set to gain the fastest growth rate between 2024 and 2032. The fashion aspect of footwear aligns perfectly with AR adoption, allowing customers to virtually try shoes, preview alternative styles/colors, or simply provide the perfect fit. Moreover, the competitive environment in this market, coupled with higher return rates of non-gaming physical inventory, has increased retailer investment in solutions to increase customer satisfaction, minimize returns, and gain a competitive advantage.
Regional Analysis
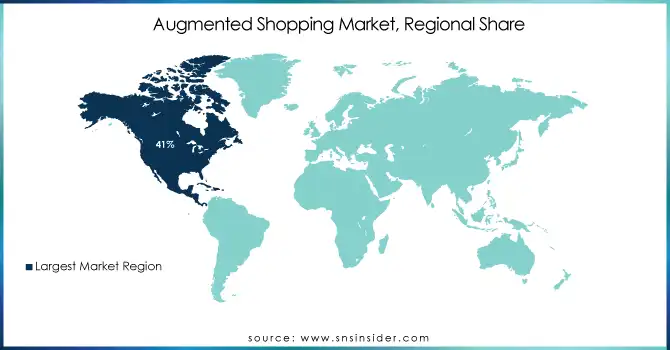
North America dominated the market with a revenue share of 41% in 2023 This can be accounted for by the growing e-commerce sector in the region, the high smartphone penetration rate, and high consumer demand for innovative technology. North America has a mature retail framework complemented by massive investments in digital transformation and customer experience, creating multiple pathways for AR to flourish. Further, a competitive market landscape in this region enforcing retailers to exploit AR as a vital differentiator has contributed to the growing retail AR market demand among in passing year.
The fastest growth over the forecast period is anticipated to be witnessed in the Asia Pacific region. With their rapidly rising economies and growing middle-income urban populations, countries like China, India, and Indonesia are generating attractive growth prospects for retailers. The Growth of AR and Its Adoption by Giants in Social Media and Retail: Taobao by Alibaba Group, JD. In such a scenario, the increasing use of AR solutions by retailers can be attributed to social commerce platforms, such as Xiaohongshu. com, WeChat, and Douyin. We can expect a corresponding increase in the use of innovative techniques such as AR over the next few years, with the optimism surrounding the region's economy.
Get Customized Report as per Your Business Requirement - Enquiry Now
The major key players along with their products are
IKEA – IKEA Place
L'Oreal – L'Oreal Virtual Try-On
Sephora – Sephora Virtual Artist
Nike – Nike Fit
Amazon – Amazon AR View
Walmart – Walmart AR Shopping
Warby Parker – Warby Parker Virtual Try-On
ModiFace – ModiFace AR Beauty Try-On
Zara – Zara AR Experience
Alibaba – Alibaba AR Shopping
ASOS – ASOS Virtual Catwalk
H&M – H&M AR Shopping Experience
Hershey's – Hershey's AR Experience
In 2024, L'Oreal expanded its AR capabilities by introducing an enhanced version of its Virtual Try-On technology, enabling consumers to try on makeup in real-time through their smartphones and integrating AI to offer personalized product recommendations.
Sephora launched a new AR feature in 2024, allowing customers to virtually try on skincare products alongside makeup. This integration of augmented reality with skincare helps users assess how products would perform on their skin tones and types.
|
Report Attributes |
Details |
|
Market Size in 2023 |
USD 4.0 Billion |
|
Market Size by 2032 |
USD 57.5 Billion |
|
CAGR |
CAGR of 34.30% From 2024 to 2032 |
|
Base Year |
2023 |
|
Forecast Period |
2024-2032 |
|
Historical Data |
2020-2022 |
|
Report Scope & Coverage |
Market Size, Segments Analysis, Competitive Landscape, Regional Analysis, DROC & SWOT Analysis, Forecast Outlook |
|
Key Segments |
• By Component (Solutions, Services) |
|
Regional Analysis/Coverage |
North America (US, Canada, Mexico), Europe (Eastern Europe [Poland, Romania, Hungary, Turkey, Rest of Eastern Europe] Western Europe] Germany, France, UK, Italy, Spain, Netherlands, Switzerland, Austria, Rest of Western Europe]), Asia Pacific (China, India, Japan, South Korea, Vietnam, Singapore, Australia, Rest of Asia Pacific), Middle East & Africa (Middle East [UAE, Egypt, Saudi Arabia, Qatar, Rest of Middle East], Africa [Nigeria, South Africa, Rest of Africa], Latin America (Brazil, Argentina, Colombia, Rest of Latin America) |
|
Company Profiles |
IKEA, L'Oreal, Sephora, Nike, Amazon, Walmart, Warby Parker, ModiFace, Zara, Alibaba, ASOS, H&M, Hershey's |
|
Key Drivers |
• Innovations in AR and VR enhance immersive shopping experiences, driving consumer engagement. |
|
RESTRAINTS |
• The initial investment required for AR technology and infrastructure can be prohibitive for smaller retailers. |
Ans. The initial investment required for AR technology and infrastructure can be prohibitive for smaller retailers.
Ans: Innovations in AR and VR enhance immersive shopping experiences, driving consumer engagement.
Ans. Asia-Pacific is expected to register the fastest CAGR during the forecast period.
Ans. The CAGR of the Augmented Shopping Market during the forecast period is 34.30% from 2024-2032.
Ans. The Augmented Shopping Market was valued at USD 4.0 Billion in 2023 and is expected to reach USD 57.5 Billion by 2032.
Table of Content
1. Introduction
1.1 Market Definition
1.2 Scope (Inclusion and Exclusions)
1.3 Research Assumptions
2. Executive Summary
2.1 Market Overview
2.2 Regional Synopsis
2.3 Competitive Summary
3. Research Methodology
3.1 Top-Down Approach
3.2 Bottom-up Approach
3.3. Data Validation
3.4 Primary Interviews
4. Market Dynamics Impact Analysis
4.1 Market Driving Factors Analysis
4.1.2 Drivers
4.1.2 Restraints
4.1.3 Opportunities
4.1.4 Challenges
4.2 PESTLE Analysis
4.3 Porter’s Five Forces Model
5. Statistical Insights and Trends Reporting
5.1 Adoption Rates of Emerging Technologies
5.2 Network Infrastructure Expansion, by Region
5.3 Cybersecurity Incidents, by Region (2020-2023)
5.4 Cloud Services Usage, by Region
6. Competitive Landscape
6.1 List of Major Companies, By Region
6.2 Market Share Analysis, By Region
6.3 Product Benchmarking
6.3.1 Product specifications and features
6.3.2 Pricing
6.4 Strategic Initiatives
6.4.1 Marketing and promotional activities
6.4.2 Distribution and supply chain strategies
6.4.3 Expansion plans and new product launches
6.4.4 Strategic partnerships and collaborations
6.5 Technological Advancements
6.6 Market Positioning and Branding
7. Augmented Shopping Market Segmentation, by Component
7.1 Chapter Overview
7.2 Solutions
7.2.1 Solutions Market Trends Analysis (2020-2032)
7.2.2 Solutions Market Size Estimates and Forecasts to 2032 (USD Billion)
7.3 Services
7.3.1 Services Market Trends Analysis (2020-2032)
7.3.2 Services Market Size Estimates and Forecasts to 2032 (USD Billion)
8. Augmented Shopping Market Segmentation, by Application
8.1 Chapter Overview
8.2 Automotive
8.2.1 Automotive Market Trends Analysis (2020-2032)
8.2.2 Automotive Market Size Estimates and Forecasts to 2032 (USD Billion)
8.3Home Goods & Furniture
8.3.1Home Goods & Furniture Market Trends Analysis (2020-2032)
8.3.2Home Goods & Furniture Market Size Estimates and Forecasts to 2032 (USD Billion)
8.4Beauty & Cosmetics
8.4.1Beauty & Cosmetics Market Trends Analysis (2020-2032)
8.4.2Beauty & Cosmetics Market Size Estimates and Forecasts to 2032 (USD Billion)
8.5 Apparel Fittings
8.5.1Apparel Fittings Market Trends Analysis (2020-2032)
8.5.2Apparel Fittings Market Size Estimates and Forecasts to 2032 (USD Billion)
8.6 Grocery Shopping
8.6.1Grocery Shopping Market Trends Analysis (2020-2032)
8.6.2Grocery Shopping Market Size Estimates and Forecasts to 2032 (USD Billion)
8.7 Footwear
8.7.1Footwear Market Trends Analysis (2020-2032)
8.7.2Footwear Market Size Estimates and Forecasts to 2032 (USD Billion)
8.8 Others
8.8.1Others Market Trends Analysis (2020-2032)
8.8.2 Others Market Size Estimates and Forecasts to 2032 (USD Billion)
9. Regional Analysis
9.1 Chapter Overview
9.2 North America
9.2.1 Trends Analysis
9.2.2 North America Augmented Shopping Market Estimates and Forecasts, by Country (2020-2032) (USD Billion)
9.2.3 North America Augmented Shopping Market Estimates and Forecasts, by Component (2020-2032) (USD Billion)
9.2.4 North America Augmented Shopping Market Estimates and Forecasts, by Application (2020-2032) (USD Billion)
9.2.5 USA
9.2.5.1 USA Augmented Shopping Market Estimates and Forecasts, by Component (2020-2032) (USD Billion)
9.2.5.2 USA Augmented Shopping Market Estimates and Forecasts, by Application (2020-2032) (USD Billion)
9.2.6 Canada
9.2.6.1 Canada Augmented Shopping Market Estimates and Forecasts, by Component (2020-2032) (USD Billion)
9.2.6.2 Canada Augmented Shopping Market Estimates and Forecasts, by Application (2020-2032) (USD Billion)
9.2.7 Mexico
9.2.7.1 Mexico Augmented Shopping Market Estimates and Forecasts, by Component (2020-2032) (USD Billion)
9.2.7.2 Mexico Augmented Shopping Market Estimates and Forecasts, by Application (2020-2032) (USD Billion)
9.3 Europe
9.3.1 Eastern Europe
9.3.1.1 Trends Analysis
9.3.1.2 Eastern Europe Augmented Shopping Market Estimates and Forecasts, by Country (2020-2032) (USD Billion)
9.3.1.3 Eastern Europe Augmented Shopping Market Estimates and Forecasts, by Component (2020-2032) (USD Billion)
9.3.1.4 Eastern Europe Augmented Shopping Market Estimates and Forecasts, by Application (2020-2032) (USD Billion)
9.3.1.5 Poland
9.3.1.5.1 Poland Augmented Shopping Market Estimates and Forecasts, by Component (2020-2032) (USD Billion)
9.3.1.5.2 Poland Augmented Shopping Market Estimates and Forecasts, by Application (2020-2032) (USD Billion)
9.3.1.6 Romania
9.3.1.6.1 Romania Augmented Shopping Market Estimates and Forecasts, by Component (2020-2032) (USD Billion)
9.3.1.6.2 Romania Augmented Shopping Market Estimates and Forecasts, by Application (2020-2032) (USD Billion)
9.3.1.7 Hungary
9.3.1.7.1 Hungary Augmented Shopping Market Estimates and Forecasts, by Component (2020-2032) (USD Billion)
9.3.1.7.2 Hungary Augmented Shopping Market Estimates and Forecasts, by Application (2020-2032) (USD Billion)
9.3.1.8 Turkey
9.3.1.8.1 Turkey Augmented Shopping Market Estimates and Forecasts, by Component (2020-2032) (USD Billion)
9.3.1.8.2 Turkey Augmented Shopping Market Estimates and Forecasts, by Application (2020-2032) (USD Billion)
9.3.1.9 Rest of Eastern Europe
9.3.1.9.1 Rest of Eastern Europe Augmented Shopping Market Estimates and Forecasts, by Component (2020-2032) (USD Billion)
9.3.1.9.2 Rest of Eastern Europe Augmented Shopping Market Estimates and Forecasts, by Application (2020-2032) (USD Billion)
9.3.2 Western Europe
9.3.2.1 Trends Analysis
9.3.2.2 Western Europe Augmented Shopping Market Estimates and Forecasts, by Country (2020-2032) (USD Billion)
9.3.2.3 Western Europe Augmented Shopping Market Estimates and Forecasts, by Component (2020-2032) (USD Billion)
9.3.2.4 Western Europe Augmented Shopping Market Estimates and Forecasts, by Application (2020-2032) (USD Billion)
9.3.2.5 Germany
9.3.2.5.1 Germany Augmented Shopping Market Estimates and Forecasts, by Component (2020-2032) (USD Billion)
9.3.2.5.2 Germany Augmented Shopping Market Estimates and Forecasts, by Application (2020-2032) (USD Billion)
9.3.2.6 France
9.3.2.6.1 France Augmented Shopping Market Estimates and Forecasts, by Component (2020-2032) (USD Billion)
9.3.2.6.2 France Augmented Shopping Market Estimates and Forecasts, by Application (2020-2032) (USD Billion)
9.3.2.7 UK
9.3.2.7.1 UK Augmented Shopping Market Estimates and Forecasts, by Component (2020-2032) (USD Billion)
9.3.2.7.2 UK Augmented Shopping Market Estimates and Forecasts, by Application (2020-2032) (USD Billion)
9.3.2.8 Italy
9.3.2.8.1 Italy Augmented Shopping Market Estimates and Forecasts, by Component (2020-2032) (USD Billion)
9.3.2.8.2 Italy Augmented Shopping Market Estimates and Forecasts, by Application (2020-2032) (USD Billion)
9.3.2.9 Spain
9.3.2.9.1 Spain Augmented Shopping Market Estimates and Forecasts, by Component (2020-2032) (USD Billion)
9.3.2.9.2 Spain Augmented Shopping Market Estimates and Forecasts, by Application (2020-2032) (USD Billion)
9.3.2.10 Netherlands
9.3.2.10.1 Netherlands Augmented Shopping Market Estimates and Forecasts, by Component (2020-2032) (USD Billion)
9.3.2.10.2 Netherlands Augmented Shopping Market Estimates and Forecasts, by Application (2020-2032) (USD Billion)
9.3.2.11 Switzerland
9.3.2.11.1 Switzerland Augmented Shopping Market Estimates and Forecasts, by Component (2020-2032) (USD Billion)
9.3.2.11.2 Switzerland Augmented Shopping Market Estimates and Forecasts, by Application (2020-2032) (USD Billion)
9.3.2.12 Austria
9.3.2.12.1 Austria Augmented Shopping Market Estimates and Forecasts, by Component (2020-2032) (USD Billion)
9.3.2.12.2 Austria Augmented Shopping Market Estimates and Forecasts, by Application (2020-2032) (USD Billion)
9.3.2.13 Rest of Western Europe
9.3.2.13.1 Rest of Western Europe Augmented Shopping Market Estimates and Forecasts, by Component (2020-2032) (USD Billion)
9.3.2.13.2 Rest of Western Europe Augmented Shopping Market Estimates and Forecasts, by Application (2020-2032) (USD Billion)
9.4 Asia Pacific
9.4.1 Trends Analysis
9.4.2 Asia Pacific Augmented Shopping Market Estimates and Forecasts, by Country (2020-2032) (USD Billion)
9.4.3 Asia Pacific Augmented Shopping Market Estimates and Forecasts, by Component (2020-2032) (USD Billion)
9.4.4 Asia Pacific Augmented Shopping Market Estimates and Forecasts, by Application (2020-2032) (USD Billion)
9.4.5 China
9.4.5.1 China Augmented Shopping Market Estimates and Forecasts, by Component (2020-2032) (USD Billion)
9.4.5.2 China Augmented Shopping Market Estimates and Forecasts, by Application (2020-2032) (USD Billion)
9.4.6 India
9.4.5.1 India Augmented Shopping Market Estimates and Forecasts, by Component (2020-2032) (USD Billion)
9.4.5.2 India Augmented Shopping Market Estimates and Forecasts, by Application (2020-2032) (USD Billion)
9.4.5 Japan
9.4.5.1 Japan Augmented Shopping Market Estimates and Forecasts, by Component (2020-2032) (USD Billion)
9.4.5.2 Japan Augmented Shopping Market Estimates and Forecasts, by Application (2020-2032) (USD Billion)
9.4.6 South Korea
9.4.6.1 South Korea Augmented Shopping Market Estimates and Forecasts, by Component (2020-2032) (USD Billion)
9.4.6.2 South Korea Augmented Shopping Market Estimates and Forecasts, by Application (2020-2032) (USD Billion)
9.4.7 Vietnam
9.4.7.1 Vietnam Augmented Shopping Market Estimates and Forecasts, by Component (2020-2032) (USD Billion)
9.2.7.2 Vietnam Augmented Shopping Market Estimates and Forecasts, by Application (2020-2032) (USD Billion)
9.4.8 Singapore
9.4.8.1 Singapore Augmented Shopping Market Estimates and Forecasts, by Component (2020-2032) (USD Billion)
9.4.8.2 Singapore Augmented Shopping Market Estimates and Forecasts, by Application (2020-2032) (USD Billion)
9.4.9 Australia
9.4.9.1 Australia Augmented Shopping Market Estimates and Forecasts, by Component (2020-2032) (USD Billion)
9.4.9.2 Australia Augmented Shopping Market Estimates and Forecasts, by Application (2020-2032) (USD Billion)
9.4.10 Rest of Asia Pacific
9.4.10.1 Rest of Asia Pacific Augmented Shopping Market Estimates and Forecasts, by Component (2020-2032) (USD Billion)
9.4.10.2 Rest of Asia Pacific Augmented Shopping Market Estimates and Forecasts, by Application (2020-2032) (USD Billion)
9.5 Middle East and Africa
9.5.1 Middle East
9.5.1.1 Trends Analysis
9.5.1.2 Middle East Augmented Shopping Market Estimates and Forecasts, by Country (2020-2032) (USD Billion)
9.5.1.3 Middle East Augmented Shopping Market Estimates and Forecasts, by Component (2020-2032) (USD Billion)
9.5.1.4 Middle East Augmented Shopping Market Estimates and Forecasts, by Application (2020-2032) (USD Billion)
9.5.1.5 UAE
9.5.1.5.1 UAE Augmented Shopping Market Estimates and Forecasts, by Component (2020-2032) (USD Billion)
9.5.1.5.2 UAE Augmented Shopping Market Estimates and Forecasts, by Application (2020-2032) (USD Billion)
9.5.1.6 Egypt
9.5.1.6.1 Egypt Augmented Shopping Market Estimates and Forecasts, by Component (2020-2032) (USD Billion)
9.5.1.6.2 Egypt Augmented Shopping Market Estimates and Forecasts, by Application (2020-2032) (USD Billion)
9.5.1.7 Saudi Arabia
9.5.1.7.1 Saudi Arabia Augmented Shopping Market Estimates and Forecasts, by Component (2020-2032) (USD Billion)
9.5.1.7.2 Saudi Arabia Augmented Shopping Market Estimates and Forecasts, by Application (2020-2032) (USD Billion)
9.5.1.8 Qatar
9.5.1.8.1 Qatar Augmented Shopping Market Estimates and Forecasts, by Component (2020-2032) (USD Billion)
9.5.1.8.2 Qatar Augmented Shopping Market Estimates and Forecasts, by Application (2020-2032) (USD Billion)
9.5.1.9 Rest of Middle East
9.5.1.9.1 Rest of Middle East Augmented Shopping Market Estimates and Forecasts, by Component (2020-2032) (USD Billion)
9.5.1.9.2 Rest of Middle East Augmented Shopping Market Estimates and Forecasts, by Application (2020-2032) (USD Billion)
9.5.2 Africa
9.5.2.1 Trends Analysis
9.5.2.2 Africa Augmented Shopping Market Estimates and Forecasts, by Country (2020-2032) (USD Billion)
9.5.2.3 Africa Augmented Shopping Market Estimates and Forecasts, by Component (2020-2032) (USD Billion)
9.5.2.4 Africa Augmented Shopping Market Estimates and Forecasts, by Application (2020-2032) (USD Billion)
9.5.2.5 South Africa
9.5.2.5.1 South Africa Augmented Shopping Market Estimates and Forecasts, by Component (2020-2032) (USD Billion)
9.5.2.5.2 South Africa Augmented Shopping Market Estimates and Forecasts, by Application (2020-2032) (USD Billion)
9.5.2.6 Nigeria
9.5.2.6.1 Nigeria Augmented Shopping Market Estimates and Forecasts, by Component (2020-2032) (USD Billion)
9.5.2.6.2 Nigeria Augmented Shopping Market Estimates and Forecasts, by Application (2020-2032) (USD Billion)
9.5.2.7 Rest of Africa
9.5.2.7.1 Rest of Africa Augmented Shopping Market Estimates and Forecasts, by Component (2020-2032) (USD Billion)
9.5.2.7.2 Rest of Africa Augmented Shopping Market Estimates and Forecasts, by Application (2020-2032) (USD Billion)
9.6 Latin America
9.6.1 Trends Analysis
9.6.2 Latin America Augmented Shopping Market Estimates and Forecasts, by Country (2020-2032) (USD Billion)
9.6.3 Latin America Augmented Shopping Market Estimates and Forecasts, by Component (2020-2032) (USD Billion)
9.6.4 Latin America Augmented Shopping Market Estimates and Forecasts, by Application (2020-2032) (USD Billion)
9.6.5 Brazil
9.6.5.1 Brazil Augmented Shopping Market Estimates and Forecasts, by Component (2020-2032) (USD Billion)
9.6.5.2 Brazil Augmented Shopping Market Estimates and Forecasts, by Application (2020-2032) (USD Billion)
9.6.6 Argentina
9.6.6.1 Argentina Augmented Shopping Market Estimates and Forecasts, by Component (2020-2032) (USD Billion)
9.6.6.2 Argentina Augmented Shopping Market Estimates and Forecasts, by Application (2020-2032) (USD Billion)
9.6.7 Colombia
9.6.7.1 Colombia Augmented Shopping Market Estimates and Forecasts, by Component (2020-2032) (USD Billion)
9.6.7.2 Colombia Augmented Shopping Market Estimates and Forecasts, by Application (2020-2032) (USD Billion)
9.6.8 Rest of Latin America
9.6.8.1 Rest of Latin America Augmented Shopping Market Estimates and Forecasts, by Component (2020-2032) (USD Billion)
9.6.8.2 Rest of Latin America Augmented Shopping Market Estimates and Forecasts, by Application (2020-2032) (USD Billion)
10. Company Profiles
10.1 IKEA
10.1.1 Company Overview
10.1.2 Financial
10.1.3 Products/ Services Offered
110.1.4 SWOT Analysis
10.2 L'Oreal
10.2.1 Company Overview
10.2.2 Financial
10.2.3 Products/ Services Offered
10.2.4 SWOT Analysis
10.3 Sephora
10.3.1 Company Overview
10.3.2 Financial
10.3.3 Products/ Services Offered
10.3.4 SWOT Analysis
10.4 Nike
10.4.1 Company Overview
10.4.2 Financial
10.4.3 Products/ Services Offered
10.4.4 SWOT Analysis
10.5 Amazon
10.5.1 Company Overview
10.5.2 Financial
10.5.3 Products/ Services Offered
10.5.4 SWOT Analysis
10.6 Walmart
10.6.1 Company Overview
10.6.2 Financial
10.6.3 Products/ Services Offered
10.6.4 SWOT Analysis
10.7 Warby Parker
10.7.1 Company Overview
10.7.2 Financial
10.7.3 Products/ Services Offered
10.7.4 SWOT Analysis
10.8 ModiFace
10.8.1 Company Overview
10.8.2 Financial
10.8.3 Products/ Services Offered
10.8.4 SWOT Analysis
10.9 Zara
10.9.1 Company Overview
10.9.2 Financial
10.9.3 Products/ Services Offered
10.9.4 SWOT Analysis
10.10 H&M
10.9.1 Company Overview
10.9.2 Financial
10.9.3 Products/ Services Offered
10.9.4 SWOT Analysis
11. Use Cases and Best Practices
12. Conclusion
An accurate research report requires proper strategizing as well as implementation. There are multiple factors involved in the completion of good and accurate research report and selecting the best methodology to compete the research is the toughest part. Since the research reports we provide play a crucial role in any company’s decision-making process, therefore we at SNS Insider always believe that we should choose the best method which gives us results closer to reality. This allows us to reach at a stage wherein we can provide our clients best and accurate investment to output ratio.
Each report that we prepare takes a timeframe of 350-400 business hours for production. Starting from the selection of titles through a couple of in-depth brain storming session to the final QC process before uploading our titles on our website we dedicate around 350 working hours. The titles are selected based on their current market cap and the foreseen CAGR and growth.
The 5 steps process:
Step 1: Secondary Research:
Secondary Research or Desk Research is as the name suggests is a research process wherein, we collect data through the readily available information. In this process we use various paid and unpaid databases which our team has access to and gather data through the same. This includes examining of listed companies’ annual reports, Journals, SEC filling etc. Apart from this our team has access to various associations across the globe across different industries. Lastly, we have exchange relationships with various university as well as individual libraries.

Step 2: Primary Research
When we talk about primary research, it is a type of study in which the researchers collect relevant data samples directly, rather than relying on previously collected data. This type of research is focused on gaining content specific facts that can be sued to solve specific problems. Since the collected data is fresh and first hand therefore it makes the study more accurate and genuine.
We at SNS Insider have divided Primary Research into 2 parts.
Part 1 wherein we interview the KOLs of major players as well as the upcoming ones across various geographic regions. This allows us to have their view over the market scenario and acts as an important tool to come closer to the accurate market numbers. As many as 45 paid and unpaid primary interviews are taken from both the demand and supply side of the industry to make sure we land at an accurate judgement and analysis of the market.
This step involves the triangulation of data wherein our team analyses the interview transcripts, online survey responses and observation of on filed participants. The below mentioned chart should give a better understanding of the part 1 of the primary interview.

Part 2: In this part of primary research the data collected via secondary research and the part 1 of the primary research is validated with the interviews from individual consultants and subject matter experts.
Consultants are those set of people who have at least 12 years of experience and expertise within the industry whereas Subject Matter Experts are those with at least 15 years of experience behind their back within the same space. The data with the help of two main processes i.e., FGDs (Focused Group Discussions) and IDs (Individual Discussions). This gives us a 3rd party nonbiased primary view of the market scenario making it a more dependable one while collation of the data pointers.
Step 3: Data Bank Validation
Once all the information is collected via primary and secondary sources, we run that information for data validation. At our intelligence centre our research heads track a lot of information related to the market which includes the quarterly reports, the daily stock prices, and other relevant information. Our data bank server gets updated every fortnight and that is how the information which we collected using our primary and secondary information is revalidated in real time.

Step 4: QA/QC Process
After all the data collection and validation our team does a final level of quality check and quality assurance to get rid of any unwanted or undesired mistakes. This might include but not limited to getting rid of the any typos, duplication of numbers or missing of any important information. The people involved in this process include technical content writers, research heads and graphics people. Once this process is completed the title gets uploader on our platform for our clients to read it.
Step 5: Final QC/QA Process:
This is the last process and comes when the client has ordered the study. In this process a final QA/QC is done before the study is emailed to the client. Since we believe in giving our clients a good experience of our research studies, therefore, to make sure that we do not lack at our end in any way humanly possible we do a final round of quality check and then dispatch the study to the client.
Key Segments:
By Component
Solutions
Services
By Application
Automotive
Home Goods & Furniture
Beauty & Cosmetics
Apparel Fittings
Grocery Shopping
Footwear
Others
Request for Segment Customization as per your Business Requirement: Segment Customization Request
REGIONAL COVERAGE:
North America
US
Canada
Mexico
Europe
Eastern Europe
Poland
Romania
Hungary
Turkey
Rest of Eastern Europe
Western Europe
Germany
France
UK
Italy
Spain
Netherlands
Switzerland
Austria
Rest of Western Europe
Asia Pacific
China
India
Japan
South Korea
Vietnam
Singapore
Australia
Rest of Asia Pacific
Middle East & Africa
Middle East
UAE
Egypt
Saudi Arabia
Qatar
Rest of the Middle East
Africa
Nigeria
South Africa
Rest of Africa
Latin America
Brazil
Argentina
Colombia
Rest of Latin America
Request for Country Level Research Report: Country Level Customization Request
Available Customization
With the given market data, SNS Insider offers customization as per the company’s specific needs. The following customization options are available for the report:
Product Analysis
Criss-Cross segment analysis (e.g. Product X Application)
Product Matrix which gives a detailed comparison of product portfolio of each company
Geographic Analysis
Additional countries in any of the regions
Company Information
Detailed analysis and profiling of additional market players (Up to five)
The AI Voice Cloning Market was valued at USD 1.9 Billion in 2023 and is expected to reach USD 15.7 Billion by 2032, growing at a CAGR of 26.74% from 2024-2032.
The Passwordless Authentication Market size was valued at USD 17.1 billion in 2024 and will grow to USD 71.2 billion by 2032 and grow at a CAGR of 17.2 % by 2032.
Small Language Model Market was valued at USD 7.9 billion in 2023 and is expected to reach USD 29.64 billion by 2032, growing at a CAGR of 15.86% by 2032.
The Corporate E-learning Market was valued at USD 86.6 Billion in 2023 and will reach USD 528.4 Billion by 2032, growing at a CAGR of 22.29% by 2032.
The Voice Picking Solutions Market Size was USD 2.6 Billion in 2023 & is expected to reach USD 8.78 Billion by 2032, growing at a CAGR of 14.5% by 2024-2032
The Edge AI Software Market Size was valued at USD 1.33 Billion in 2023 and will reach USD 13.67 Billion by 2032, growing at a CAGR of 29.58% by 2024-2032.

Hi! Click one of our member below to chat on Phone
© 2025 All Rights Reserved by SNS Insider Pvt Ltd


