image

Augmented Reality Navigation Market Report Scope & Overview:
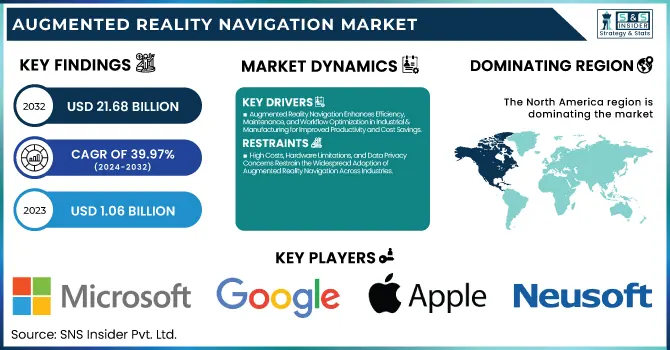
Augmented Reality Navigation Market was valued at USD 1.06 billion in 2023 and is expected to reach USD 21.68 billion by 2032, growing at a CAGR of 39.97% from 2024-2032. This report gives an in-depth analysis of drivers of market growth, such as adoption rates, technology developments, investment patterns, regulatory changes, and shifting consumer tastes. Growing demand for more interactive and immersive navigation systems is propelling growth, particularly in the automotive, manufacturing, and logistics industries. Advances in AR technology and increased connectivity are enriching navigation experiences. Moreover, major investments in AR technologies and favorable regulatory policies are driving market growth. Changing consumer preferences towards more tailored, real-time navigation services is also driving the market's growth across sectors.

Market Dynamics

Drivers

  • Augmented Reality Navigation Enhances Efficiency, Maintenance, and Workflow Optimization in Industrial & Manufacturing for Improved Productivity and Cost Savings.

Augmented Reality (AR) navigation is transforming industrial and manufacturing processes by increasing workflow productivity, maintenance, and training. AR-enabled navigation is being incorporated into industries to simplify warehouse operations, assembly line management, and real-time equipment tracking. AR-enabled smart glasses and headsets allow for hands-free navigation, eliminating errors and enhancing worker productivity. In warehouses, AR overlays streamline inventory management and order picking, reducing delays. Also, AR-supported maintenance enables technicians to see through complex machinery parts, speeding up repairs and minimizing downtime. Growing emphasis on automation and digital transformation is compelling industries to implement AR navigation for enhanced precision, speed of operations, and cost-effectiveness, making it a key tool for industrial environments today.

Restraints

  • High Costs, Hardware Limitations, and Data Privacy Concerns Restrain the Widespread Adoption of Augmented Reality Navigation Across Industries.

High implementation costs for AR hardware, software development, and integration with current systems restrict the widespread use of Augmented Reality (AR) navigation across industries. Several industries have budget limitations in deploying AR-based solutions, particularly small and mid-sized businesses. In addition, physical limitations like size, short battery life, and latency in AR equipment affect usability and efficiency in operation. Data security issues and requirements for rapid connectivity further limit market growth because navigation using AR is dependent on instant processing of data. All these can only be overcome with advancements in technology, price decrease, and infrastructure upgrade to make AR adoption universal across sectors.

Opportunities

  • Smart Cities and IoT Integration Drive Augmented Reality Navigation for Urban Mobility, Traffic Management, and Public Infrastructure Optimization.

The accelerated growth of smart cities and the integration of IoT technologies are pushing the use of Augmented Reality (AR) navigation. AR-based navigation is improving urban mobility, traffic management, and public infrastructure direction, providing real-time, data-driven solutions for effective city planning. With IoT-powered sensors and smart devices, AR overlays enable interactive navigation guidance, real-time traffic information, and pedestrian directions, enhancing overall transport efficiency. AR is being utilized by governments and urban planners to develop safer, more integrated cities, alleviating congestion and optimizing public transport networks. With more cities adopting digital transformation, the need for AR navigation solutions will increase, making it possible for seamless and engaging navigation experiences within urban environments.

Challenges

  • Limited 5G and High-Speed Connectivity Hinder Augmented Reality Navigation Performance, Causing Lags, Inaccuracies, and Reduced Reliability Across Applications.

Augmented Reality (AR) navigation is dependent on the processing of real-time data and thus needs the high-speed networks of 5G or high-bandwidth internet to be operational effectively. Yet, the uneven distribution of 5G infrastructure and congestion in many areas are the major hindrances. Under situations of poor connectivity, AR navigation suffers from latency, inaccuracy, and outages, thus lowering its effectiveness for applications of importance such as urban mobility, industrial navigation, and autonomous transportation. Furthermore, companies and administrations need to incur the cost of network expansion and optimization to optimize AR's maximum potential. Until high-speed connectivity is universally available, adoption of AR navigation solutions will continue to be limited, especially in rural and developing regions, where digital infrastructure remains in the developing stage.

Segment Analysis

By Type

Outdoor Navigation led the Augmented Reality Navigation Market with the largest revenue share of approximately 65% in 2023 as a result of its extensive use in automotive, transportation, and tourism applications. The use of AR-enabled Head-Up Displays (HUDs), GPS-enabled AR navigation, and smart city programs has fueled demand. Moreover, AR navigation also improves real-time route guidance, pedestrian support, and traffic control, rendering it a must-have for urban mobility. Increased investments in autonomous cars and connected infrastructure have further cemented its market leadership, guaranteeing its dominance.

Indoor Navigation is anticipated to expand at the fastest CAGR of 41.36% during 2024-2032, fueled by increasing adoption of AR-based wayfinding in malls, airports, hospitals, and warehouses. Companies are using AR overlays for smooth indoor navigation, enhancing customer experience and operational efficiency. The growth of IoT and 5G networks is improving real-time indoor mapping precision. Moreover, sectors such as retail, logistics, and healthcare are quickly adopting AR-based navigation to streamline workflow, resource management, and accessibility, driving market growth.

By End Use

Industrial & Manufacturing accounted for the maximum revenue share of nearly 27% in 2023 through Augmented Reality Navigation Market due to the widespread use of AR-enabled navigation on assembly lines, maintenance, and warehouse operations. AR smart glasses and headsets are used in industries to augment workflow efficiency, minimize errors, and increase employee productivity. Also, remote repair assistance using AR and real-time monitoring of equipment reduce downtime. The industry's emphasis on digitalization and automation has further sped up the adoption of AR navigation, cementing its position in the industry.

Healthcare will be the fastest-growing at a CAGR of 43.27% during 2024-2032 due to rising applications of AR navigation in surgeries, medical education, and patient support. AR allows for accurate visualization of organs, better navigation in complicated procedures, and enhanced diagnostics, enhancing medical accuracy. Hospitals are embracing AR-based wayfinding solutions to improve patient and visitor navigation. The convergence of AI, 5G, and wearable AR devices is further elevating telemedicine, remote diagnosis, and surgical accuracy, fueling explosive market growth.

By Component

Hardware led the Augmented Reality Navigation Market with the largest revenue share of approximately 41% in 2023, due to increasing adoption of AR headsets, smart glasses, and AR-capable HUDs across various industries. The growing uptake of high-performance AR devices across automotive, industrial, and medical applications has driven market growth. Technological innovations in optics, sensors, and AI-driven processing units have also improved AR navigation precision. As industries keep investing in hardware enhancements and new-generation AR devices, this segment continues to be a major revenue driver.

Services are anticipated to expand at the fastest CAGR of 42.24% during 2024-2032, driven by increasing demand for AR software integration, consulting, and maintenance services. Firms are investing in bespoke AR navigation solutions for particular industries, propelling service-based revenue growth. Cloud-based AR platforms, AI-powered analytics, and real-time updates are also improving navigation performance. With growing adoption in smart cities, healthcare, and industries, the demand for regular support, training, and system tuning is propelling service segment growth.

By Application

Routing & Navigation held the largest Augmented Reality Navigation Market revenue share of approximately 39% in 2023, fueled by its extensive applications in automotive, industrial, and smart city solutions. AR-powered navigation improves real-time route guidance, pedestrian navigation, and logistics optimization, making it a necessity for urban mobility and transportation. The combination of AI, GPS, and AR overlays has enhanced precision and efficiency, contributing to higher adoption. Rising investments in autonomous vehicles and connected infrastructure have strengthened its market dominance.

Real-Time Location Data Management will expand at the fastest CAGR of 42.09% during 2024-2032, driven by the growth in demand for accurate tracking, geospatial analysis, and AI-based processing of data. Retail, logistics, and healthcare sectors are utilizing real-time AR mapping solutions to support better decision-making and operation optimization. Increased deployment of IoT, 5G, and cloud-based AR platforms is enhancing data accuracy and responsiveness, fueling its uptake. With enterprises giving high importance to real-time location information, this market is expected to grow at a very fast pace.

Regional Analysis

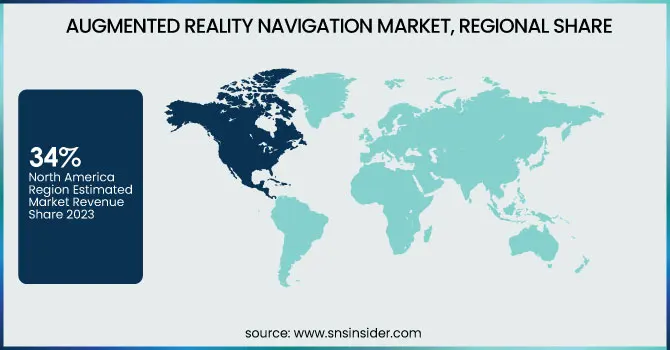
North America led the Augmented Reality Navigation Market with the largest revenue share of approximately 34% in 2023 due to the widespread early adoption of AR technology in various sectors including automotive, healthcare, and smart cities. The availability of pioneering AR hardware and software companies, combined with investments in 5G, AI, and IoT, has driven market growth. Moreover, the high demand among consumers for AR-enabled navigation in transportation and retail and robust government support for smart infrastructure initiatives have further entrenched North America's leadership in the market.

Asia Pacific will grow at the fastest CAGR of 42.06% from 2024-2032, driven by urbanization, growing smartphone penetration, and expanding industrial automation. The region is investing heavily in smart city developments, 5G rollout, and AR navigation solutions for transport and logistics. The rapidly expanding automotive and e-commerce sectors are fueling growth for real-time AR navigation and indoor wayfinding solutions. Additionally, the presence of cost-efficient AR hardware manufacturers is accelerating technological advancements, making Asia Pacific the fastest-growing region.

Key Players

  • Google LLC (Google Maps, ARCore)

  • Apple Inc. (Apple Maps, ARKit)

  • Microsoft (HoloLens, Azure Spatial Anchors)

  • WayRay AG (Navion, AR HUD)

  • Neusoft Corporation (Neusoft AR Navigation, Neusoft Intelligent Navigation System)

  • FURUNO ELECTRIC CO., LTD. (NavNet, FAR-1500 Radar System)

  • ARway Corp. (ARway Platform, AR Navigation Solutions)

  • Wiser Marine Technologies Ltd. (Wiser AR Navigation, Wiser 3D Maps)

  • Mapbox (Mapbox Vision, Mapbox AR)

  • Treedis (Treedis AR, Treedis Navigation)

  • ViewAR GmbH (ViewAR, ViewAR AR Navigation)

  • Artisense GmbH (Artisense AR, Artisense Navigation Engine)

  • IndoorAtlas (IndoorAtlas SDK, IndoorAtlas Positioning)

  • Hyper (Hyper AR, Hyper Navigation)

  • SITUM TECHNOLOGIES (Situm Indoor Navigation, Situm Platform)

  • Insider Navigation Inc (Indoor Wayfinding, Insider Navigation AR)

  • Wemap SAS (Wemap Indoor Navigation, Wemap AR)

  • Resonai Inc. (Resonai AR, Resonai Navigation Solutions)

  • Oriient New Media Ltd (Oriient AR, Oriient Indoor Navigation)

  • Navigine (Navigine AR, Navigine Indoor Navigation)

  • 22Miles (22Miles Interactive Kiosk, 22Miles Wayfinding)

  • Sygic (Sygic AR Navigation, Sygic Indoor Navigation)

  • Veo (Veo AR, Veo Navigation)

  • HERE (HERE Indoor Positioning, HERE AR Navigation)

  • Esri (ArcGIS, Esri AR)

Recent Developments:

  • In December 2024, Google announced Android XR, an "extended reality" platform developed in collaboration with Samsung and Qualcomm, marking its entry into virtual and augmented reality headsets and smart glasses.

  • Neusoft showcased AI-powered solutions for intelligent mobility at CES 2025, highlighting advancements in AR HUD software and intelligent navigation systems. These innovations aim to enhance driver experience by integrating AR-based navigation and real-time data processing.

Augmented Reality Navigation Market Report Scope:

Report Attributes Details
Market Size in 2023 USD 1.06 Billion
Market Size by 2032 USD 21.68 Billion
CAGR CAGR of 39.97% From 2024 to 2032
Base Year 2023
Forecast Period 2024-2032
Historical Data 2020-2022
Report Scope & Coverage Market Size, Segments Analysis, Competitive  Landscape, Regional Analysis, DROC & SWOT Analysis, Forecast Outlook
Key Segments • By Component (Hardware, Software, Services)
• By Type (Indoor Navigation, Outdoor Navigation)
• By Application (Real-Time Location Data Management, Routing & Navigation, Asset Tracking, Reverse Geocoding, Other Applications)
• By End Use (Aerospace & Defense, Gaming & Entertainment, Healthcare, E-Commerce & Retail, Military & Defense, Industrial & Manufacturing, Others)
Regional Analysis/Coverage North America (US, Canada, Mexico), Europe (Eastern Europe [Poland, Romania, Hungary, Turkey, Rest of Eastern Europe] Western Europe] Germany, France, UK, Italy, Spain, Netherlands, Switzerland, Austria, Rest of Western Europe]), Asia Pacific (China, India, Japan, South Korea, Vietnam, Singapore, Australia, Rest of Asia Pacific), Middle East & Africa (Middle East [UAE, Egypt, Saudi Arabia, Qatar, Rest of Middle East], Africa [Nigeria, South Africa, Rest of Africa], Latin America (Brazil, Argentina, Colombia, Rest of Latin America)
Company Profiles Google LLC, Apple Inc., Microsoft, WayRay AG, Neusoft Corporation, FURUNO ELECTRIC CO., LTD., ARway Corp., Wiser Marine Technologies Ltd., Mapbox, Treedis, ViewAR GmbH, Artisense GmbH, IndoorAtlas, Hyper, SITUM TECHNOLOGIES, Insider Navigation Inc, Wemap SAS, Resonai Inc., Oriient New Media Ltd, Navigine, 22Miles, Sygic, Veo, HERE, Esri

Frequently Asked Questions

ANS: Augmented Reality Navigation Market was valued at USD 1.06 billion in 2023 and is expected to reach USD 21.68 billion by 2032, growing at a CAGR of 39.97% from 2024-2032.

ANS: Outdoor Navigation held the highest revenue share of 65%.

ANS: Industrial & Manufacturing dominated with a 27% revenue share.

ANS: Hardware led with a 41% revenue share.

ANS: North America led with a 34% revenue share.

Table of Contents

1. Introduction

1.1 Market Definition

1.2 Scope (Inclusion and Exclusions)

1.3 Research Assumptions

2. Executive Summary

2.1 Market Overview

2.2 Regional Synopsis

2.3 Competitive Summary

3. Research Methodology

3.1 Top-Down Approach

3.2 Bottom-up Approach

3.3. Data Validation

3.4 Primary Interviews

4. Market Dynamics Impact Analysis

4.1 Market Driving Factors Analysis

4.1.1 Drivers

4.1.2 Restraints

4.1.3 Opportunities

4.1.4 Challenges

4.2 PESTLE Analysis

4.3 Porter’s Five Forces Model

5. Statistical Insights and Trends Reporting

5.1 Adoption Rate

5.2 Technological Advancements

5.3 Investment Trends

5.4 Regulatory Trends

5.5 Consumer Preferences and Behavior

6. Competitive Landscape

6.1 List of Major Companies, By Region

6.2 Market Share Analysis, By Region

6.3 Product Benchmarking

6.3.1 Product specifications and features

6.3.2 Pricing

6.4 Strategic Initiatives

6.4.1 Marketing and promotional activities

6.4.2 Distribution and supply chain strategies

6.4.3 Expansion plans and new product launches

6.4.4 Strategic partnerships and collaborations

6.5 Technological Advancements

6.6 Market Positioning and Branding

7. Augmented Reality Navigation Market Segmentation, By Type

7.1 Chapter Overview

7.2 Indoor Navigation

7.2.1 Indoor Navigation Market Trends Analysis (2020-2032)

7.2.2 Indoor Navigation Market Size Estimates and Forecasts to 2032 (USD Billion)

7.3 Outdoor Navigation

7.3.1 Outdoor Navigation Market Trends Analysis (2020-2032)

7.3.2 Outdoor Navigation Market Size Estimates and Forecasts to 2032 (USD Billion)

8. Augmented Reality Navigation Market Segmentation, By Application

8.1 Chapter Overview

8.2 Real-Time Location Data Management

8.2.1 Real-Time Location Data Management Market Trends Analysis (2020-2032)

8.2.2 Real-Time Location Data Management Market Size Estimates and Forecasts to 2032 (USD Billion)

8.3 Routing & Navigation

8.3.1 Routing & Navigation Market Trends Analysis (2020-2032)

8.3.2 Routing & Navigation Market Size Estimates and Forecasts to 2032 (USD Billion)

8.4 Asset Tracking

8.4.1 Asset Tracking Market Trends Analysis (2020-2032)

8.4.2 Asset Tracking Market Size Estimates and Forecasts to 2032 (USD Billion)

8.5 Reverse Geocoding

8.5.1 Reverse Geocoding Market Trends Analysis (2020-2032)

8.5.2 Reverse Geocoding Market Size Estimates and Forecasts to 2032 (USD Billion)

8.6 Other Applications

8.6.1 Other Applications Market Trends Analysis (2020-2032)

8.6.2 Other Applications Market Size Estimates and Forecasts to 2032 (USD Billion)

9. Augmented Reality Navigation Market Segmentation, By Component

9.1 Chapter Overview

9.2 Hardware

9.2.1 Hardware Market Trends Analysis (2020-2032)

9.2.2 Hardware Market Size Estimates and Forecasts to 2032 (USD Billion)

9.3 Software

9.3.1 Software Market Trends Analysis (2020-2032)

9.3.2 Software Market Size Estimates and Forecasts to 2032 (USD Billion)

9.4 Services

               9.4.1 Services Market Trends Analysis (2020-2032)

9.4.2 Services Market Size Estimates and Forecasts to 2032 (USD Billion)

10. Augmented Reality Navigation Market Segmentation, By End Use

10.1 Chapter Overview

10.2 Aerospace & Defense

10.2.1 Aerospace & Defense Market Trends Analysis (2020-2032)

10.2.2 Aerospace & Defense Market Size Estimates and Forecasts to 2032 (USD Billion)

10.3 Gaming & Entertainment

10.3.1 Gaming & Entertainment Market Trends Analysis (2020-2032)

10.3.2 Gaming & Entertainment Market Size Estimates and Forecasts to 2032 (USD Billion)

10.4 Healthcare

               10.4.1 Healthcare Market Trends Analysis (2020-2032)

10.4.2 Healthcare Market Size Estimates and Forecasts to 2032 (USD Billion)

10.5 E-Commerce & Retail

10.5.1 E-Commerce & Retail Market Trends Analysis (2020-2032)

10.5.2 E-Commerce & Retail Market Size Estimates and Forecasts to 2032 (USD Billion)

10.6 Military & Defense

10.6.1 Military & Defense Market Trends Analysis (2020-2032)

10.6.2 Military & Defense Market Size Estimates and Forecasts to 2032 (USD Billion)

10.7 Industrial & Manufacturing

10.7.1 Industrial & Manufacturing Market Trends Analysis (2020-2032)

10.7.2 Industrial & Manufacturing Market Size Estimates and Forecasts to 2032 (USD Billion)

10.8 Others

10.8.1 Others Market Trends Analysis (2020-2032)

10.8.2 Others Market Size Estimates and Forecasts to 2032 (USD Billion)

11. Regional Analysis

11.1 Chapter Overview

11.2 North America

11.2.1 Trends Analysis

11.2.2 North America Augmented Reality Navigation Market Estimates and Forecasts, by Country (2020-2032) (USD Billion)

11.2.3 North America Augmented Reality Navigation Market Estimates and Forecasts, By Type (2020-2032) (USD Billion) 

11.2.4 North America Augmented Reality Navigation Market Estimates and Forecasts, By Application (2020-2032) (USD Billion)

11.2.5 North America Augmented Reality Navigation Market Estimates and Forecasts, By Component (2020-2032) (USD Billion)

11.2.6 North America Augmented Reality Navigation Market Estimates and Forecasts, By End Use (2020-2032) (USD Billion)

11.2.7 USA

11.2.7.1 USA Augmented Reality Navigation Market Estimates and Forecasts, By Type (2020-2032) (USD Billion)

11.2.7.2 USA Augmented Reality Navigation Market Estimates and Forecasts, By Application (2020-2032) (USD Billion)

11.2.7.3 USA Augmented Reality Navigation Market Estimates and Forecasts, By Component (2020-2032) (USD Billion)

11.2.7.4 USA Augmented Reality Navigation Market Estimates and Forecasts, By End Use (2020-2032) (USD Billion)

11.2.8 Canada

11.2.8.1 Canada Augmented Reality Navigation Market Estimates and Forecasts, By Type (2020-2032) (USD Billion)

11.2.8.2 Canada Augmented Reality Navigation Market Estimates and Forecasts, By Application (2020-2032) (USD Billion)

11.2.8.3 Canada Augmented Reality Navigation Market Estimates and Forecasts, By Component (2020-2032) (USD Billion)

11.2.8.4 Canada Augmented Reality Navigation Market Estimates and Forecasts, By End Use (2020-2032) (USD Billion)

11.2.9 Mexico

11.2.9.1 Mexico Augmented Reality Navigation Market Estimates and Forecasts, By Type (2020-2032) (USD Billion)

11.2.9.2 Mexico Augmented Reality Navigation Market Estimates and Forecasts, By Application (2020-2032) (USD Billion)

11.2.9.3 Mexico Augmented Reality Navigation Market Estimates and Forecasts, By Component (2020-2032) (USD Billion)

11.2.9.4 Mexico Augmented Reality Navigation Market Estimates and Forecasts, By End Use (2020-2032) (USD Billion)

11.3 Europe

11.3.1 Eastern Europe

11.3.1.1 Trends Analysis

11.3.1.2 Eastern Europe Augmented Reality Navigation Market Estimates and Forecasts, by Country (2020-2032) (USD Billion)

11.3.1.3 Eastern Europe Augmented Reality Navigation Market Estimates and Forecasts, By Type (2020-2032) (USD Billion) 

11.3.1.4 Eastern Europe Augmented Reality Navigation Market Estimates and Forecasts, By Application (2020-2032) (USD Billion)

11.3.1.5 Eastern Europe Augmented Reality Navigation Market Estimates and Forecasts, By Component (2020-2032) (USD Billion)

11.3.1.6 Eastern Europe Augmented Reality Navigation Market Estimates and Forecasts, By End Use (2020-2032) (USD Billion)

11.3.1.7 Poland

11.3.1.7.1 Poland Augmented Reality Navigation Market Estimates and Forecasts, By Type (2020-2032) (USD Billion)

11.3.1.7.2 Poland Augmented Reality Navigation Market Estimates and Forecasts, By Application (2020-2032) (USD Billion)

11.3.1.7.3 Poland Augmented Reality Navigation Market Estimates and Forecasts, By Component (2020-2032) (USD Billion)

11.3.1.7.4 Poland Augmented Reality Navigation Market Estimates and Forecasts, By End Use (2020-2032) (USD Billion)

11.3.1.8 Romania

11.3.1.8.1 Romania Augmented Reality Navigation Market Estimates and Forecasts, By Type (2020-2032) (USD Billion)

11.3.1.8.2 Romania Augmented Reality Navigation Market Estimates and Forecasts, By Application (2020-2032) (USD Billion)

11.3.1.8.3 Romania Augmented Reality Navigation Market Estimates and Forecasts, By Component (2020-2032) (USD Billion)

11.3.1.8.4 Romania Augmented Reality Navigation Market Estimates and Forecasts, By End Use (2020-2032) (USD Billion)

11.3.1.9 Hungary

11.3.1.9.1 Hungary Augmented Reality Navigation Market Estimates and Forecasts, By Type (2020-2032) (USD Billion)

11.3.1.9.2 Hungary Augmented Reality Navigation Market Estimates and Forecasts, By Application (2020-2032) (USD Billion)

11.3.1.9.3 Hungary Augmented Reality Navigation Market Estimates and Forecasts, By Component (2020-2032) (USD Billion)

11.3.1.9.4 Hungary Augmented Reality Navigation Market Estimates and Forecasts, By End Use (2020-2032) (USD Billion)

11.3.1.10 Turkey

11.3.1.10.1 Turkey Augmented Reality Navigation Market Estimates and Forecasts, By Type (2020-2032) (USD Billion)

11.3.1.10.2 Turkey Augmented Reality Navigation Market Estimates and Forecasts, By Application (2020-2032) (USD Billion)

11.3.1.10.3 Turkey Augmented Reality Navigation Market Estimates and Forecasts, By Component (2020-2032) (USD Billion)

11.3.1.10.4 Turkey Augmented Reality Navigation Market Estimates and Forecasts, By End Use (2020-2032) (USD Billion)

11.3.1.11 Rest of Eastern Europe

11.3.1.11.1 Rest of Eastern Europe Augmented Reality Navigation Market Estimates and Forecasts, By Type (2020-2032) (USD Billion)

11.3.1.11.2 Rest of Eastern Europe Augmented Reality Navigation Market Estimates and Forecasts, By Application (2020-2032) (USD Billion)

11.3.1.11.3 Rest of Eastern Europe Augmented Reality Navigation Market Estimates and Forecasts, By Component (2020-2032) (USD Billion)

11.3.1.11.4 Rest of Eastern Europe Augmented Reality Navigation Market Estimates and Forecasts, By End Use (2020-2032) (USD Billion)

11.3.2 Western Europe

11.3.2.1 Trends Analysis

11.3.2.2 Western Europe Augmented Reality Navigation Market Estimates and Forecasts, by Country (2020-2032) (USD Billion)

11.3.2.3 Western Europe Augmented Reality Navigation Market Estimates and Forecasts, By Type (2020-2032) (USD Billion) 

11.3.2.4 Western Europe Augmented Reality Navigation Market Estimates and Forecasts, By Application (2020-2032) (USD Billion)

11.3.2.5 Western Europe Augmented Reality Navigation Market Estimates and Forecasts, By Component (2020-2032) (USD Billion)

11.3.2.6 Western Europe Augmented Reality Navigation Market Estimates and Forecasts, By End Use (2020-2032) (USD Billion)

11.3.2.7 Germany

11.3.2.7.1 Germany Augmented Reality Navigation Market Estimates and Forecasts, By Type (2020-2032) (USD Billion)

11.3.2.7.2 Germany Augmented Reality Navigation Market Estimates and Forecasts, By Application (2020-2032) (USD Billion)

11.3.2.7.3 Germany Augmented Reality Navigation Market Estimates and Forecasts, By Component (2020-2032) (USD Billion)

11.3.2.7.4 Germany Augmented Reality Navigation Market Estimates and Forecasts, By End Use (2020-2032) (USD Billion)

11.3.2.8 France

11.3.2.8.1 France Augmented Reality Navigation Market Estimates and Forecasts, By Type (2020-2032) (USD Billion)

11.3.2.8.2 France Augmented Reality Navigation Market Estimates and Forecasts, By Application (2020-2032) (USD Billion)

11.3.2.8.3 France Augmented Reality Navigation Market Estimates and Forecasts, By Component (2020-2032) (USD Billion)

11.3.2.8.4 France Augmented Reality Navigation Market Estimates and Forecasts, By End Use (2020-2032) (USD Billion)

11.3.2.9 UK

11.3.2.9.1 UK Augmented Reality Navigation Market Estimates and Forecasts, By Type (2020-2032) (USD Billion)

11.3.2.9.2 UK Augmented Reality Navigation Market Estimates and Forecasts, By Application (2020-2032) (USD Billion)

11.3.2.9.3 UK Augmented Reality Navigation Market Estimates and Forecasts, By Component (2020-2032) (USD Billion)

11.3.2.9.4 UK Augmented Reality Navigation Market Estimates and Forecasts, By End Use (2020-2032) (USD Billion)

11.3.2.10 Italy

11.3.2.10.1 Italy Augmented Reality Navigation Market Estimates and Forecasts, By Type (2020-2032) (USD Billion)

11.3.2.10.2 Italy Augmented Reality Navigation Market Estimates and Forecasts, By Application (2020-2032) (USD Billion)

11.3.2.10.3 Italy Augmented Reality Navigation Market Estimates and Forecasts, By Component (2020-2032) (USD Billion)

11.3.2.10.4 Italy Augmented Reality Navigation Market Estimates and Forecasts, By End Use (2020-2032) (USD Billion)

11.3.2.11 Spain

11.3.2.11.1 Spain Augmented Reality Navigation Market Estimates and Forecasts, By Type (2020-2032) (USD Billion)

11.3.2.11.2 Spain Augmented Reality Navigation Market Estimates and Forecasts, By Application (2020-2032) (USD Billion)

11.3.2.11.3 Spain Augmented Reality Navigation Market Estimates and Forecasts, By Component (2020-2032) (USD Billion)

11.3.2.11.4 Spain Augmented Reality Navigation Market Estimates and Forecasts, By End Use (2020-2032) (USD Billion)

11.3.2.12 Netherlands

11.3.2.12.1 Netherlands Augmented Reality Navigation Market Estimates and Forecasts, By Type (2020-2032) (USD Billion)

11.3.2.12.2 Netherlands Augmented Reality Navigation Market Estimates and Forecasts, By Application (2020-2032) (USD Billion)

11.3.2.12.3 Netherlands Augmented Reality Navigation Market Estimates and Forecasts, By Component (2020-2032) (USD Billion)

11.3.2.12.4 Netherlands Augmented Reality Navigation Market Estimates and Forecasts, By End Use (2020-2032) (USD Billion)

11.3.2.13 Switzerland

11.3.2.13.1 Switzerland Augmented Reality Navigation Market Estimates and Forecasts, By Type (2020-2032) (USD Billion)

11.3.2.13.2 Switzerland Augmented Reality Navigation Market Estimates and Forecasts, By Application (2020-2032) (USD Billion)

11.3.2.13.3 Switzerland Augmented Reality Navigation Market Estimates and Forecasts, By Component (2020-2032) (USD Billion)

11.3.2.13.4 Switzerland Augmented Reality Navigation Market Estimates and Forecasts, By End Use (2020-2032) (USD Billion)

11.3.2.14 Austria

11.3.2.14.1 Austria Augmented Reality Navigation Market Estimates and Forecasts, By Type (2020-2032) (USD Billion)

11.3.2.14.2 Austria Augmented Reality Navigation Market Estimates and Forecasts, By Application (2020-2032) (USD Billion)

11.3.2.14.3 Austria Augmented Reality Navigation Market Estimates and Forecasts, By Component (2020-2032) (USD Billion)

11.3.2.14.4 Austria Augmented Reality Navigation Market Estimates and Forecasts, By End Use (2020-2032) (USD Billion)

11.3.2.15 Rest of Western Europe

11.3.2.15.1 Rest of Western Europe Augmented Reality Navigation Market Estimates and Forecasts, By Type (2020-2032) (USD Billion)

11.3.2.15.2 Rest of Western Europe Augmented Reality Navigation Market Estimates and Forecasts, By Application (2020-2032) (USD Billion)

11.3.2.15.3 Rest of Western Europe Augmented Reality Navigation Market Estimates and Forecasts, By Component (2020-2032) (USD Billion)

11.3.2.15.4 Rest of Western Europe Augmented Reality Navigation Market Estimates and Forecasts, By End Use (2020-2032) (USD Billion)

11.4 Asia Pacific

11.4.1 Trends Analysis

11.4.2 Asia Pacific Augmented Reality Navigation Market Estimates and Forecasts, by Country (2020-2032) (USD Billion)

11.4.3 Asia Pacific Augmented Reality Navigation Market Estimates and Forecasts, By Type (2020-2032) (USD Billion) 

11.4.4 Asia Pacific Augmented Reality Navigation Market Estimates and Forecasts, By Application (2020-2032) (USD Billion)

11.4.5 Asia Pacific Augmented Reality Navigation Market Estimates and Forecasts, By Component (2020-2032) (USD Billion)

11.4.6 Asia Pacific Augmented Reality Navigation Market Estimates and Forecasts, By End Use (2020-2032) (USD Billion)

11.4.7 China

11.4.7.1 China Augmented Reality Navigation Market Estimates and Forecasts, By Type (2020-2032) (USD Billion)

11.4.7.2 China Augmented Reality Navigation Market Estimates and Forecasts, By Application (2020-2032) (USD Billion)

11.4.7.3 China Augmented Reality Navigation Market Estimates and Forecasts, By Component (2020-2032) (USD Billion)

11.4.7.4 China Augmented Reality Navigation Market Estimates and Forecasts, By End Use (2020-2032) (USD Billion)

11.4.8 India

11.4.8.1 India Augmented Reality Navigation Market Estimates and Forecasts, By Type (2020-2032) (USD Billion)

11.4.8.2 India Augmented Reality Navigation Market Estimates and Forecasts, By Application (2020-2032) (USD Billion)

11.4.8.3 India Augmented Reality Navigation Market Estimates and Forecasts, By Component (2020-2032) (USD Billion)

11.4.8.4 India Augmented Reality Navigation Market Estimates and Forecasts, By End Use (2020-2032) (USD Billion)

11.4.9 Japan

11.4.9.1 Japan Augmented Reality Navigation Market Estimates and Forecasts, By Type (2020-2032) (USD Billion)

11.4.9.2 Japan Augmented Reality Navigation Market Estimates and Forecasts, By Application (2020-2032) (USD Billion)

11.4.9.3 Japan Augmented Reality Navigation Market Estimates and Forecasts, By Component (2020-2032) (USD Billion)

11.4.9.4 Japan Augmented Reality Navigation Market Estimates and Forecasts, By End Use (2020-2032) (USD Billion)

11.4.10 South Korea

11.4.10.1 South Korea Augmented Reality Navigation Market Estimates and Forecasts, By Type (2020-2032) (USD Billion)

11.4.10.2 South Korea Augmented Reality Navigation Market Estimates and Forecasts, By Application (2020-2032) (USD Billion)

11.4.10.3 South Korea Augmented Reality Navigation Market Estimates and Forecasts, By Component (2020-2032) (USD Billion)

11.4.10.4 South Korea Augmented Reality Navigation Market Estimates and Forecasts, By End Use (2020-2032) (USD Billion)

11.4.11 Vietnam

11.4.11.1 Vietnam Augmented Reality Navigation Market Estimates and Forecasts, By Type (2020-2032) (USD Billion)

11.4.11.2 Vietnam Augmented Reality Navigation Market Estimates and Forecasts, By Application (2020-2032) (USD Billion)

11.4.11.3 Vietnam Augmented Reality Navigation Market Estimates and Forecasts, By Component (2020-2032) (USD Billion)

11.4.11.4 Vietnam Augmented Reality Navigation Market Estimates and Forecasts, By End Use (2020-2032) (USD Billion)

11.4.12 Singapore

11.4.12.1 Singapore Augmented Reality Navigation Market Estimates and Forecasts, By Type (2020-2032) (USD Billion)

11.4.12.2 Singapore Augmented Reality Navigation Market Estimates and Forecasts, By Application (2020-2032) (USD Billion)

11.4.12.3 Singapore Augmented Reality Navigation Market Estimates and Forecasts, By Component (2020-2032) (USD Billion)

11.4.12.4 Singapore Augmented Reality Navigation Market Estimates and Forecasts, By End Use (2020-2032) (USD Billion)

11.4.13 Australia

11.4.13.1 Australia Augmented Reality Navigation Market Estimates and Forecasts, By Type (2020-2032) (USD Billion)

11.4.13.2 Australia Augmented Reality Navigation Market Estimates and Forecasts, By Application (2020-2032) (USD Billion)

11.4.13.3 Australia Augmented Reality Navigation Market Estimates and Forecasts, By Component (2020-2032) (USD Billion)

11.4.13.4 Australia Augmented Reality Navigation Market Estimates and Forecasts, By End Use (2020-2032) (USD Billion)

11.4.14 Rest of Asia Pacific

11.4.14.1 Rest of Asia Pacific Augmented Reality Navigation Market Estimates and Forecasts, By Type (2020-2032) (USD Billion)

11.4.14.2 Rest of Asia Pacific Augmented Reality Navigation Market Estimates and Forecasts, By Application (2020-2032) (USD Billion)

11.4.14.3 Rest of Asia Pacific Augmented Reality Navigation Market Estimates and Forecasts, By Component (2020-2032) (USD Billion)

11.4.14.4 Rest of Asia Pacific Augmented Reality Navigation Market Estimates and Forecasts, By End Use (2020-2032) (USD Billion)

11.5 Middle East and Africa

11.5.1 Middle East

11.5.1.1 Trends Analysis

11.5.1.2 Middle East Augmented Reality Navigation Market Estimates and Forecasts, by Country (2020-2032) (USD Billion)

11.5.1.3 Middle East Augmented Reality Navigation Market Estimates and Forecasts, By Type (2020-2032) (USD Billion) 

11.5.1.4 Middle East Augmented Reality Navigation Market Estimates and Forecasts, By Application (2020-2032) (USD Billion)

11.5.1.5 Middle East Augmented Reality Navigation Market Estimates and Forecasts, By Component (2020-2032) (USD Billion)

11.5.1.6 Middle East Augmented Reality Navigation Market Estimates and Forecasts, By End Use (2020-2032) (USD Billion)

11.5.1.7 UAE

11.5.1.7.1 UAE Augmented Reality Navigation Market Estimates and Forecasts, By Type (2020-2032) (USD Billion)

11.5.1.7.2 UAE Augmented Reality Navigation Market Estimates and Forecasts, By Application (2020-2032) (USD Billion)

11.5.1.7.3 UAE Augmented Reality Navigation Market Estimates and Forecasts, By Component (2020-2032) (USD Billion)

11.5.1.7.4 UAE Augmented Reality Navigation Market Estimates and Forecasts, By End Use  (2020-2032) (USD Billion)

11.5.1.8 Egypt

11.5.1.8.1 Egypt Augmented Reality Navigation Market Estimates and Forecasts, By Type (2020-2032) (USD Billion)

11.5.1.8.2 Egypt Augmented Reality Navigation Market Estimates and Forecasts, By Application (2020-2032) (USD Billion)

11.5.1.8.3 Egypt Augmented Reality Navigation Market Estimates and Forecasts, By Component (2020-2032) (USD Billion)

11.5.1.8.4 Egypt Augmented Reality Navigation Market Estimates and Forecasts, By End Use (2020-2032) (USD Billion)

11.5.1.9 Saudi Arabia

11.5.1.9.1 Saudi Arabia Augmented Reality Navigation Market Estimates and Forecasts, By Type (2020-2032) (USD Billion)

11.5.1.9.2 Saudi Arabia Augmented Reality Navigation Market Estimates and Forecasts, By Application (2020-2032) (USD Billion)

11.5.1.9.3 Saudi Arabia Augmented Reality Navigation Market Estimates and Forecasts, By Component (2020-2032) (USD Billion)

11.5.1.9.4 Saudi Arabia Augmented Reality Navigation Market Estimates and Forecasts, By End Use (2020-2032) (USD Billion)

11.5.1.10 Qatar

11.5.1.10.1 Qatar Augmented Reality Navigation Market Estimates and Forecasts, By Type (2020-2032) (USD Billion)

11.5.1.10.2 Qatar Augmented Reality Navigation Market Estimates and Forecasts, By Application (2020-2032) (USD Billion)

11.5.1.10.3 Qatar Augmented Reality Navigation Market Estimates and Forecasts, By Component (2020-2032) (USD Billion)

11.5.1.10.4 Qatar Augmented Reality Navigation Market Estimates and Forecasts, By End Use (2020-2032) (USD Billion)

11.5.1.11 Rest of Middle East

11.5.1.11.1 Rest of Middle East Augmented Reality Navigation Market Estimates and Forecasts, By Type (2020-2032) (USD Billion)

11.5.1.11.2 Rest of Middle East Augmented Reality Navigation Market Estimates and Forecasts, By Application (2020-2032) (USD Billion)

11.5.1.11.3 Rest of Middle East Augmented Reality Navigation Market Estimates and Forecasts, By Component (2020-2032) (USD Billion)

11.5.1.11.4 Rest of Middle East Augmented Reality Navigation Market Estimates and Forecasts, By End Use (2020-2032) (USD Billion)

11.5.2 Africa

11.5.2.1 Trends Analysis

11.5.2.2 Africa Augmented Reality Navigation Market Estimates and Forecasts, by Country (2020-2032) (USD Billion)

11.5.2.3 Africa Augmented Reality Navigation Market Estimates and Forecasts, By Type (2020-2032) (USD Billion) 

11.5.2.4 Africa Augmented Reality Navigation Market Estimates and Forecasts, By Application (2020-2032) (USD Billion)

11.5.2.5 Africa Augmented Reality Navigation Market Estimates and Forecasts, By Component (2020-2032) (USD Billion)

11.5.2.6 Africa Augmented Reality Navigation Market Estimates and Forecasts, By End Use (2020-2032) (USD Billion)

11.5.2.7 South Africa

11.5.2.7.1 South Africa Augmented Reality Navigation Market Estimates and Forecasts, By Type (2020-2032) (USD Billion)

11.5.2.7.2 South Africa Augmented Reality Navigation Market Estimates and Forecasts, By Application (2020-2032) (USD Billion)

11.5.2.7.3 South Africa Augmented Reality Navigation Market Estimates and Forecasts, By Component (2020-2032) (USD Billion)

11.5.2.7.4 South Africa Augmented Reality Navigation Market Estimates and Forecasts, By End Use (2020-2032) (USD Billion)

11.5.2.8 Nigeria

11.5.2.8.1 Nigeria Augmented Reality Navigation Market Estimates and Forecasts, By Type (2020-2032) (USD Billion)

11.5.2.8.2 Nigeria Augmented Reality Navigation Market Estimates and Forecasts, By Application (2020-2032) (USD Billion)

11.5.2.8.3 Nigeria Augmented Reality Navigation Market Estimates and Forecasts, By Component (2020-2032) (USD Billion)

11.5.2.8.4 Nigeria Augmented Reality Navigation Market Estimates and Forecasts, By End Use (2020-2032) (USD Billion)

11.5.2.9 Rest of Africa

11.5.2.9.1 Rest of Africa Augmented Reality Navigation Market Estimates and Forecasts, By Type (2020-2032) (USD Billion)

11.5.2.9.2 Rest of Africa Augmented Reality Navigation Market Estimates and Forecasts, By Application (2020-2032) (USD Billion)

11.5.2.9.3 Rest of Africa Augmented Reality Navigation Market Estimates and Forecasts, By Component (2020-2032) (USD Billion)

11.5.2.9.4 Rest of Africa Augmented Reality Navigation Market Estimates and Forecasts, By End Use (2020-2032) (USD Billion)

11.6 Latin America

11.6.1 Trends Analysis

11.6.2 Latin America Augmented Reality Navigation Market Estimates and Forecasts, by Country (2020-2032) (USD Billion)

11.6.3 Latin America Augmented Reality Navigation Market Estimates and Forecasts, By Type (2020-2032) (USD Billion) 

11.6.4 Latin America Augmented Reality Navigation Market Estimates and Forecasts, By Application (2020-2032) (USD Billion)

11.6.5 Latin America Augmented Reality Navigation Market Estimates and Forecasts, By Component (2020-2032) (USD Billion)

11.6.6 Latin America Augmented Reality Navigation Market Estimates and Forecasts, By End Use (2020-2032) (USD Billion)

11.6.7 Brazil

11.6.7.1 Brazil Augmented Reality Navigation Market Estimates and Forecasts, By Type (2020-2032) (USD Billion)

11.6.7.2 Brazil Augmented Reality Navigation Market Estimates and Forecasts, By Application (2020-2032) (USD Billion)

11.6.7.3 Brazil Augmented Reality Navigation Market Estimates and Forecasts, By Component (2020-2032) (USD Billion)

11.6.7.4 Brazil Augmented Reality Navigation Market Estimates and Forecasts, By End Use (2020-2032) (USD Billion)

11.6.8 Argentina

11.6.8.1 Argentina Augmented Reality Navigation Market Estimates and Forecasts, By Type (2020-2032) (USD Billion)

11.6.8.2 Argentina Augmented Reality Navigation Market Estimates and Forecasts, By Application (2020-2032) (USD Billion)

11.6.8.3 Argentina Augmented Reality Navigation Market Estimates and Forecasts, By Component (2020-2032) (USD Billion)

11.6.8.4 Argentina Augmented Reality Navigation Market Estimates and Forecasts, By End Use (2020-2032) (USD Billion)

11.6.9 Colombia

11.6.9.1 Colombia Augmented Reality Navigation Market Estimates and Forecasts, By Type (2020-2032) (USD Billion)

11.6.9.2 Colombia Augmented Reality Navigation Market Estimates and Forecasts, By Application (2020-2032) (USD Billion)

11.6.9.3 Colombia Augmented Reality Navigation Market Estimates and Forecasts, By Component (2020-2032) (USD Billion)

11.6.9.4 Colombia Augmented Reality Navigation Market Estimates and Forecasts, By End Use (2020-2032) (USD Billion)

11.6.10 Rest of Latin America

11.6.10.1 Rest of Latin America Augmented Reality Navigation Market Estimates and Forecasts, By Type (2020-2032) (USD Billion)

11.6.10.2 Rest of Latin America Augmented Reality Navigation Market Estimates and Forecasts, By Application (2020-2032) (USD Billion)

11.6.10.3 Rest of Latin America Augmented Reality Navigation Market Estimates and Forecasts, By Component (2020-2032) (USD Billion)

11.6.10.4 Rest of Latin America Augmented Reality Navigation Market Estimates and Forecasts, By End Use (2020-2032) (USD Billion)

12. Company Profiles

12.1 Google LLC

12.1.1 Company Overview

12.1.2 Financial

12.1.3 Products/ Services Offered

12.1.4 SWOT Analysis

12.2 Apple Inc.

12.2.1 Company Overview

12.2.2 Financial

12.2.3 Products/ Services Offered

12.2.4 SWOT Analysis

12.3 Microsoft

12.3.1 Company Overview

12.3.2 Financial

12.3.3 Products/ Services Offered

12.3.4 SWOT Analysis

12.4 WayRay AG

12.4.1 Company Overview

12.4.2 Financial

12.4.3 Products/ Services Offered

12.4.4 SWOT Analysis

12.5 Neusoft Corporation

12.5.1 Company Overview

12.5.2 Financial

12.5.3 Products/ Services Offered

12.5.4 SWOT Analysis

12.6 FURUNO ELECTRIC CO., LTD.

12.6.1 Company Overview

12.6.2 Financial

12.6.3 Products/ Services Offered

12.6.4 SWOT Analysis

12.7 ARway Corp.

12.7.1 Company Overview

12.7.2 Financial

12.7.3 Products/ Services Offered

12.7.4 SWOT Analysis

12.8 Wiser Marine Technologies Ltd.

12.8.1 Company Overview

12.8.2 Financial

12.8.3 Products/ Services Offered

12.8.4 SWOT Analysis

12.9 Mapbox

12.9.1 Company Overview

12.9.2 Financial

12.9.3 Products/ Services Offered

12.9.4 SWOT Analysis

12.10 Treedis

12.10.1 Company Overview

12.10.2 Financial

12.10.3 Products/ Services Offered

12.10.4 SWOT Analysis

13. Use Cases and Best Practices

14. Conclusion

An accurate research report requires proper strategizing as well as implementation. There are multiple factors involved in the completion of good and accurate research report and selecting the best methodology to compete the research is the toughest part. Since the research reports we provide play a crucial role in any company’s decision-making process, therefore we at SNS Insider always believe that we should choose the best method which gives us results closer to reality. This allows us to reach at a stage wherein we can provide our clients best and accurate investment to output ratio.

Each report that we prepare takes a timeframe of 350-400 business hours for production. Starting from the selection of titles through a couple of in-depth brain storming session to the final QC process before uploading our titles on our website we dedicate around 350 working hours. The titles are selected based on their current market cap and the foreseen CAGR and growth.


The 5 steps process:

Step 1: Secondary Research:

Secondary Research or Desk Research is as the name suggests is a research process wherein, we collect data through the readily available information. In this process we use various paid and unpaid databases which our team has access to and gather data through the same. This includes examining of listed companies’ annual reports, Journals, SEC filling etc. Apart from this our team has access to various associations across the globe across different industries. Lastly, we have exchange relationships with various university as well as individual libraries.

Secondary Research

Step 2: Primary Research

When we talk about primary research, it is a type of study in which the researchers collect relevant data samples directly, rather than relying on previously collected data.  This type of research is focused on gaining content specific facts that can be sued to solve specific problems. Since the collected data is fresh and first hand therefore it makes the study more accurate and genuine.

We at SNS Insider have divided Primary Research into 2 parts.

Part 1 wherein we interview the KOLs of major players as well as the upcoming ones across various geographic regions. This allows us to have their view over the market scenario and acts as an important tool to come closer to the accurate market numbers. As many as 45 paid and unpaid primary interviews are taken from both the demand and supply side of the industry to make sure we land at an accurate judgement and analysis of the market.

This step involves the triangulation of data wherein our team analyses the interview transcripts, online survey responses and observation of on filed participants. The below mentioned chart should give a better understanding of the part 1 of the primary interview.

Primary Research

Part 2: In this part of primary research the data collected via secondary research and the part 1 of the primary research is validated with the interviews from individual consultants and subject matter experts.

Consultants are those set of people who have at least 12 years of experience and expertise within the industry whereas Subject Matter Experts are those with at least 15 years of experience behind their back within the same space. The data with the help of two main processes i.e., FGDs (Focused Group Discussions) and IDs (Individual Discussions). This gives us a 3rd party nonbiased primary view of the market scenario making it a more dependable one while collation of the data pointers.

Step 3: Data Bank Validation

Once all the information is collected via primary and secondary sources, we run that information for data validation. At our intelligence centre our research heads track a lot of information related to the market which includes the quarterly reports, the daily stock prices, and other relevant information. Our data bank server gets updated every fortnight and that is how the information which we collected using our primary and secondary information is revalidated in real time.

Data Bank Validation

Step 4: QA/QC Process

After all the data collection and validation our team does a final level of quality check and quality assurance to get rid of any unwanted or undesired mistakes. This might include but not limited to getting rid of the any typos, duplication of numbers or missing of any important information. The people involved in this process include technical content writers, research heads and graphics people. Once this process is completed the title gets uploader on our platform for our clients to read it.

Step 5: Final QC/QA Process:

This is the last process and comes when the client has ordered the study. In this process a final QA/QC is done before the study is emailed to the client. Since we believe in giving our clients a good experience of our research studies, therefore, to make sure that we do not lack at our end in any way humanly possible we do a final round of quality check and then dispatch the study to the client.

Key Segments:

By Component

  • Hardware

  • Software

  • Services

By Type

  • Indoor Navigation

  • Outdoor Navigation

By Application

  • Real-Time Location Data Management

  • Routing & Navigation

  • Asset Tracking

  • Reverse Geocoding

  • Other Applications

By End Use

  • Aerospace & Defense

  • Gaming & Entertainment

  • Healthcare

  • E-Commerce & Retail

  • Military & Defense

  • Industrial & Manufacturing

  • Others

Request for Segment Customization as per your Business Requirement: Segment Customization Request

Regional Coverage:

North America

  • US

  • Canada

  • Mexico

Europe

  • Eastern Europe

    • Poland

    • Romania

    • Hungary

    • Turkey

    • Rest of Eastern Europe

  • Western Europe

    • Germany

    • France

    • UK

    • Italy

    • Spain

    • Netherlands

    • Switzerland

    • Austria

    • Rest of Western Europe

Asia Pacific

  • China

  • India

  • Japan

  • South Korea

  • Vietnam

  • Singapore

  • Australia

  • Rest of Asia Pacific

Middle East & Africa

  • Middle East

    • UAE

    • Egypt

    • Saudi Arabia

    • Qatar

    • Rest of Middle East

  • Africa

    • Nigeria

    • South Africa

    • Rest of Africa

Latin America

  • Brazil

  • Argentina

  • Colombia

  • Rest of Latin America

Request for Country Level Research Report: Country Level Customization Request

Available Customization

With the given market data, SNS Insider offers customization as per the company’s specific needs. The following customization options are available for the report:

  • Detailed Volume Analysis

  • Criss-Cross segment analysis (e.g. Product X Application)

  • Competitive Product Benchmarking

  • Geographic Analysis

  • Additional countries in any of the regions

  • Customized Data Representation

  • Detailed analysis and profiling of additional market players


  •            5000 (33% Discount)


  •            8950 (40% Discount)


  •            3050 (23% Discount)

Start a Conversation

Hi! Click one of our member below to chat on Phone