Augmented Reality Market Report Scope & Overview:
The Augmented Reality Market was valued at USD 81.5 Billion in 2023 and is expected to reach USD 1364.9 Billion by 2032, growing at a CAGR of 36.80% from 2024-2032.

To Get more information on Augmented Reality Market - Request Free Sample Report
The Augmented Reality (AR) Market is rapidly expanding across multiple industries. In 2023, North America and Asia-Pacific led AR device shipments, driven by rising consumer interest and enterprise adoption. Gaming dominates AR application adoption, followed by retail and healthcare, where AR is transforming shopping experiences and medical training. Between 2020 and 2023, investments in AR technologies surged, particularly in the U.S., China, and Europe, fueled by advancements in AI, 5G, and mixed reality. The AR Head-Mounted Display (HMD) market is highly competitive, with Microsoft (HoloLens), Meta (Quest), and Magic Leap holding a significant share, while new entrants continue to reshape the landscape.
Augmented Reality Market Dynamics
Drivers
-
The rising demand for immersive experiences in gaming, retail, healthcare, and education is accelerating AR adoption.
Increasing use of the AR market to meet the demand for immersive and interactive experiences across gaming & entertainment, retail, healthcare, education, and other industries is one of the major factors driving the AR market. Audiences demand digital experiences that are improved and in real-time, whilst companies utilize AR for things such as customer engagement, virtual training, and remote assistance with product-related concerns. Adoption has been greatly driven by the gaming industry, which is dominated by mobile games and consoles powered by AR. Moreover, e-commerce platforms utilize AR for virtual try-on and 3D visualization of the product, which increases conversion rates. The nature of AR experiences is expected to become more seamless and realistic due to advances in AI, 5G, and cloud computing, further accelerating the uptake of AR in combat roles and driving market growth.
Restraints
-
High costs of AR hardware and implementation limit accessibility and widespread deployment across industries.
Although adoption is rising, the cost of the AR hardware and implementation are some of the biggest blockers. Mobile devices such as smart glasses or head-mounted displays require advanced, and thus costly, AR devices that are not accessible to the public. Also, businesses looking to spend in AR solutions need lots of capital for development, deployment, and maintenance. Besides, the expense on custom AR applications is more since the integration with the existing IT infrastructure is required. Besides, the battery issues, display quality, and how bulkier the hardware is all prevent mass adoption. Mobile AR is a more affordable alternative, but for the market to truly grow, it will require cheaper hardware and solutions for businesses and consumers alike.
Opportunity
-
Enterprise and industrial applications in manufacturing, healthcare, and logistics are driving AR market expansion.
The enterprise/industrial use of AR represents an especially rich growth opportunity. AR is being integrated for the workforce training purposes, remote collaboration, maintenance, and product visualization in industries such as Manufacturing, healthcare, automotive, and retail. AR in remote assistance and digital twins that optimize real-time troubleshooting and predictive maintenance drives productivity. AR applied to healthcare makes an impact on medical education, surgery planning, and diagnostics, hence enhancing the patient outcome. In addition, augmented reality smart glasses will increase use for warehouse operations, logistics, and field services, which will further broaden these market opportunities. With companies pouring in money for metaverse-based applications, the enterprise-grade need for AR solutions will only rise in the years to come.
Challenges
-
Lack of standardization and privacy concerns hinder seamless AR adoption and raise security issues.
Lack of standards in the AR market and increasing concerns regarding privacy pose threats. AR works via interoperability, which leads to fragmentation in content development, since common content can hardly run on other AR platforms or devices. Moreover, AR also faces data privacy and security risks because a large amount of user information, such as location, biometrics, and behavior patterns, is collected and processed when using AR applications. As regulations around data protection become more stringent, compliance is an important consideration, but that means increasing complexity around implementation. Some users are also deterred by concerns about AR-based surveillance as well as unauthorized access to their personal information. This will require tech providers, as well as policymakers and businesses, to work together to establish clear standards and bolster the security of data.
Augmented Reality Market Segmentation Analysis
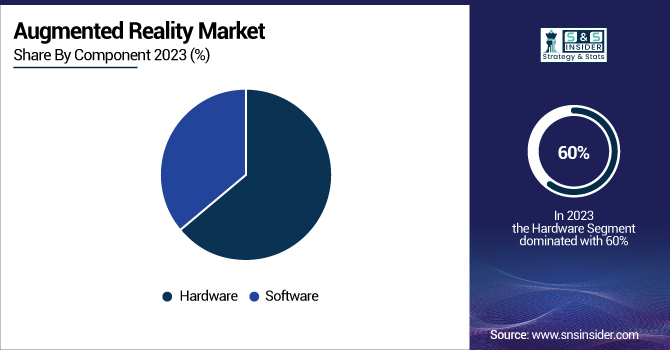
By Component
In 2023, the hardware segment dominated the market and accounted for 60% of revenue share, due to the increased implementation of AR headsets, smart glasses, and displays in various sectors including education, gaming & entertainment, and manufacturing. Such devices are vital for providing immersive experiences in remote aid, real-time training, and simulated virtual environments.
The software segment is projected to grow at the fastest CAGR from 2024 to 2032 due to increasing demand for AR applications for better user experience, especially in the various sectors such as retail, and education. the software segment is anticipated to be propelled by rising local investments in cloud-based AR solutions and the growing demand for AR app development platform.
By Display
The head mounted segment led the market in 2023 and held the largest revenue share, since this device has high application in several industries, i.e., Education, defense, and manufacturing. HMDs play an important role in immersive training, simulations, real-time problem-solving, and are, therefore, significant in sectors that require hands-free operation and superior situational awareness. Additionally, the demand for AR-based Gaming & Entertainment and Aerospace & Defense along with the rising adoption of HMD for remote assistance and maintenance, contributed to the growth of the market.
The smart glasses segment is projected to record the fastest growth in terms of CAGR during the forecast period, from 2024–2032, owing to the rise in adoption of enterprise applications including logistics, manufacturing, and education, where real-time data overlay and hands-free navigation improves productivity. Remote collaboration via smart glasses allows experts to instruct field technicians without actually being on-site. At the same time, smart glasses are also gaining traction on the consumer front, providing augmented navigation, fitness trackers, and virtual assistants.
By Application
In 2023, the industrial & manufacturing segment dominated the market and accounted for a significant revenue share in 2023. The increasing application of AR for productivity enhancements, training, and operational efficiency has contributed to this growth. Real-time equipment maintenance, remote assistance, and assembly line monitoring in this sector has been shown to decrease downtime and improve worker performance through AR applications. This provides manufacturers with the ability to overlay information over the physical environment, enabling them to optimise workflows, reduce mistakes, and enhance safety.
Healthcare segment is expected to witness the fastest growth during the forecast period 2024-2032, owing to the rising utilization of AR in medical training, diagnostics, and surgery. AR is assisting in visualization of complex surgeries thereby enabling surgeons to perform minimally invasive surgeries accurately.
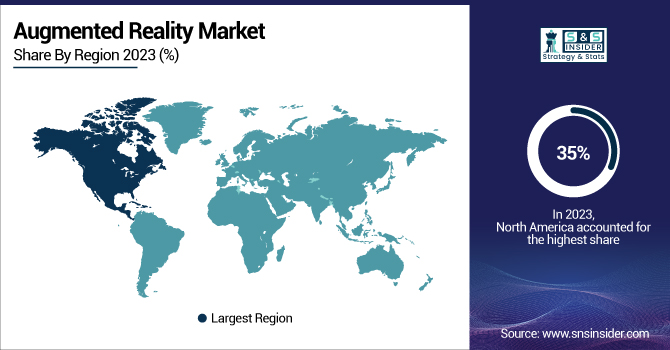
Regional Analysis
North America dominated the market and held the highest revenue share of over 35% in 2023, on account of technological advancements, large number of AR startups, and significant investments in research and development activities. The growing demand is driven by the increasing uptake of industries like Gaming & Entertainment, retail, and Education using AR to deliver enhanced customer experience as well as more effective training and diagnostics.
The Asia Pacific region is expected to register the fastest CAGR during the forecast period. The AR market is being driven by faster digital transformation in the Asia Pacific. Manufacturing is rife in the area as businesses are adopting AR to optimise production processes and improve the training of workers. Different factors such as the high penetration of smartphones and government initiatives concerning AR in education, and retail are the major driving forces in this region.
Get Customized Report as per Your Business Requirement - Enquiry Now
Key Players
The major key players along with their products are
-
Microsoft – HoloLens 2
-
Meta (formerly Facebook) – Meta Quest 3
-
Apple – Vision Pro
-
Google – Google ARCore
-
Snap Inc. – Spectacles AR
-
Magic Leap – Magic Leap 2
-
Niantic – Pokémon GO
-
Vuzix – Vuzix Blade
-
Epson – Moverio BT-40S
-
Lenovo – ThinkReality A3
-
Pimax – Pimax Crystal
-
Qualcomm – Snapdragon XR2
-
Sony – PlayStation VR2
-
PTC – Vuforia
-
Zebra Technologies – HD4000 Enterprise Headset
Recent Developments
-
January 2024 – Meta: Invested $19.9 billion in its Reality Labs division, focusing on developing Ray-Ban Meta smart glasses and Quest VR headsets, with plans to surpass $20 billion in investments in 2025.
-
September 2024 – Meta: Unveiled the Orion augmented reality glasses at their annual developer conference, aiming to integrate digital media projection and AR interactions into everyday eyewear.
| Report Attributes | Details |
|---|---|
| Market Size in 2023 | USD 81.5 Billion |
| Market Size by 2032 | USD 1364.9 Billion |
| CAGR | CAGR of 36.80% From 2024 to 2032 |
| Base Year | 2023 |
| Forecast Period | 2024-2032 |
| Historical Data | 2020-2022 |
| Report Scope & Coverage | Market Size, Segments Analysis, Competitive Landscape, Regional Analysis, DROC & SWOT Analysis, Forecast Outlook |
| Key Segments | • By Component (Hardware, Software) • By Display (HMD (Head-Mounted Display), Smart Glass, Head-up Display (HUD), Handheld Devices) • By Application (Aerospace & Defense, Gaming & Entertainment, Education, E-Commerce & Retail, Gaming & Entertainment, Education, Industrial & Manufacturing, Others) |
| Regional Analysis/Coverage | North America (US, Canada, Mexico), Europe (Eastern Europe [Poland, Romania, Hungary, Turkey, Rest of Eastern Europe] Western Europe] Germany, France, UK, Italy, Spain, Netherlands, Switzerland, Austria, Rest of Western Europe]), Asia Pacific (China, India, Japan, South Korea, Vietnam, Singapore, Australia, Rest of Asia Pacific), Middle East & Africa (Middle East [UAE, Egypt, Saudi Arabia, Qatar, Rest of Middle East], Africa [Nigeria, South Africa, Rest of Africa], Latin America (Brazil, Argentina, Colombia, Rest of Latin America) |
| Company Profiles | Microsoft, Meta, Apple, Google, Snap Inc., Magic Leap, Niantic, Vuzix, Epson, Lenovo, Pimax, Qualcomm, Sony, PTC, Zebra Technologies |
