Get More Information on augmented intelligence market - Request Sample Report
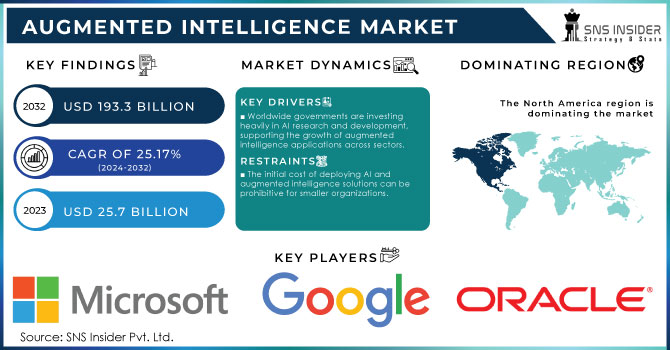
Augmented Intelligence Market Size was valued at USD 25.7 Billion in 2023 and is expected to reach USD 193.3 Billion by 2032, growing at a CAGR of 25.17% over the forecast period 2024-2032.
The augmented intelligence market has experienced considerable growth on a global scale as a result of the governments’ increased focus on digitalization. As of the recent statistics provided by the U.S. Department of Commerce, the federal agencies are planning to allocate approximately $7.5 billion to AI and other technologies in 2023, which marks a 12% increase from 2022 level. The significant investments are aimed at increasing the country’s economy by creating the environment in which artificial intelligence and its augmented variation can flourish. In Europe, the European Union allocated €10 billion to R&D in AI in the framework of the Horizon Europe plan, showing that the union is willing to concentrate on responsible use of AI technologies as one of the leading players globally.
Increased investments in AI training programs, regulations, and public-private partnerships in such industries as healthcare, automotive, and finance that are the most regulated are likely to encourage businesses to expand the use of advanced AI-assisted solutions. AI-based virtual assistants help organizations in enhancing the productivity of their customer service specialists and allow them to concentrate on complicated inquiries. As hybrid workforce models are becoming more widespread, the use of AI in combination with human involvement can boost productivity and improve decision-making. Another example of the usage of real-time data processing by AI is the retail sector, which uses this method for management of supplies and understanding of customer needs. Therefore, when artificial and human capacities are combined, innovative solutions can be developed and used to improve business operation in the digital environment. Augmented intelligence described as the collaboration between a computer and a human to produce effective and efficient results. For example, AI will play a critical role in banks and financial institutions, since this human-machine pairing will enable them to process business intelligence and improve employee-customer contact.
Market dynamics
Drivers
Worldwide governments are investing heavily in AI research and development, supporting the growth of augmented intelligence applications across sectors.
AI-driven solutions improve diagnostics, treatment planning, and operational efficiencies, making augmented intelligence crucial in healthcare.
Augmented intelligence enhances collaboration between AI tools and human workers, boosting productivity in hybrid work environments.
Businesses are increasingly using sophisticated analytics, smart contracts, machine intelligence, and the Internet of things.
The increased use of AI in healthcare is one of the key factors advancing the growth of the augmented intelligence market. As more and more healthcare organizations are opting for AI solutions to improve patient care, streamline operations, and reduce diagnostic mistakes, the adoption of such solutions should rise. AI algorithms help interpret medical images, patient records, and genetic sequencing to provide more accurate medical diagnostics and personalized treatment plans. For example, it was reported in 2023 by the U.S. Food and Drug Administration that there was a 30% increase in medical devices powered by AI approved for use, compared to the previous year. Such devices help detect different diseases, such as cancer, heart, or neurodegenerative diseases, at an early stage, and with higher accuracy. The use of AI in healthcare also reduces errors made by humans in decisions concerning treatment. According to a study published in 2023 by the British Medical Journal, AI microscopy, whole-slide imaging, and PCR systems helped cut diagnostic errors by 15-20%, particularly in the fields of radiology and pathology. Additionally, the government’s interest in AI solutions for healthcare has been growing, with the European Union having announced to invest over €1.5 billion in 2023 to fund AI research and innovation, where the focus is mostly on healthcare. All these factors help drive the market for augmented intelligence, reflective of the growing adoption of AI in healthcare.
Restraints:
The initial cost of deploying AI and augmented intelligence solutions can be prohibitive for smaller organizations.
The increased use of AI for processing sensitive data raises concerns about privacy breaches and cybersecurity risks.
There is a shortage of professionals with the necessary expertise to implement and manage augmented intelligence systems.
Integrating AI into existing systems can be complex and time-consuming, posing challenges for businesses with limited technical capabilities.
One of the significant restraints in the augmented intelligence market is the lack of a competent workforce required to properly run and implement AI-based systems. As AI is developing and becoming more advanced, it creates an increased demand for personnel qualified in artificial intelligence, machine learning, data science etc. However, such specialized personnel is scarce in the job market. According to the World Economic Forum’s 2023 Future of Jobs Report, half of the companies across the globe already deal with the AI skill gaps. In addition, in 2024 recent survey over 57% of organizations reported facing a difficulty in finding a qualified AI talent required to support advanced technology implementation. The issue results in many companies implementing augmented intelligence solutions, not being technically skilled and armed enough to manage them effectively. The need for skilled professionals not only increases operational costs but also slows down the adoption of AI-driven tools, limiting the potential for augmented intelligence to be fully realized in many industries.
Segment analysis
By Component
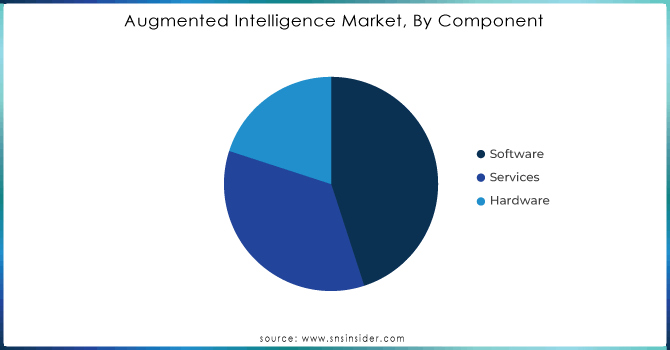
The software segment led the market and held largest share and accounted more than 43% of the revenue share in 2023. The prevalence of software as the major component of augmented intelligence can be attributed to the rapid increase in the demand for more advanced AI-empowered platforms that could enhance human decision-making. Global governments prioritize the integration of AI in their industries, resulting in the increased pace of AI-based software development innovation. Notably, the China Ministry of Industry and Information Technology reported that AI software solutions allowed manufacturers in China to heighten their sector’s efficiency by 20% in 2023 by enabling them to automate sophisticated tasks, improve operational efficiency, and gain the ability to draw data-based insights.
The service segment is projected to grow at the fastest growth rate from 2024 to 2032. The major driving force for the rapid growth of the service share will be the ever-increasing need for consulting, implementation, and training services as companies and organizations struggle with the effective deployment of the new AI solutions. Governments are also playing a crucial role here; the U.K. government’s 2023 AI White Paper emphasizes the need for a skilled workforce and AI literacy to ensure successful implementation, leading to a surge in demand for service providers who offer specialized AI training and support. Therefore, the tendency to high demand for the service providers that offer specialized training along with multifaceted AI solutions will influence the exponential growth of the service segment over the projection period.
Need any customization research on Augmented Intelligence Market - Enquiry Now
By vertical
In 2023, the IT and telecom segment dominated the augmented intelligence market in the based on vertical. This sector accounted for a significant portion of the global market share, driven by its pivotal role in the digital infrastructure and the increased emphasis on AI-driven analytics. According to FCC, in the U.S. telecom industry, the adoption of AI increased by 15% in 2023, specifically in network optimization, customer service automation, and cybersecurity. The telecom companies are utilizing augmented intelligence for operational functions, which allows them to navigate diverse and immense datasets provided by the launch of IoT and 5G networks. The local government’s pressure on the implementation of 5G infrastructure, accompanied by extensive spending on AI-adjunct for network solutions, are the strongest boost for the IT & Telecom vertical. The sector’s ability to adapt quickly to technological advancements further solidifies its position as a key driver in the augmented intelligence market.
Regional Analysis | North America Leads the Market
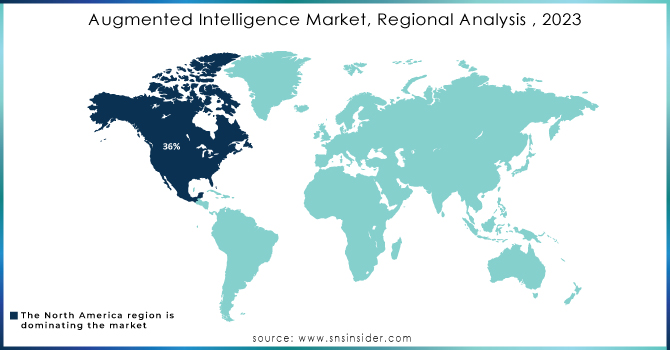
North America dominated the augmented intelligence market, accounted more than 36% share of the global market. The United States government is the main factor for the leading position of North America in the augmented intelligence industry. The National Artificial Intelligence Initiative Office sates that, the U.S. government budgeted a record $13 billion for its efforts in AI research in 2023. Furthermore, North America is a home for various giants like Google, Facebook, IBM, and several independent research institutions supported by the country’s government. The region has one of the best regulations on AI that ensures no misuse of the technology, thus providing a conducive environment for stakeholders to invest in augmented intelligence to public and private sectors. The North American region has also been dominant in augmented intelligence because of the current MG workforce and availability of exposure to the most advanced research in the world. North America’s leading position in this market will continue owing to adequate support from the government and the current high adoption rates in the healthcare, manufacturing, and retail markets.
Asia-Pacific’s market is expected to grow with the higher CAGR in the forecast period of 2024-2032. AI is widely employed in the fintech sector to strengthen digital banking, enhance financial inclusion and manage risk. Furthermore, AI algorithms are employed to evaluate consumer behaviour, credit quality, and transaction history. Through analyzing consumer data, the fintech sector has been able to improve fraud detection, credit ratings, and personalized financial products and services. In Singapore, Hong Kong, and Mumbai, the main financial hubs, banks, startups, and authorities are employing AI to create safe and streamlined financial systems.
KEY PLAYERS:
IBM (IBM Watson, IBM Watson Discovery)
Microsoft (Microsoft Azure AI, Microsoft Cognitive Services)
Google (Google Cloud AI, Google Assistant)
Amazon Web Services (AWS) (AWS SageMaker, AWS Lex)
Salesforce (Salesforce Einstein, Salesforce Service Cloud)
Oracle (Oracle AI Platform, Oracle Autonomous Database)
SAP (SAP Leonardo, SAP AI Core)
Intel (Intel Nervana, Intel Movidius)
NVIDIA (NVIDIA DGX Systems, NVIDIA Clara)
Palantir Technologies (Palantir Foundry, Palantir Gotham)
Hewlett Packard Enterprise (HPE) (HPE Ezmeral, HPE Nimble Storage)
UiPath (UiPath Studio, UiPath Orchestrator)
Qualcomm (Qualcomm Snapdragon AI, Qualcomm AI Engine)
Cerner Corporation (Cerner Millennium, Cerner HealtheDataLab)
OpenText (OpenText Magellan, OpenText Business Network)
Adobe (Adobe Sensei, Adobe Experience Cloud)
Baidu (Baidu Apollo, Baidu DuerOS)
SAS Institute (SAS Viya, SAS Analytics Cloud)
Nexar (Nexar AI Dashcams, Nexar Fleet)
and others in final Report.
Report Attributes | Details |
Market Size in 2023 | USD 25.7 Bn |
Market Size by 2032 | USD 193.3 Bn |
CAGR | CAGR of 25.17% From 2024 to 2032 |
Base Year | 2023 |
Forecast Period | 2024-2032 |
Historical Data | 2020-2022 |
Report Scope & Coverage | Market Size, Segments Analysis, Competitive Landscape, Regional Analysis, DROC & SWOT Analysis, Forecast Outlook |
Key Segments | • By Component (Hardware, Software, Services) • By Technology (Machine Learning, Natural Language Processing, Context-Aware Computing, Computer Vision, Others) • By Organization Size (Small and Medium-Sized Enterprises, Large Enterprises) • By Vertical (IT and Telecom, BFSI, Healthcare, Manufacturing, Automotive, Agriculture, Others) |
Regional Analysis/Coverage | North America (US, Canada, Mexico), Europe (Eastern Europe [Poland, Romania, Hungary, Turkey, Rest of Eastern Europe] Western Europe] Germany, France, UK, Italy, Spain, Netherlands, Switzerland, Austria, Rest of Western Europe]), Asia Pacific (China, India, Japan, South Korea, Vietnam, Singapore, Australia, Rest of Asia Pacific), Middle East & Africa (Middle East [UAE, Egypt, Saudi Arabia, Qatar, Rest of Middle East], Africa [Nigeria, South Africa, Rest of Africa], Latin America (Brazil, Argentina, Colombia, Rest of Latin America) |
Company Profiles | Amazon Web Services, Inc., International Business Machines Corporation, SAS Institute, Microsoft Corporation, QlikTech International AB, Salesforce.com, Inc., Samsung, SAP SE, Sisense Inc., Adobe, NVIDIA |
Key Drivers | • Businesses are increasingly using sophisticated analytics, smart contracts, machine intelligence, and the internet of things. |
Market Opportunities | • The usage of augmented intelligence solutions by large corporations is on the rise. • An increase in the quantity and variety of data inside an automated system. |
Ans:- The estimated market size for the Augmented Intelligence market for the year 2032 is USD 193.3 Bn.
Ans:- Businesses are increasingly using sophisticated analytics, smart contracts, machine intelligence, and the internet of things and Increasing usage of digital media in order to satisfy client expectations.
Ans:- The segments covered in the Augmented Intelligence market report for study are On The Basis of Component, Technology, Organization Size, Industry Vertical etc
Ans:- The major key players are Amazon Web Services, Inc., International Business Machines Corporation, Micron Technology, Inc., Microsoft Corporation, QlikTech International AB, Salesforce.com, Inc., Samsung, SAP SE, Sisense Inc., TIBCO Software Inc.
Ans:- Key Stakeholders Considered in the study are Raw material vendors, Distributors/traders/wholesalers/suppliers, Regulatory authorities, including government agencies and NGO, Importers and exporters etc
1.1 Market Definition
1.2 Scope (Inclusion and Exclusions)
1.3 Research Assumptions
2. Executive Summary
2.1 Market Overview
2.2 Regional Synopsis
2.3 Competitive Summary
3. Research Methodology
3.1 Top-Down Approach
3.2 Bottom-up Approach
3.3. Data Validation
3.4 Primary Interviews
4. Market Dynamics Impact Analysis
4.1 Market Driving Factors Analysis
4.1.1 Drivers
4.1.2 Restraints
4.1.3 Opportunities
4.1.4 Challenges
4.2 PESTLE Analysis
4.3 Porter’s Five Forces Model
5. Statistical Insights and Trends Reporting
5.1 Adoption Rates of Emerging Technologies
5.2 Network Infrastructure Expansion, by Region
5.3 Cybersecurity Incidents, by Region (2020-2023)
5.4 Cloud Services Usage, by Region
6. Competitive Landscape
6.1 List of Major Companies, By Region
6.2 Market Share Analysis, By Region
6.3 Type Benchmarking
6.3.1 Type specifications and features
6.3.2 Pricing
6.4 Strategic Initiatives
6.4.1 Marketing and promotional activities
6.4.2 Distribution and supply chain strategies
6.4.3 Expansion plans and new Age Cohort launches
6.4.4 Strategic partnerships and collaborations
6.5 Technological Advancements
6.6 Market Positioning and Branding
7. Augmented Intelligence Market Segmentation, By Component
7.1 Chapter Overview
7.2 Hardware
7.2.1 Hardware Market Trends Analysis (2020-2032)
7.2.2 Hardware Market Size Estimates and Forecasts to 2032 (USD Billion)
7.3 Software
7.3.1 Software Market Trends Analysis (2020-2032)
7.3.2 Software Market Size Estimates and Forecasts to 2032 (USD Billion)
7.4 Services
7.4.1 Services Market Trends Analysis (2020-2032)
7.4.2 Services Market Size Estimates and Forecasts to 2032 (USD Billion)
8. Augmented Intelligence Market Segmentation, By Technology
8.1 Chapter Overview
8.2 Machine Learning
8.2.1 Machine Learning Market Trends Analysis (2020-2032)
8.2.2 Machine Learning Market Size Estimates and Forecasts to 2032 (USD Billion)
8.3 Natural Language Processing
8.3.1 Natural Language Processing Market Trends Analysis (2020-2032)
8.3.2 Natural Language Processing Market Size Estimates and Forecasts to 2032 (USD Billion)
8.4 Context-Aware Computing
8.4.1 Context-Aware Computing Market Trends Analysis (2020-2032)
8.4.2 Context-Aware Computing Market Size Estimates and Forecasts to 2032 (USD Billion)
8.5 Computer Vision
8.5.1 Computer Vision Market Trends Analysis (2020-2032)
8.5.2 Computer Vision Market Size Estimates and Forecasts to 2032 (USD Billion)
8.6 Others
8.6.1 Others Market Trends Analysis (2020-2032)
8.6.2 Others Market Size Estimates and Forecasts to 2032 (USD Billion)
9. Augmented Intelligence Market Segmentation, By Organization Size
9.1 Chapter Overview
9.2 Small and Medium-Sized Enterprises
9.2.1 Small and Medium-Sized Enterprises Market Trends Analysis (2020-2032)
9.2.2 Small and Medium-Sized Enterprises Market Size Estimates and Forecasts to 2032 (USD Billion)
9.3 Large Enterprises
9.3.1 Large Enterprises Market Trends Analysis (2020-2032)
9.3.2 Large Enterprises Market Size Estimates and Forecasts to 2032 (USD Billion)
10. Augmented Intelligence Market Segmentation, By Vertical
10.1 Chapter Overview
10.2 IT and Telecom
10.2.1 IT and Telecom Market Trends Analysis (2020-2032)
10.2.2 IT and Telecom Market Size Estimates and Forecasts to 2032 (USD Billion)
10.3 BFSI
10.3.1 BFSI Market Trends Analysis (2020-2032)
10.3.2 BFSI Market Size Estimates and Forecasts to 2032 (USD Billion)
10.4 Healthcare
10.4.1 Healthcare Market Trends Analysis (2020-2032)
10.4.2 Healthcare Market Size Estimates and Forecasts to 2032 (USD Billion)
10.5 Manufacturing
10.5.1 Manufacturing Market Trends Analysis (2020-2032)
10.5.2 Manufacturing Market Size Estimates and Forecasts to 2032 (USD Billion)
10.6 Automotive
10.6.1 Automotive Market Trends Analysis (2020-2032)
10.6.2 Automotive Market Size Estimates and Forecasts to 2032 (USD Billion)
10.7 Agriculture
10.7.1 Agriculture Market Trends Analysis (2020-2032)
10.7.2 Agriculture Market Size Estimates and Forecasts to 2032 (USD Billion)
10.8 Others
10.8.1 Others Market Trends Analysis (2020-2032)
10.8.2 Others Market Size Estimates and Forecasts to 2032 (USD Billion)
11. Regional Analysis
11.1 Chapter Overview
11.2 North America
11.2.1 Trends Analysis
11.2.2 North America Augmented Intelligence Market Estimates and Forecasts, by Country (2020-2032) (USD Billion)
11.2.3 North America Augmented Intelligence Market Estimates and Forecasts, By Component (2020-2032) (USD Billion)
11.2.4 North America Augmented Intelligence Market Estimates and Forecasts, By Technology (2020-2032) (USD Billion)
11.2.5 North America Augmented Intelligence Market Estimates and Forecasts, By Organization Size (2020-2032) (USD Billion)
11.2.6 North America Augmented Intelligence Market Estimates and Forecasts, By Vertical (2020-2032) (USD Billion)
11.2.7 USA
11.2.7.1 USA Augmented Intelligence Market Estimates and Forecasts, By Component (2020-2032) (USD Billion)
11.2.7.2 USA Augmented Intelligence Market Estimates and Forecasts, By Technology (2020-2032) (USD Billion)
11.2.7.3 USA Augmented Intelligence Market Estimates and Forecasts, By Organization Size (2020-2032) (USD Billion)
11.2.7.4 USA Augmented Intelligence Market Estimates and Forecasts, By Vertical (2020-2032) (USD Billion)
11.2.8 Canada
11.2.8.1 Canada Augmented Intelligence Market Estimates and Forecasts, By Component (2020-2032) (USD Billion)
11.2.8.2 Canada Augmented Intelligence Market Estimates and Forecasts, By Technology (2020-2032) (USD Billion)
11.2.8.3 Canada Augmented Intelligence Market Estimates and Forecasts, By Organization Size (2020-2032) (USD Billion)
11.2.8.4 Canada Augmented Intelligence Market Estimates and Forecasts, By Vertical (2020-2032) (USD Billion)
11.2.9 Mexico
11.2.9.1 Mexico Augmented Intelligence Market Estimates and Forecasts, By Component (2020-2032) (USD Billion)
11.2.9.2 Mexico Augmented Intelligence Market Estimates and Forecasts, By Technology (2020-2032) (USD Billion)
11.2.9.3 Mexico Augmented Intelligence Market Estimates and Forecasts, By Organization Size (2020-2032) (USD Billion)
11.2.9.4 Mexico Augmented Intelligence Market Estimates and Forecasts, By Vertical (2020-2032) (USD Billion)
11.3 Europe
11.3.1 Eastern Europe
11.3.1.1 Trends Analysis
11.3.1.2 Eastern Europe Augmented Intelligence Market Estimates and Forecasts, by Country (2020-2032) (USD Billion)
11.3.1.3 Eastern Europe Augmented Intelligence Market Estimates and Forecasts, By Component (2020-2032) (USD Billion)
11.3.1.4 Eastern Europe Augmented Intelligence Market Estimates and Forecasts, By Technology (2020-2032) (USD Billion)
11.3.1.5 Eastern Europe Augmented Intelligence Market Estimates and Forecasts, By Organization Size (2020-2032) (USD Billion)
11.3.1.6 Eastern Europe Augmented Intelligence Market Estimates and Forecasts, By Vertical (2020-2032) (USD Billion)
11.3.1.7 Poland
11.3.1.7.1 Poland Augmented Intelligence Market Estimates and Forecasts, By Component (2020-2032) (USD Billion)
11.3.1.7.2 Poland Augmented Intelligence Market Estimates and Forecasts, By Technology (2020-2032) (USD Billion)
11.3.1.7.3 Poland Augmented Intelligence Market Estimates and Forecasts, By Organization Size (2020-2032) (USD Billion)
11.3.1.7.4 Poland Augmented Intelligence Market Estimates and Forecasts, By Vertical (2020-2032) (USD Billion)
11.3.1.8 Romania
11.3.1.8.1 Romania Augmented Intelligence Market Estimates and Forecasts, By Component (2020-2032) (USD Billion)
11.3.1.8.2 Romania Augmented Intelligence Market Estimates and Forecasts, By Technology (2020-2032) (USD Billion)
11.3.1.8.3 Romania Augmented Intelligence Market Estimates and Forecasts, By Organization Size (2020-2032) (USD Billion)
11.3.1.8.4 Romania Augmented Intelligence Market Estimates and Forecasts, By Vertical (2020-2032) (USD Billion)
11.3.1.9 Hungary
11.3.1.9.1 Hungary Augmented Intelligence Market Estimates and Forecasts, By Component (2020-2032) (USD Billion)
11.3.1.9.2 Hungary Augmented Intelligence Market Estimates and Forecasts, By Technology (2020-2032) (USD Billion)
11.3.1.9.3 Hungary Augmented Intelligence Market Estimates and Forecasts, By Organization Size (2020-2032) (USD Billion)
11.3.1.9.4 Hungary Augmented Intelligence Market Estimates and Forecasts, By Vertical (2020-2032) (USD Billion)
11.3.1.10 Turkey
11.3.1.10.1 Turkey Augmented Intelligence Market Estimates and Forecasts, By Component (2020-2032) (USD Billion)
11.3.1.10.2 Turkey Augmented Intelligence Market Estimates and Forecasts, By Technology (2020-2032) (USD Billion)
11.3.1.10.3 Turkey Augmented Intelligence Market Estimates and Forecasts, By Organization Size (2020-2032) (USD Billion)
11.3.1.10.4 Turkey Augmented Intelligence Market Estimates and Forecasts, By Vertical (2020-2032) (USD Billion)
11.3.1.11 Rest of Eastern Europe
11.3.1.11.1 Rest of Eastern Europe Augmented Intelligence Market Estimates and Forecasts, By Component (2020-2032) (USD Billion)
11.3.1.11.2 Rest of Eastern Europe Augmented Intelligence Market Estimates and Forecasts, By Technology (2020-2032) (USD Billion)
11.3.1.11.3 Rest of Eastern Europe Augmented Intelligence Market Estimates and Forecasts, By Organization Size (2020-2032) (USD Billion)
11.3.1.11.4 Rest of Eastern Europe Augmented Intelligence Market Estimates and Forecasts, By Vertical (2020-2032) (USD Billion)
11.3.2 Western Europe
11.3.2.1 Trends Analysis
11.3.2.2 Western Europe Augmented Intelligence Market Estimates and Forecasts, by Country (2020-2032) (USD Billion)
11.3.2.3 Western Europe Augmented Intelligence Market Estimates and Forecasts, By Component (2020-2032) (USD Billion)
11.3.2.4 Western Europe Augmented Intelligence Market Estimates and Forecasts, By Technology (2020-2032) (USD Billion)
11.3.2.5 Western Europe Augmented Intelligence Market Estimates and Forecasts, By Organization Size (2020-2032) (USD Billion)
11.3.2.6 Western Europe Augmented Intelligence Market Estimates and Forecasts, By Vertical (2020-2032) (USD Billion)
11.3.2.7 Germany
11.3.2.7.1 Germany Augmented Intelligence Market Estimates and Forecasts, By Component (2020-2032) (USD Billion)
11.3.2.7.2 Germany Augmented Intelligence Market Estimates and Forecasts, By Technology (2020-2032) (USD Billion)
11.3.2.7.3 Germany Augmented Intelligence Market Estimates and Forecasts, By Organization Size (2020-2032) (USD Billion)
11.3.2.7.4 Germany Augmented Intelligence Market Estimates and Forecasts, By Vertical (2020-2032) (USD Billion)
11.3.2.8 France
11.3.2.8.1 France Augmented Intelligence Market Estimates and Forecasts, By Component (2020-2032) (USD Billion)
11.3.2.8.2 France Augmented Intelligence Market Estimates and Forecasts, By Technology (2020-2032) (USD Billion)
11.3.2.8.3 France Augmented Intelligence Market Estimates and Forecasts, By Organization Size (2020-2032) (USD Billion)
11.3.2.8.4 France Augmented Intelligence Market Estimates and Forecasts, By Vertical (2020-2032) (USD Billion)
11.3.2.9 UK
11.3.2.9.1 UK Augmented Intelligence Market Estimates and Forecasts, By Component (2020-2032) (USD Billion)
11.3.2.9.2 UK Augmented Intelligence Market Estimates and Forecasts, By Technology (2020-2032) (USD Billion)
11.3.2.9.3 UK Augmented Intelligence Market Estimates and Forecasts, By Organization Size (2020-2032) (USD Billion)
11.3.2.9.4 UK Augmented Intelligence Market Estimates and Forecasts, By Vertical (2020-2032) (USD Billion)
11.3.2.10 Italy
11.3.2.10.1 Italy Augmented Intelligence Market Estimates and Forecasts, By Component (2020-2032) (USD Billion)
11.3.2.10.2 Italy Augmented Intelligence Market Estimates and Forecasts, By Technology (2020-2032) (USD Billion)
11.3.2.10.3 Italy Augmented Intelligence Market Estimates and Forecasts, By Organization Size (2020-2032) (USD Billion)
11.3.2.10.4 Italy Augmented Intelligence Market Estimates and Forecasts, By Vertical (2020-2032) (USD Billion)
11.3.2.11 Spain
11.3.2.11.1 Spain Augmented Intelligence Market Estimates and Forecasts, By Component (2020-2032) (USD Billion)
11.3.2.11.2 Spain Augmented Intelligence Market Estimates and Forecasts, By Technology (2020-2032) (USD Billion)
11.3.2.11.3 Spain Augmented Intelligence Market Estimates and Forecasts, By Organization Size (2020-2032) (USD Billion)
11.3.2.11.4 Spain Augmented Intelligence Market Estimates and Forecasts, By Vertical (2020-2032) (USD Billion)
11.3.2.12 Netherlands
11.3.2.12.1 Netherlands Augmented Intelligence Market Estimates and Forecasts, By Component (2020-2032) (USD Billion)
11.3.2.12.2 Netherlands Augmented Intelligence Market Estimates and Forecasts, By Technology (2020-2032) (USD Billion)
11.3.2.12.3 Netherlands Augmented Intelligence Market Estimates and Forecasts, By Organization Size (2020-2032) (USD Billion)
11.3.2.12.4 Netherlands Augmented Intelligence Market Estimates and Forecasts, By Vertical (2020-2032) (USD Billion)
11.3.2.13 Switzerland
11.3.2.13.1 Switzerland Augmented Intelligence Market Estimates and Forecasts, By Component (2020-2032) (USD Billion)
11.3.2.13.2 Switzerland Augmented Intelligence Market Estimates and Forecasts, By Technology (2020-2032) (USD Billion)
11.3.2.13.3 Switzerland Augmented Intelligence Market Estimates and Forecasts, By Organization Size (2020-2032) (USD Billion)
11.3.2.13.4 Switzerland Augmented Intelligence Market Estimates and Forecasts, By Vertical (2020-2032) (USD Billion)
11.3.2.14 Austria
11.3.2.14.1 Austria Augmented Intelligence Market Estimates and Forecasts, By Component (2020-2032) (USD Billion)
11.3.2.14.2 Austria Augmented Intelligence Market Estimates and Forecasts, By Technology (2020-2032) (USD Billion)
11.3.2.14.3 Austria Augmented Intelligence Market Estimates and Forecasts, By Organization Size (2020-2032) (USD Billion)
11.3.2.14.4 Austria Augmented Intelligence Market Estimates and Forecasts, By Vertical (2020-2032) (USD Billion)
11.3.2.15 Rest of Western Europe
11.3.2.15.1 Rest of Western Europe Augmented Intelligence Market Estimates and Forecasts, By Component (2020-2032) (USD Billion)
11.3.2.15.2 Rest of Western Europe Augmented Intelligence Market Estimates and Forecasts, By Technology (2020-2032) (USD Billion)
11.3.2.15.3 Rest of Western Europe Augmented Intelligence Market Estimates and Forecasts, By Organization Size (2020-2032) (USD Billion)
11.3.2.15.4 Rest of Western Europe Augmented Intelligence Market Estimates and Forecasts, By Vertical (2020-2032) (USD Billion)
11.4 Asia Pacific
11.4.1 Trends Analysis
11.4.2 Asia Pacific Augmented Intelligence Market Estimates and Forecasts, by Country (2020-2032) (USD Billion)
11.4.3 Asia Pacific Augmented Intelligence Market Estimates and Forecasts, By Component (2020-2032) (USD Billion)
11.4.4 Asia Pacific Augmented Intelligence Market Estimates and Forecasts, By Technology (2020-2032) (USD Billion)
11.4.5 Asia Pacific Augmented Intelligence Market Estimates and Forecasts, By Organization Size (2020-2032) (USD Billion)
11.4.6 Asia Pacific Augmented Intelligence Market Estimates and Forecasts, By Vertical (2020-2032) (USD Billion)
11.4.7 China
11.4.7.1 China Augmented Intelligence Market Estimates and Forecasts, By Component (2020-2032) (USD Billion)
11.4.7.2 China Augmented Intelligence Market Estimates and Forecasts, By Technology (2020-2032) (USD Billion)
11.4.7.3 China Augmented Intelligence Market Estimates and Forecasts, By Organization Size (2020-2032) (USD Billion)
11.4.7.4 China Augmented Intelligence Market Estimates and Forecasts, By Vertical (2020-2032) (USD Billion)
11.4.8 India
11.4.8.1 India Augmented Intelligence Market Estimates and Forecasts, By Component (2020-2032) (USD Billion)
11.4.8.2 India Augmented Intelligence Market Estimates and Forecasts, By Technology (2020-2032) (USD Billion)
11.4.8.3 India Augmented Intelligence Market Estimates and Forecasts, By Organization Size (2020-2032) (USD Billion)
11.4.8.4 India Augmented Intelligence Market Estimates and Forecasts, By Vertical (2020-2032) (USD Billion)
11.4.9 Japan
11.4.9.1 Japan Augmented Intelligence Market Estimates and Forecasts, By Component (2020-2032) (USD Billion)
11.4.9.2 Japan Augmented Intelligence Market Estimates and Forecasts, By Technology (2020-2032) (USD Billion)
11.4.9.3 Japan Augmented Intelligence Market Estimates and Forecasts, By Organization Size (2020-2032) (USD Billion)
11.4.9.4 Japan Augmented Intelligence Market Estimates and Forecasts, By Vertical (2020-2032) (USD Billion)
11.4.10 South Korea
11.4.10.1 South Korea Augmented Intelligence Market Estimates and Forecasts, By Component (2020-2032) (USD Billion)
11.4.10.2 South Korea Augmented Intelligence Market Estimates and Forecasts, By Technology (2020-2032) (USD Billion)
11.4.10.3 South Korea Augmented Intelligence Market Estimates and Forecasts, By Organization Size (2020-2032) (USD Billion)
11.4.10.4 South Korea Augmented Intelligence Market Estimates and Forecasts, By Vertical (2020-2032) (USD Billion)
11.4.11 Vietnam
11.4.11.1 Vietnam Augmented Intelligence Market Estimates and Forecasts, By Component (2020-2032) (USD Billion)
11.4.11.2 Vietnam Augmented Intelligence Market Estimates and Forecasts, By Technology (2020-2032) (USD Billion)
11.4.11.3 Vietnam Augmented Intelligence Market Estimates and Forecasts, By Organization Size (2020-2032) (USD Billion)
11.4.11.4 Vietnam Augmented Intelligence Market Estimates and Forecasts, By Vertical (2020-2032) (USD Billion)
11.4.12 Singapore
11.4.12.1 Singapore Augmented Intelligence Market Estimates and Forecasts, By Component (2020-2032) (USD Billion)
11.4.12.2 Singapore Augmented Intelligence Market Estimates and Forecasts, By Technology (2020-2032) (USD Billion)
11.4.12.3 Singapore Augmented Intelligence Market Estimates and Forecasts, By Organization Size (2020-2032) (USD Billion)
11.4.12.4 Singapore Augmented Intelligence Market Estimates and Forecasts, By Vertical (2020-2032) (USD Billion)
11.4.13 Australia
11.4.13.1 Australia Augmented Intelligence Market Estimates and Forecasts, By Component (2020-2032) (USD Billion)
11.4.13.2 Australia Augmented Intelligence Market Estimates and Forecasts, By Technology (2020-2032) (USD Billion)
11.4.13.3 Australia Augmented Intelligence Market Estimates and Forecasts, By Organization Size (2020-2032) (USD Billion)
11.4.13.4 Australia Augmented Intelligence Market Estimates and Forecasts, By Vertical (2020-2032) (USD Billion)
11.4.14 Rest of Asia Pacific
11.4.14.1 Rest of Asia Pacific Augmented Intelligence Market Estimates and Forecasts, By Component (2020-2032) (USD Billion)
11.4.14.2 Rest of Asia Pacific Augmented Intelligence Market Estimates and Forecasts, By Technology (2020-2032) (USD Billion)
11.4.14.3 Rest of Asia Pacific Augmented Intelligence Market Estimates and Forecasts, By Organization Size (2020-2032) (USD Billion)
11.4.14.4 Rest of Asia Pacific Augmented Intelligence Market Estimates and Forecasts, By Vertical (2020-2032) (USD Billion)
11.5 Middle East and Africa
11.5.1 Middle East
11.5.1.1 Trends Analysis
11.5.1.2 Middle East Augmented Intelligence Market Estimates and Forecasts, by Country (2020-2032) (USD Billion)
11.5.1.3 Middle East Augmented Intelligence Market Estimates and Forecasts, By Component (2020-2032) (USD Billion)
11.5.1.4 Middle East Augmented Intelligence Market Estimates and Forecasts, By Technology (2020-2032) (USD Billion)
11.5.1.5 Middle East Augmented Intelligence Market Estimates and Forecasts, By Organization Size (2020-2032) (USD Billion)
11.5.1.6 Middle East Augmented Intelligence Market Estimates and Forecasts, By Vertical (2020-2032) (USD Billion)
11.5.1.7 UAE
11.5.1.7.1 UAE Augmented Intelligence Market Estimates and Forecasts, By Component (2020-2032) (USD Billion)
11.5.1.7.2 UAE Augmented Intelligence Market Estimates and Forecasts, By Technology (2020-2032) (USD Billion)
11.5.1.7.3 UAE Augmented Intelligence Market Estimates and Forecasts, By Organization Size (2020-2032) (USD Billion)
11.5.1.7.4 UAE Augmented Intelligence Market Estimates and Forecasts, By Vertical (2020-2032) (USD Billion)
11.5.1.8 Egypt
11.5.1.8.1 Egypt Augmented Intelligence Market Estimates and Forecasts, By Component (2020-2032) (USD Billion)
11.5.1.8.2 Egypt Augmented Intelligence Market Estimates and Forecasts, By Technology (2020-2032) (USD Billion)
11.5.1.8.3 Egypt Augmented Intelligence Market Estimates and Forecasts, By Organization Size (2020-2032) (USD Billion)
11.5.1.8.4 Egypt Augmented Intelligence Market Estimates and Forecasts, By Vertical (2020-2032) (USD Billion)
11.5.1.9 Saudi Arabia
11.5.1.9.1 Saudi Arabia Augmented Intelligence Market Estimates and Forecasts, By Component (2020-2032) (USD Billion)
11.5.1.9.2 Saudi Arabia Augmented Intelligence Market Estimates and Forecasts, By Technology (2020-2032) (USD Billion)
11.5.1.9.3 Saudi Arabia Augmented Intelligence Market Estimates and Forecasts, By Organization Size (2020-2032) (USD Billion)
11.5.1.9.4 Saudi Arabia Augmented Intelligence Market Estimates and Forecasts, By Vertical (2020-2032) (USD Billion)
11.5.1.10 Qatar
11.5.1.10.1 Qatar Augmented Intelligence Market Estimates and Forecasts, By Component (2020-2032) (USD Billion)
11.5.1.10.2 Qatar Augmented Intelligence Market Estimates and Forecasts, By Technology (2020-2032) (USD Billion)
11.5.1.10.3 Qatar Augmented Intelligence Market Estimates and Forecasts, By Organization Size (2020-2032) (USD Billion)
11.5.1.10.4 Qatar Augmented Intelligence Market Estimates and Forecasts, By Vertical (2020-2032) (USD Billion)
11.5.1.11 Rest of Middle East
11.5.1.11.1 Rest of Middle East Augmented Intelligence Market Estimates and Forecasts, By Component (2020-2032) (USD Billion)
11.5.1.11.2 Rest of Middle East Augmented Intelligence Market Estimates and Forecasts, By Technology (2020-2032) (USD Billion)
11.5.1.11.3 Rest of Middle East Augmented Intelligence Market Estimates and Forecasts, By Organization Size (2020-2032) (USD Billion)
11.5.1.11.4 Rest of Middle East Augmented Intelligence Market Estimates and Forecasts, By Vertical (2020-2032) (USD Billion)
11.5.2 Africa
11.5.2.1 Trends Analysis
11.5.2.2 Africa Augmented Intelligence Market Estimates and Forecasts, by Country (2020-2032) (USD Billion)
11.5.2.3 Africa Augmented Intelligence Market Estimates and Forecasts, By Component (2020-2032) (USD Billion)
11.5.2.4 Africa Augmented Intelligence Market Estimates and Forecasts, By Technology (2020-2032) (USD Billion)
11.5.2.5 Africa Augmented Intelligence Market Estimates and Forecasts, By Organization Size (2020-2032) (USD Billion)
11.5.2.6 Africa Augmented Intelligence Market Estimates and Forecasts, By Vertical (2020-2032) (USD Billion)
11.5.2.7 South Africa
11.5.2.7.1 South Africa Augmented Intelligence Market Estimates and Forecasts, By Component (2020-2032) (USD Billion)
11.5.2.7.2 South Africa Augmented Intelligence Market Estimates and Forecasts, By Technology (2020-2032) (USD Billion)
11.5.2.7.3 South Africa Augmented Intelligence Market Estimates and Forecasts, By Organization Size (2020-2032) (USD Billion)
11.5.2.7.4 South Africa Augmented Intelligence Market Estimates and Forecasts, By Vertical (2020-2032) (USD Billion)
11.5.2.8 Nigeria
11.5.2.8.1 Nigeria Augmented Intelligence Market Estimates and Forecasts, By Component (2020-2032) (USD Billion)
11.5.2.8.2 Nigeria Augmented Intelligence Market Estimates and Forecasts, By Technology (2020-2032) (USD Billion)
11.5.2.8.3 Nigeria Augmented Intelligence Market Estimates and Forecasts, By Organization Size (2020-2032) (USD Billion)
11.5.2.8.4 Nigeria Augmented Intelligence Market Estimates and Forecasts, By Vertical (2020-2032) (USD Billion)
11.5.2.9 Rest of Africa
11.5.2.9.1 Rest of Africa Augmented Intelligence Market Estimates and Forecasts, By Component (2020-2032) (USD Billion)
11.5.2.9.2 Rest of Africa Augmented Intelligence Market Estimates and Forecasts, By Technology (2020-2032) (USD Billion)
11.5.2.9.3 Rest of Africa Augmented Intelligence Market Estimates and Forecasts, By Organization Size (2020-2032) (USD Billion)
11.5.2.9.4 Rest of Africa Augmented Intelligence Market Estimates and Forecasts, By Vertical (2020-2032) (USD Billion)
11.6 Latin America
11.6.1 Trends Analysis
11.6.2 Latin America Augmented Intelligence Market Estimates and Forecasts, by Country (2020-2032) (USD Billion)
11.6.3 Latin America Augmented Intelligence Market Estimates and Forecasts, By Component (2020-2032) (USD Billion)
11.6.4 Latin America Augmented Intelligence Market Estimates and Forecasts, By Technology (2020-2032) (USD Billion)
11.6.5 Latin America Augmented Intelligence Market Estimates and Forecasts, By Organization Size (2020-2032) (USD Billion)
11.6.6 Latin America Augmented Intelligence Market Estimates and Forecasts, By Vertical (2020-2032) (USD Billion)
11.6.7 Brazil
11.6.7.1 Brazil Augmented Intelligence Market Estimates and Forecasts, By Component (2020-2032) (USD Billion)
11.6.7.2 Brazil Augmented Intelligence Market Estimates and Forecasts, By Technology (2020-2032) (USD Billion)
11.6.7.3 Brazil Augmented Intelligence Market Estimates and Forecasts, By Organization Size (2020-2032) (USD Billion)
11.6.7.4 Brazil Augmented Intelligence Market Estimates and Forecasts, By Vertical (2020-2032) (USD Billion)
11.6.8 Argentina
11.6.8.1 Argentina Augmented Intelligence Market Estimates and Forecasts, By Component (2020-2032) (USD Billion)
11.6.8.2 Argentina Augmented Intelligence Market Estimates and Forecasts, By Technology (2020-2032) (USD Billion)
11.6.8.3 Argentina Augmented Intelligence Market Estimates and Forecasts, By Organization Size (2020-2032) (USD Billion)
11.6.8.4 Argentina Augmented Intelligence Market Estimates and Forecasts, By Vertical (2020-2032) (USD Billion)
11.6.9 Colombia
11.6.9.1 Colombia Augmented Intelligence Market Estimates and Forecasts, By Component (2020-2032) (USD Billion)
11.6.9.2 Colombia Augmented Intelligence Market Estimates and Forecasts, By Technology (2020-2032) (USD Billion)
11.6.9.3 Colombia Augmented Intelligence Market Estimates and Forecasts, By Organization Size (2020-2032) (USD Billion)
11.6.9.4 Colombia Augmented Intelligence Market Estimates and Forecasts, By Vertical (2020-2032) (USD Billion)
11.6.10 Rest of Latin America
11.6.10.1 Rest of Latin America Augmented Intelligence Market Estimates and Forecasts, By Component (2020-2032) (USD Billion)
11.6.10.2 Rest of Latin America Augmented Intelligence Market Estimates and Forecasts, By Technology (2020-2032) (USD Billion)
11.6.10.3 Rest of Latin America Augmented Intelligence Market Estimates and Forecasts, By Organization Size (2020-2032) (USD Billion)
11.6.10.4 Rest of Latin America Augmented Intelligence Market Estimates and Forecasts, By Vertical (2020-2032) (USD Billion)
12. Company Profiles
12.1 Amazon Web Services, Inc.
12.1.1 Company Overview
12.1.2 Financial
12.1.3 Product / Services Offered
12.1.4 SWOT Analysis
12.2 International Business Machines Corporation
12.2.1 Company Overview
12.2.2 Financial
12.2.3 Product / Services Offered
12.2.4 SWOT Analysis
12.3 SAS Institute
12.3.1 Company Overview
12.3.2 Financial
12.3.3 Product / Services Offered
12.3.4 SWOT Analysis
12.4 Microsoft Corporation
12.4.1 Company Overview
12.4.2 Financial
12.4.3 Product / Services Offered
12.4.4 SWOT Analysis
12.5 QlikTech International AB
12.5.1 Company Overview
12.5.2 Financial
12.5.3 Product / Services Offered
12.5.4 SWOT Analysis
12.6 Salesforce.com, Inc.
12.6.1 Company Overview
12.6.2 Financial
12.6.3 Product / Services Offered
12.6.4 SWOT Analysis
12.7 Samsung
12.7.1 Company Overview
12.7.2 Financial
12.7.3 Product / Services Offered
12.7.4 SWOT Analysis
12.8 SAP SE
12.8.1 Company Overview
12.8.2 Financial
12.8.3 Product / Services Offered
12.8.4 SWOT Analysis
12.9 Sisense Inc.
12.9.1 Company Overview
12.9.2 Financial
12.9.3 Product / Services Offered
12.9.4 SWOT Analysis
12.10 Adobe
12.10.1 Company Overview
12.10.2 Financial
12.10.3 Product/ Services Offered
12.10.4 SWOT Analysis
13. Use Cases and Best Practices
14. Conclusion
An accurate research report requires proper strategizing as well as implementation. There are multiple factors involved in the completion of good and accurate research report and selecting the best methodology to compete the research is the toughest part. Since the research reports we provide play a crucial role in any company’s decision-making process, therefore we at SNS Insider always believe that we should choose the best method which gives us results closer to reality. This allows us to reach at a stage wherein we can provide our clients best and accurate investment to output ratio.
Each report that we prepare takes a timeframe of 350-400 business hours for production. Starting from the selection of titles through a couple of in-depth brain storming session to the final QC process before uploading our titles on our website we dedicate around 350 working hours. The titles are selected based on their current market cap and the foreseen CAGR and growth.
The 5 steps process:
Step 1: Secondary Research:
Secondary Research or Desk Research is as the name suggests is a research process wherein, we collect data through the readily available information. In this process we use various paid and unpaid databases which our team has access to and gather data through the same. This includes examining of listed companies’ annual reports, Journals, SEC filling etc. Apart from this our team has access to various associations across the globe across different industries. Lastly, we have exchange relationships with various university as well as individual libraries.
Step 2: Primary Research
When we talk about primary research, it is a type of study in which the researchers collect relevant data samples directly, rather than relying on previously collected data. This type of research is focused on gaining content specific facts that can be sued to solve specific problems. Since the collected data is fresh and first hand therefore it makes the study more accurate and genuine.
We at SNS Insider have divided Primary Research into 2 parts.
Part 1 wherein we interview the KOLs of major players as well as the upcoming ones across various geographic regions. This allows us to have their view over the market scenario and acts as an important tool to come closer to the accurate market numbers. As many as 45 paid and unpaid primary interviews are taken from both the demand and supply side of the industry to make sure we land at an accurate judgement and analysis of the market.
This step involves the triangulation of data wherein our team analyses the interview transcripts, online survey responses and observation of on filed participants. The below mentioned chart should give a better understanding of the part 1 of the primary interview.
Part 2: In this part of primary research the data collected via secondary research and the part 1 of the primary research is validated with the interviews from individual consultants and subject matter experts.
Consultants are those set of people who have at least 12 years of experience and expertise within the industry whereas Subject Matter Experts are those with at least 15 years of experience behind their back within the same space. The data with the help of two main processes i.e., FGDs (Focused Group Discussions) and IDs (Individual Discussions). This gives us a 3rd party nonbiased primary view of the market scenario making it a more dependable one while collation of the data pointers.
Step 3: Data Bank Validation
Once all the information is collected via primary and secondary sources, we run that information for data validation. At our intelligence centre our research heads track a lot of information related to the market which includes the quarterly reports, the daily stock prices, and other relevant information. Our data bank server gets updated every fortnight and that is how the information which we collected using our primary and secondary information is revalidated in real time.
Step 4: QA/QC Process
After all the data collection and validation our team does a final level of quality check and quality assurance to get rid of any unwanted or undesired mistakes. This might include but not limited to getting rid of the any typos, duplication of numbers or missing of any important information. The people involved in this process include technical content writers, research heads and graphics people. Once this process is completed the title gets uploader on our platform for our clients to read it.
Step 5: Final QC/QA Process:
This is the last process and comes when the client has ordered the study. In this process a final QA/QC is done before the study is emailed to the client. Since we believe in giving our clients a good experience of our research studies, therefore, to make sure that we do not lack at our end in any way humanly possible we do a final round of quality check and then dispatch the study to the client.
Key Segments:
By Component
Hardware
Software
Services
By Technology
Machine Learning
Natural Language Processing
Context-Aware Computing
Computer Vision
Others
By Organization Size
Small and Medium-Sized Enterprises
Large Enterprises
By Vertical
IT and Telecom
BFSI
Healthcare
Manufacturing
Automotive
Agriculture
Others
Request for Segment Customization as per your Business Requirement: Segment Customization Request
REGIONAL COVERAGE:
North America
US
Canada
Mexico
Europe
Eastern Europe
Poland
Romania
Hungary
Turkey
Rest of Eastern Europe
Western Europe
Germany
France
UK
Italy
Spain
Netherlands
Switzerland
Austria
Rest of Western Europe
Asia Pacific
China
India
Japan
South Korea
Vietnam
Singapore
Australia
Rest of Asia Pacific
Middle East & Africa
Middle East
UAE
Egypt
Saudi Arabia
Qatar
Rest of the Middle East
Africa
Nigeria
South Africa
Rest of Africa
Latin America
Brazil
Argentina
Colombia
Request for Country Level Research Report: Country Level Customization Request
Available Customization
With the given market data, SNS Insider offers customization as per the company’s specific needs. The following customization options are available for the report:
Product Analysis
Criss-Cross segment analysis (e.g. Product X Application)
Product Matrix which gives a detailed comparison of product portfolio of each company
Geographic Analysis
Additional countries in any of the regions
Company Information
Detailed analysis and profiling of additional market players (Up to five)
The Decision Intelligence Market is anticipated to reach from USD 12.7 billion in 2023 to USD 62.2 billion by 2032, growing at a CAGR of 19.31% over 2024-2032.
The Metrology Software Market size was valued at USD 998.65 million in 2023 and is expected to reach USD 1917.53 million by 2032 and grow at a CAGR of 7.52% over the forecast period of 2024-2032.
The Online Gambling & Betting Market was valued at USD 81.86 Billion in 2023 and is expected to reach USD 218.02 Billion by 2032, growing at a CAGR of 11.54% over the forecast period 2024-2032.
The Retail Media Platform Market Size was valued at USD 16.1 Billion in 2023 and will reach USD 33.7 Billion by 2032, growing at a CAGR of 8.6% by 2032.
The Digital Lending Platform Market size was valued at USD 10.3 Billion in 2023. It is expected to grow to USD 50.7 Billion by 2032 and grow at a CAGR of 22% over the forecast period of 2024-2032.
The Digital Health Market Size was USD 229.7 billion in 2023 & is expected to reach USD 1306.30 billion by 2032, growing at a CAGR of 20.63% from 2024-2032.
Hi! Click one of our member below to chat on Phone