Get More Information on Asset Performance Management Market - Request Sample Report
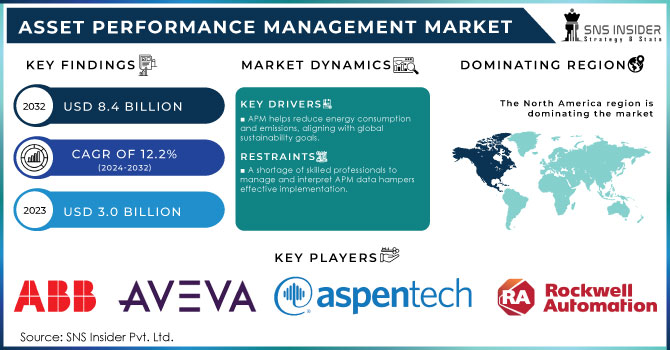
Asset Performance Management Market was valued at USD 3.0 billion in 2023 and is expected to reach USD 8.4 billion by 2032 and grow at a CAGR of 12.2% from 2024-2032.
The Asset Performance Management (APM) market focuses on optimizing the performance and reliability of physical assets through data analytics, machine learning, and predictive maintenance. It plays a crucial role in industries like oil and gas, manufacturing, energy, and utilities, where the need to enhance asset efficiency and reduce operational costs is paramount. APM solutions help organizations monitor asset health, predict failures, and extend the life of critical equipment, leading to improved productivity and safety.
Key drivers of this growth include the increasing adoption of Industrial Internet of Things (IoT) technologies, the rise in cloud-based solutions, and the growing focus on digital transformation across industries. The energy and utilities sector remains the largest market segment due to the high costs associated with equipment failure and maintenance. Additionally, advancements in artificial intelligence (AI) and machine learning (ML) have revolutionized APM by enabling more accurate predictive analytics, which helps organizations make informed decisions regarding asset management. The Asia-Pacific region is expected to witness the fastest growth due to rapid industrialization, technological adoption, and increasing investments in smart manufacturing. Nevertheless, obstacles like high implementation costs and data security concerns could impede market growth.
Market Dynamics
Drivers
APM helps reduce energy consumption and emissions, aligning with global sustainability goals.’
AI and ML technologies enable more accurate predictions of asset health and performance.
Predictive analytics reduce unplanned downtime and maintenance costs, boosting APM adoption.
Predictive analytics in the Asset Performance Management (APM) market leverage data, machine learning, and statistical algorithms to forecast potential asset failures before they occur. This proactive approach is crucial as it helps industries avoid unplanned downtime, which can be costly and disruptive. By analyzing data from sensors and historical performance records, predictive analytics can identify patterns and anomalies that indicate an impending failure.
In traditional maintenance models, equipment is often serviced at fixed intervals or only after a breakdown occurs, leading to either unnecessary maintenance costs or unexpected downtimes that halt operations. Predictive analytics, however, enables condition-based maintenance, allowing companies to perform maintenance only when needed. This greatly lowers maintenance expenses, enhances asset availability, and prolongs the life of essential equipment.
For industries like manufacturing, energy, and utilities, where machinery and equipment are central to operations, the ability to minimize downtime translates into significant cost savings and improved productivity. By optimizing asset performance and reliability, predictive analytics help companies achieve higher efficiency and better resource allocation, which are critical in today’s competitive market. Consequently, the adoption of APM solutions integrated with predictive analytics is accelerating as businesses recognize the value of predictive maintenance in driving operational excellence and reducing total ownership costs.
AI (Artificial Intelligence) and ML (Machine Learning) technologies enhance the accuracy of predicting asset health and performance in the Asset Performance Management (APM) market by analyzing vast amounts of real-time data from sensors and historical records. Unlike traditional methods, AI and ML can detect complex patterns and trends that humans might miss, allowing for early detection of potential issues.
Restraints
A shortage of skilled professionals to manage and interpret APM data hampers effective implementation.
The use of cloud-based APM solutions raises concerns about data breaches and unauthorized access.
Poor data quality or insufficient data can impact the accuracy of predictive analytics in APM.
In the Asset Performance Management (APM) market, the accuracy of predictive analytics heavily relies on high-quality and sufficient data collected from various assets. Poor data quality such as missing, inconsistent, or erroneous data can lead to inaccurate predictions, making it difficult to identify potential equipment failures or performance issues. Insufficient data can also hinder the ability of machine learning models to learn effectively, resulting in less reliable forecasts.
Without accurate and comprehensive data, predictive models may fail to detect critical patterns or anomalies that indicate asset health, leading to unexpected breakdowns and costly downtimes. This diminishes the value of APM solutions, as the primary goal is to enhance asset reliability and optimize maintenance. Ensuring data accuracy and completeness is therefore essential for the successful implementation of APM. Organizations must invest in robust data management practices, including regular data validation, cleansing, and integration, to fully leverage predictive analytics for asset performance optimization.
In the Asset Performance Management (APM) market, the adoption of cloud-based solutions allows organizations to access real-time asset data, predictive analytics, and maintenance insights from anywhere, enhancing operational efficiency. However, this reliance on cloud platforms also introduces significant data security concerns. Sensitive data, including operational details, equipment performance metrics, and maintenance schedules, is stored and transmitted over the Internet, making it vulnerable to cyberattacks, data breaches, and unauthorized access.
By Component
In 2023, the Asset Reliability Management segment led the market, holding the largest share of over 33.0%. The increasing need for companies to extend the lifespan of machinery and equipment, along with the desire to reduce high operational and maintenance costs, is driving growth in the asset performance management segment.
However, the predictive asset management segment is projected to experience the highest growth rate, surpassing 14.02% during the forecast period. This growth is fueled by the use of advanced computing tools and techniques, such as risk-based inspection, neural networks, machine learning, safety integrity level analysis, statistical modeling, root cause failure analysis, and algorithms. These technologies enable organizations to gain valuable insights and implement preventive measures to avoid asset failures, enhancing overall performance and reliability.
By Deployment
In 2023, the Hosted systems segment dominated the market and represented over 35.0% market share. As a result of the rising demand for public cloud deployment, It offers a wide range of solutions and computing resources to address the evolving needs of organizations across various sizes and industries. Additionally, the introduction of new features and tools, along with the desire to gain a competitive edge, is driving organizations to adopt public cloud solutions, as cloud providers handle the maintenance and updates of the technical ecosystem in the public cloud model.
However, the need for customization due to the unique requirements of various machinery and equipment in asset-intensive industries, significant adjustments needed in APM systems, and concerns about data security with cloud-based solutions are key reasons why some organizations prefer on-premises APM systems.
By Organization Size
The large enterprises segment dominated the market in 2023 and represented over 54% of the market share. The rising trend of digitalization is expected to drive the demand for asset performance monitoring software, fueled by the increasing needs and substantial budgets of large enterprises.
Additionally, the small and medium-sized enterprise (SME) segment is anticipated to grow rapidly during the forecast period. The introduction of new and advanced cloud-based software is significantly boosting investment by SMEs, enabling them to optimize their asset maintenance and service costs.
By Vertical
In 2023, the energy and utilities sector led the market, capturing the largest share of over 20.0%. This growth is driven by the need to reassess strategies and use advanced technology in company processes. The increasing demand for reliable energy services has led managers to use asset performance management solutions to monitor and maintain assets more effectively. Additionally, the growing emphasis on predictive maintenance is also contributing to the segment's expansion.
The chemical and pharmaceutical industry will grow at the highest CAGR rate during the forecast period. contributes significantly to the global economy each year. Consequently, it is crucial to improve the reliability and maintenance of chemical equipment to ensure optimal production levels. Key challenges in the chemical sector include unexpected downtime of critical equipment, high maintenance and repair costs due to corrosive substances, and safety concerns related to handling hazardous chemicals.
The government and public sector segment is expected to grow quickly during the forecast period. As various firms broaden their operations to reach larger markets, there is an increasing demand for cloud-based solutions and services to help these organizations deliver more efficient solutions to their customers.
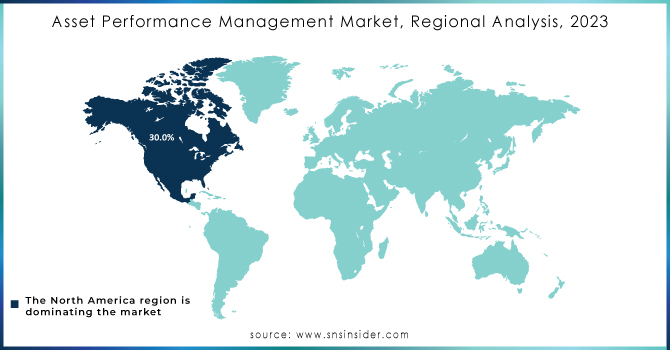
Regional Analysis
North America led the global market with a share of over 30.0% In 2023. This dominance is driven by the rising demand for high-speed data networks and the significant presence of software vendors in the region. Additionally, increased investments by organizations in IT infrastructure, particularly for developing cloud technologies, are further boosting regional market growth. The rising demand for efficient asset management, sustainable practices, and optimizing total cost of ownership (TCO) has driven the adoption of asset performance management solutions throughout the region. North America is leading in the implementation of these solutions, which are effective in offering early warnings through predictive analytics and diagnosing equipment problems days, weeks, or even months before failures occur.
Asia Pacific is projected to achieve the highest CAGR during the forecast period due to substantial investments by major companies and the adoption of new technologies across various industries. Many organizations are shifting their workloads to the cloud as they emphasize developing their digital transformation strategies through cloud technology.
Need any customization research on Asset Performance Management Market - Enquiry Now
The major key players are ABB Ltd, AVEVA Group plc, Aspen Technology, Inc., Bentley Systems Incorporated, AVEVA Group plc, Rockwell Automation, SAP SE, SAS Institute, Inc., Siemens Energy, DNV GLAS, GE Digital.
Recent development
|
Report Attributes |
Details |
|
Market Size in 2023 |
USD 3.0 Bn |
|
Market Size by 2032 |
USD 8.4 Bn |
|
CAGR |
CAGR of 12.2% From 2024 to 2032 |
|
Base Year |
2023 |
|
Forecast Period |
2024-2032 |
|
Historical Data |
2020-2022 |
|
Report Scope & Coverage |
Market Size, Segments Analysis, Competitive Landscape, Regional Analysis, DROC & SWOT Analysis, Forecast Outlook |
|
Key Segments |
• By Component (Solutions,Services) |
|
Regional Analysis/Coverage |
North America (US, Canada, Mexico), Europe (Eastern Europe [Poland, Romania, Hungary, Turkey, Rest of Eastern Europe] Western Europe] Germany, France, UK, Italy, Spain, Netherlands, Switzerland, Austria, Rest of Western Europe]), Asia Pacific (China, India, Japan, South Korea, Vietnam, Singapore, Australia, Rest of Asia Pacific), Middle East & Africa (Middle East [UAE, Egypt, Saudi Arabia, Qatar, Rest of Middle East], Africa [Nigeria, South Africa, Rest of Africa], Latin America (Brazil, Argentina, Colombia Rest of Latin America) |
|
Company Profiles |
ABB Ltd, AVEVA Group plc, Aspen Technology, Inc., Bentley Systems Incorporated, AVEVA Group plc, Rockwell Automation, SAP SE, SAS Institute, Inc., Siemens Energy, DNV GLAS, GE Digital. |
|
Key Drivers |
• APM helps reduce energy consumption and emissions, aligning with global sustainability goals.’ |
|
Market Restraints |
• The use of cloud-based APM solutions raises concerns about data breaches and unauthorized access. |
North America Dominated the Asset Performance Management market with a share of over 30.0% In 2023.
Ans. The CAGR of the Asset Performance Management Market is 12.2%.
Ans: There are three options available to purchase this report,
Features: A non-printable PDF to be accessed by just one user at a time
Features:
C: Excel Datasheet: USD 2,325
Ans. The forecast period of the Asset Performance Management Market is 2024-2032.
Ans: Four segments are covered in the Asset Performance Management Market Report, By Component, By Deployment mode, By Organization Size, By Vertical.
1. Introduction
1.1 Market Definition
1.2 Scope (Inclusion and Exclusions)
1.3 Research Assumptions
2. Executive Summary
2.1 Market Overview
2.2 Regional Synopsis
2.3 Competitive Summary
3. Research Methodology
3.1 Top-Down Approach
3.2 Bottom-up Approach
3.3. Data Validation
3.4 Primary Interviews
4. Market Dynamics Impact Analysis
4.1 Market Driving Factors Analysis
4.1.1 Drivers
4.1.2 Restraints
4.1.3 Opportunities
4.1.4 Challenges
4.2 PESTLE Analysis
4.3 Porter’s Five Forces Model
5. Statistical Insights and Trends Reporting
5.1 Adoption Rates, 2023
5.2 User Demographics, By User Type and Roles, 2023
5.3 Feature Analysis, by Feature Type
5.4 Cost Analysis, by Software
5.5 Integration Capabilities
5.6 Regulatory Compliance, by Region
6. Competitive Landscape
6.1 List of Major Companies, By Region
6.2 Market Share Analysis, By Region
6.3 Product Benchmarking
6.3.1 Product specifications and features
6.3.2 Pricing
6.4 Strategic Initiatives
6.4.1 Marketing and promotional activities
6.4.2 Distribution and Supply Chain Strategies
6.4.3 Expansion plans and new product launches
6.4.4 Strategic partnerships and collaborations
6.5 Technological Advancements
6.6 Market Positioning and Branding
7. Asset Performance Management Market Segmentation, by Component
7.1 Chapter Overview
7.2 Solutions
7.2.1 Solutions Market Trends Analysis (2020-2032)
7.2.2 Solutions Market Size Estimates and Forecasts to 2032 (USD Billion)
7.2.3 Asset Strategy Management
7.2.3.1 Asset Strategy Management Market Trends Analysis (2020-2032)
7.2.3.2 Asset Strategy Management Market Size Estimates and Forecasts to 2032 (USD Billion)
7.2.4 Asset Reliability Management
7.2.4.1 Asset Reliability Management Market Trends Analysis (2020-2032)
7.2.4.2 Asset Reliability Management Market Size Estimates and Forecasts to 2032 (USD Billion)
7.2.5 Predictive Asset Management
7.2.5.1 Predictive Asset Management Market Trends Analysis (2020-2032)
7.2.5.2 Predictive Asset Management Market Size Estimates and Forecasts to 2032 (USD Billion)
7.2.6 Other Solutions
7.2.6.1 Other Solutions Market Trends Analysis (2020-2032)
7.2.6.2 Other Solutions Market Size Estimates and Forecasts to 2032 (USD Billion)
7.3Services
7.3.1Services Market Trends Analysis (2020-2032)
7.3.2Services Market Size Estimates and Forecasts to 2032 (USD Billion)
7.3.3 Professional Services
7.3.3.1Professional Services Market Trends Analysis (2020-2032)
7.3.3.2Professional Services Market Size Estimates and Forecasts to 2032 (USD Billion)
7.3.4 Managed Services
7.3.4.1Managed Services Market Trends Analysis (2020-2032)
7.3.4.2Managed Services Market Size Estimates and Forecasts to 2032 (USD Billion)
8. Asset Performance Management Market Segmentation, by Vertical
8.1 Chapter Overview
8.2 Consumer Goods, Food & Beverages
8.2.1 Consumer Goods, Food & Beverages Market Trends Analysis (2020-2032)
8.2.2 Consumer Goods, Food & Beverages Market Size Estimates and Forecasts to 2032 (USD Billion)
8.3 Manufacturing
8.3.1 Manufacturing Market Trends Analysis (2020-2032)
8.3.2 Manufacturing Market Size Estimates and Forecasts to 2032 (USD Billion)
8.4 Energy & Utilities
8.4.1 Energy & Utilities Market Trends Analysis (2020-2032)
8.4.2 Energy & Utilities Market Size Estimates and Forecasts to 2032 (USD Billion)
8.5 Healthcare & Pharmaceuticals
8.5.1 Healthcare & Pharmaceuticals Market Trends Analysis (2020-2032)
8.5.2 Healthcare & Pharmaceuticals Market Size Estimates and Forecasts to 2032 (USD Billion)
8.6 Chemicals
8.6.1 Chemicals Market Trends Analysis (2020-2032)
8.6.2 Chemicals Market Size Estimates and Forecasts to 2032 (USD Billion)
8.7 Telecommunications
8.7.1 Telecommunications Market Trends Analysis (2020-2032)
8.7.2 Telecommunications Market Size Estimates and Forecasts to 2032 (USD Billion)
8.8 Government & Defense
8.8.1 Government & Defense Market Trends Analysis (2020-2032)
8.8.2 Government & Defense Market Size Estimates and Forecasts to 2032 (USD Billion)
8.7 Other Verticals
8.7.1 Other Verticals Market Trends Analysis (2020-2032)
8.7.2 Other Verticals Market Size Estimates and Forecasts to 2032 (USD Billion)
9. Asset Performance Management Market Segmentation, by Deployment
9.1 Chapter Overview
9.2 On-premises
9.2.1 On-premises Market Trends Analysis (2020-2032)
9.2.2 On-premises Market Size Estimates and Forecasts to 2032 (USD Billion)
9.3 Cloud
9.3.1 Cloud Market Trends Analysis (2020-2032)
9.3.2 Cloud Market Size Estimates and Forecasts to 2032 (USD Billion)
10. Asset Performance Management Market Segmentation, by Organization Size
10.1 Chapter Overview
10.2 Large Enterprises
10.2.1 Large Enterprises Market Trends Analysis (2020-2032)
10.2.2 Large Enterprises Market Size Estimates and Forecasts to 2032 (USD Billion)
10.3 Small & Medium-Sized Enterprises
10.3.1 Small & Medium-Sized Enterprises Market Trends Analysis (2020-2032)
10.3.2 Small & Medium Sized Enterprises Market Size Estimates and Forecasts to 2032 (USD Billion)
11. Regional Analysis
11.1 Chapter Overview
11.2 North America
11.2.1 Trends Analysis
11.2.2 North America Asset Performance Management Market Estimates and Forecasts, by Country (2020-2032) (USD Billion)
11.2.3 North America Asset Performance Management Market Estimates and Forecasts, by Component (2020-2032) (USD Billion)
11.2.4 North America Asset Performance Management Market Estimates and Forecasts, by Vertical (2020-2032) (USD Billion)
11.2.5 North America Asset Performance Management Market Estimates and Forecasts, by Deployment (2020-2032) (USD Billion)
11.2.6 North America Asset Performance Management Market Estimates and Forecasts, by Organization Size (2020-2032) (USD Billion)
11.2.7 USA
11.2.7.1 USA Asset Performance Management Market Estimates and Forecasts, by Component (2020-2032) (USD Billion)
11.2.7.2 USA Asset Performance Management Market Estimates and Forecasts, by Vertical (2020-2032) (USD Billion)
11.2.7.3 USA Asset Performance Management Market Estimates and Forecasts, by Deployment (2020-2032) (USD Billion)
11.2.7.4 USA Asset Performance Management Market Estimates and Forecasts, by Organization Size (2020-2032) (USD Billion)
11.2.8 Canada
11.2.8.1 Canada Asset Performance Management Market Estimates and Forecasts, by Component (2020-2032) (USD Billion)
11.2.8.2 Canada Asset Performance Management Market Estimates and Forecasts, by Vertical (2020-2032) (USD Billion)
11.2.8.3 Canada Asset Performance Management Market Estimates and Forecasts, by Deployment (2020-2032) (USD Billion)
11.2.8.4 Canada Asset Performance Management Market Estimates and Forecasts, by Organization Size (2020-2032) (USD Billion)
11.2.9 Mexico
11.2.9.1 Mexico Asset Performance Management Market Estimates and Forecasts, by Component (2020-2032) (USD Billion)
11.2.9.2 Mexico Asset Performance Management Market Estimates and Forecasts, by Vertical (2020-2032) (USD Billion)
11.2.9.3 Mexico Asset Performance Management Market Estimates and Forecasts, by Deployment (2020-2032) (USD Billion)
11.2.9.4 Mexico Asset Performance Management Market Estimates and Forecasts, by Organization Size (2020-2032) (USD Billion)
11.3 Europe
11.3.1 Eastern Europe
11.3.1.1 Trends Analysis
11.3.1.2 Eastern Europe Asset Performance Management Market Estimates and Forecasts, by Country (2020-2032) (USD Billion)
11.3.1.3 Eastern Europe Asset Performance Management Market Estimates and Forecasts, by Component (2020-2032) (USD Billion)
11.3.1.4 Eastern Europe Asset Performance Management Market Estimates and Forecasts, by Vertical (2020-2032) (USD Billion)
11.3.1.5 Eastern Europe Asset Performance Management Market Estimates and Forecasts, by Deployment (2020-2032) (USD Billion)
11.3.1.6 Eastern Europe Asset Performance Management Market Estimates and Forecasts, by Organization Size (2020-2032) (USD Billion)
11.3.1.7 Poland
11.3.1.7.1 Poland Asset Performance Management Market Estimates and Forecasts, by Component (2020-2032) (USD Billion)
11.3.1.7.2 Poland Asset Performance Management Market Estimates and Forecasts, by Vertical (2020-2032) (USD Billion)
11.3.1.7.3 Poland Asset Performance Management Market Estimates and Forecasts, by Deployment (2020-2032) (USD Billion)
11.3.1.7.4 Poland Asset Performance Management Market Estimates and Forecasts, by Organization Size (2020-2032) (USD Billion)
11.3.1.8 Romania
11.3.1.8.1 Romania Asset Performance Management Market Estimates and Forecasts, by Component (2020-2032) (USD Billion)
11.3.1.8.2 Romania Asset Performance Management Market Estimates and Forecasts, by Vertical (2020-2032) (USD Billion)
11.3.1.8.3 Romania Asset Performance Management Market Estimates and Forecasts, by Deployment (2020-2032) (USD Billion)
11.3.1.8.4 Romania Asset Performance Management Market Estimates and Forecasts, by Organization Size (2020-2032) (USD Billion)
11.3.1.9 Hungary
11.3.1.9.1 Hungary Asset Performance Management Market Estimates and Forecasts, by Component (2020-2032) (USD Billion)
11.3.1.9.2 Hungary Asset Performance Management Market Estimates and Forecasts, by Vertical (2020-2032) (USD Billion)
11.3.1.9.3 Hungary Asset Performance Management Market Estimates and Forecasts, by Deployment (2020-2032) (USD Billion)
11.3.1.9.4 Hungary Asset Performance Management Market Estimates and Forecasts, by Organization Size (2020-2032) (USD Billion)
11.3.1.10 Turkey
11.3.1.10.1 Turkey Asset Performance Management Market Estimates and Forecasts, by Component (2020-2032) (USD Billion)
11.3.1.10.2 Turkey Asset Performance Management Market Estimates and Forecasts, by Vertical (2020-2032) (USD Billion)
11.3.1.10.3 Turkey Asset Performance Management Market Estimates and Forecasts, by Deployment (2020-2032) (USD Billion)
11.3.1.10.4 Turkey Asset Performance Management Market Estimates and Forecasts, by Organization Size (2020-2032) (USD Billion)
11.3.1.11 Rest of Eastern Europe
11.3.1.11.1 Rest of Eastern Europe Asset Performance Management Market Estimates and Forecasts, by Component (2020-2032) (USD Billion)
11.3.1.11.2 Rest of Eastern Europe Asset Performance Management Market Estimates and Forecasts, by Vertical (2020-2032) (USD Billion)
11.3.1.11.3 Rest of Eastern Europe Asset Performance Management Market Estimates and Forecasts, by Deployment (2020-2032) (USD Billion)
11.3.1.11.4 Rest of Eastern Europe Asset Performance Management Market Estimates and Forecasts, by Organization Size (2020-2032) (USD Billion)
11.3.2 Western Europe
11.3.2.1 Trends Analysis
11.3.2.2 Western Europe Asset Performance Management Market Estimates and Forecasts, by Country (2020-2032) (USD Billion)
11.3.2.3 Western Europe Asset Performance Management Market Estimates and Forecasts, by Component (2020-2032) (USD Billion)
11.3.2.4 Western Europe Asset Performance Management Market Estimates and Forecasts, by Vertical (2020-2032) (USD Billion)
11.3.2.5 Western Europe Asset Performance Management Market Estimates and Forecasts, by Deployment (2020-2032) (USD Billion)
11.3.2.6 Western Europe Asset Performance Management Market Estimates and Forecasts, by Organization Size (2020-2032) (USD Billion)
11.3.2.7 Germany
11.3.2.7.1 Germany Asset Performance Management Market Estimates and Forecasts, by Component (2020-2032) (USD Billion)
11.3.2.7.2 Germany Asset Performance Management Market Estimates and Forecasts, by Vertical (2020-2032) (USD Billion)
11.3.2.7.3 Germany Asset Performance Management Market Estimates and Forecasts, by Deployment (2020-2032) (USD Billion)
11.3.2.7.4 Germany Asset Performance Management Market Estimates and Forecasts, by Organization Size (2020-2032) (USD Billion)
11.3.2.8 France
11.3.2.8.1 France Asset Performance Management Market Estimates and Forecasts, by Component (2020-2032) (USD Billion)
11.3.2.8.2 France Asset Performance Management Market Estimates and Forecasts, by Vertical (2020-2032) (USD Billion)
11.3.2.8.3 France Asset Performance Management Market Estimates and Forecasts, by Deployment (2020-2032) (USD Billion)
11.3.2.8.4 France Asset Performance Management Market Estimates and Forecasts, by Organization Size (2020-2032) (USD Billion)
11.3.2.9 UK
11.3.2.9.1 UK Asset Performance Management Market Estimates and Forecasts, by Component (2020-2032) (USD Billion)
11.3.2.9.2 UK Asset Performance Management Market Estimates and Forecasts, by Vertical (2020-2032) (USD Billion)
11.3.2.9.3 UK Asset Performance Management Market Estimates and Forecasts, by Deployment (2020-2032) (USD Billion)
11.3.2.9.4 UK Asset Performance Management Market Estimates and Forecasts, by Organization Size (2020-2032) (USD Billion)
11.3.2.10 Italy
11.3.2.10.1 Italy Asset Performance Management Market Estimates and Forecasts, by Component (2020-2032) (USD Billion)
11.3.2.10.2 Italy Asset Performance Management Market Estimates and Forecasts, by Vertical (2020-2032) (USD Billion)
11.3.2.10.3 Italy Asset Performance Management Market Estimates and Forecasts, by Deployment (2020-2032) (USD Billion)
11.3.2.10.4 Italy Asset Performance Management Market Estimates and Forecasts, by Organization Size (2020-2032) (USD Billion)
11.3.2.11 Spain
11.3.2.11.1 Spain Asset Performance Management Market Estimates and Forecasts, by Component (2020-2032) (USD Billion)
11.3.2.11.2 Spain Asset Performance Management Market Estimates and Forecasts, by Vertical (2020-2032) (USD Billion)
11.3.2.11.3 Spain Asset Performance Management Market Estimates and Forecasts, by Deployment (2020-2032) (USD Billion)
11.3.2.11.4 Spain Asset Performance Management Market Estimates and Forecasts, by Organization Size (2020-2032) (USD Billion)
11.3.2.12 Netherlands
11.3.2.12.1 Netherlands Asset Performance Management Market Estimates and Forecasts, by Component (2020-2032) (USD Billion)
11.3.2.12.2 Netherlands Asset Performance Management Market Estimates and Forecasts, by Vertical (2020-2032) (USD Billion)
11.3.2.12.3 Netherlands Asset Performance Management Market Estimates and Forecasts, by Deployment (2020-2032) (USD Billion)
11.3.2.12.4 Netherlands Asset Performance Management Market Estimates and Forecasts, by Organization Size (2020-2032) (USD Billion)
11.3.2.13 Switzerland
11.3.2.13.1 Switzerland Asset Performance Management Market Estimates and Forecasts, by Component (2020-2032) (USD Billion)
11.3.2.13.2 Switzerland Asset Performance Management Market Estimates and Forecasts, by Vertical (2020-2032) (USD Billion)
11.3.2.13.3 Switzerland Asset Performance Management Market Estimates and Forecasts, by Deployment (2020-2032) (USD Billion)
11.3.2.13.4 Switzerland Asset Performance Management Market Estimates and Forecasts, by Organization Size (2020-2032) (USD Billion)
11.3.2.14 Austria
11.3.2.14.1 Austria Asset Performance Management Market Estimates and Forecasts, by Component (2020-2032) (USD Billion)
11.3.2.14.2 Austria Asset Performance Management Market Estimates and Forecasts, by Vertical (2020-2032) (USD Billion)
11.3.2.14.3 Austria Asset Performance Management Market Estimates and Forecasts, by Deployment (2020-2032) (USD Billion)
11.3.2.14.4 Austria Asset Performance Management Market Estimates and Forecasts, by Organization Size (2020-2032) (USD Billion)
11.3.2.15 Rest of Western Europe
11.3.2.15.1 Rest of Western Europe Asset Performance Management Market Estimates and Forecasts, by Component (2020-2032) (USD Billion)
11.3.2.15.2 Rest of Western Europe Asset Performance Management Market Estimates and Forecasts, by Vertical (2020-2032) (USD Billion)
11.3.2.15.3 Rest of Western Europe Asset Performance Management Market Estimates and Forecasts, by Deployment (2020-2032) (USD Billion)
11.3.2.15.4 Rest of Western Europe Asset Performance Management Market Estimates and Forecasts, by Organization Size (2020-2032) (USD Billion)
11.4 Asia Pacific
11.4.1 Trends Analysis
11.4.2 Asia Pacific Asset Performance Management Market Estimates and Forecasts, by Country (2020-2032) (USD Billion)
11.4.3 Asia Pacific Asset Performance Management Market Estimates and Forecasts, by Component (2020-2032) (USD Billion)
11.4.4 Asia Pacific Asset Performance Management Market Estimates and Forecasts, by Vertical (2020-2032) (USD Billion)
11.4.5 Asia Pacific Asset Performance Management Market Estimates and Forecasts, by Deployment (2020-2032) (USD Billion)
11.4.6 Asia Pacific Asset Performance Management Market Estimates and Forecasts, by Organization Size (2020-2032) (USD Billion)
11.4.7 China
11.4.7.1 China Asset Performance Management Market Estimates and Forecasts, by Component (2020-2032) (USD Billion)
11.4.7.2 China Asset Performance Management Market Estimates and Forecasts, by Vertical (2020-2032) (USD Billion)
11.4.7.3 China Asset Performance Management Market Estimates and Forecasts, by Deployment (2020-2032) (USD Billion)
11.4.7.4 China Asset Performance Management Market Estimates and Forecasts, by Organization Size (2020-2032) (USD Billion)
11.4.8 India
11.4.8.1 India Asset Performance Management Market Estimates and Forecasts, by Component (2020-2032) (USD Billion)
11.4.8.2 India Asset Performance Management Market Estimates and Forecasts, by Vertical (2020-2032) (USD Billion)
11.4.8.3 India Asset Performance Management Market Estimates and Forecasts, by Deployment (2020-2032) (USD Billion)
11.4.8.4 India Asset Performance Management Market Estimates and Forecasts, by Organization Size (2020-2032) (USD Billion)
11.4.9 Japan
11.4.9.1 Japan Asset Performance Management Market Estimates and Forecasts, by Component (2020-2032) (USD Billion)
11.4.9.2 Japan Asset Performance Management Market Estimates and Forecasts, by Vertical (2020-2032) (USD Billion)
11.4.9.3 Japan Asset Performance Management Market Estimates and Forecasts, by Deployment (2020-2032) (USD Billion)
11.4.9.4 Japan Asset Performance Management Market Estimates and Forecasts, by Organization Size (2020-2032) (USD Billion)
11.4.10 South Korea
11.4.10.1 South Korea Asset Performance Management Market Estimates and Forecasts, by Component (2020-2032) (USD Billion)
11.4.10.2 South Korea Asset Performance Management Market Estimates and Forecasts, by Vertical (2020-2032) (USD Billion)
11.4.10.3 South Korea Asset Performance Management Market Estimates and Forecasts, by Deployment (2020-2032) (USD Billion)
11.4.10.4 South Korea Asset Performance Management Market Estimates and Forecasts, by Organization Size (2020-2032) (USD Billion)
11.4.11 Vietnam
11.4.11.1 Vietnam Asset Performance Management Market Estimates and Forecasts, by Component (2020-2032) (USD Billion)
11.4.11.2 Vietnam Asset Performance Management Market Estimates and Forecasts, by Vertical (2020-2032) (USD Billion)
11.4.11.3 Vietnam Asset Performance Management Market Estimates and Forecasts, by Deployment (2020-2032) (USD Billion)
11.4.11.4 Vietnam Asset Performance Management Market Estimates and Forecasts, by Organization Size (2020-2032) (USD Billion)
11.4.12 Singapore
11.4.12.1 Singapore Asset Performance Management Market Estimates and Forecasts, by Component (2020-2032) (USD Billion)
11.4.12.2 Singapore Asset Performance Management Market Estimates and Forecasts, by Vertical (2020-2032) (USD Billion)
11.4.12.3 Singapore Asset Performance Management Market Estimates and Forecasts, by Deployment (2020-2032) (USD Billion)
11.4.12.4 Singapore Asset Performance Management Market Estimates and Forecasts, by Organization Size (2020-2032) (USD Billion)
11.4.13 Australia
11.4.13.1 Australia Asset Performance Management Market Estimates and Forecasts, by Component (2020-2032) (USD Billion)
11.4.13.2 Australia Asset Performance Management Market Estimates and Forecasts, by Vertical (2020-2032) (USD Billion)
11.4.13.3 Australia Asset Performance Management Market Estimates and Forecasts, by Deployment (2020-2032) (USD Billion)
11.4.13.4 Australia Asset Performance Management Market Estimates and Forecasts, by Organization Size (2020-2032) (USD Billion)
11.4.14 Rest of Asia Pacific
11.4.14.1 Rest of Asia Pacific Asset Performance Management Market Estimates and Forecasts, by Component (2020-2032) (USD Billion)
11.4.14.2 Rest of Asia Pacific Asset Performance Management Market Estimates and Forecasts, by Vertical (2020-2032) (USD Billion)
11.4.14.3 Rest of Asia Pacific Asset Performance Management Market Estimates and Forecasts, by Deployment (2020-2032) (USD Billion)
11.4.14.4 Rest of Asia Pacific Asset Performance Management Market Estimates and Forecasts, by Organization Size (2020-2032) (USD Billion)
11.5 Middle East and Africa
11.5.1 Middle East
11.5.1.1 Trends Analysis
11.5.1.2 Middle East Asset Performance Management Market Estimates and Forecasts, by Country (2020-2032) (USD Billion)
11.5.1.3 Middle East Asset Performance Management Market Estimates and Forecasts, by Component (2020-2032) (USD Billion)
11.5.1.4 Middle East Asset Performance Management Market Estimates and Forecasts, by Vertical (2020-2032) (USD Billion)
11.5.1.5 Middle East Asset Performance Management Market Estimates and Forecasts, by Deployment (2020-2032) (USD Billion)
11.5.1.6 Middle East Asset Performance Management Market Estimates and Forecasts, by Organization Size (2020-2032) (USD Billion)
11.5.1.7 UAE
11.5.1.7.1 UAE Asset Performance Management Market Estimates and Forecasts, by Component (2020-2032) (USD Billion)
11.5.1.7.2 UAE Asset Performance Management Market Estimates and Forecasts, by Vertical (2020-2032) (USD Billion)
11.5.1.7.3 UAE Asset Performance Management Market Estimates and Forecasts, by Deployment (2020-2032) (USD Billion)
11.5.1.7.4 UAE Asset Performance Management Market Estimates and Forecasts, by Organization Size (2020-2032) (USD Billion)
11.5.1.8 Egypt
11.5.1.8.1 Egypt Asset Performance Management Market Estimates and Forecasts, by Component (2020-2032) (USD Billion)
11.5.1.8.2 Egypt Asset Performance Management Market Estimates and Forecasts, by Vertical (2020-2032) (USD Billion)
11.5.1.8.3 Egypt Asset Performance Management Market Estimates and Forecasts, by Deployment (2020-2032) (USD Billion)
11.5.1.8.4 Egypt Asset Performance Management Market Estimates and Forecasts, by Organization Size (2020-2032) (USD Billion)
11.5.1.9 Saudi Arabia
11.5.1.9.1 Saudi Arabia Asset Performance Management Market Estimates and Forecasts, by Component (2020-2032) (USD Billion)
11.5.1.9.2 Saudi Arabia Asset Performance Management Market Estimates and Forecasts, by Vertical (2020-2032) (USD Billion)
11.5.1.9.3 Saudi Arabia Asset Performance Management Market Estimates and Forecasts, by Deployment (2020-2032) (USD Billion)
11.5.1.9.4 Saudi Arabia Asset Performance Management Market Estimates and Forecasts, by Organization Size (2020-2032) (USD Billion)
11.5.1.10 Qatar
11.5.1.10.1 Qatar Asset Performance Management Market Estimates and Forecasts, by Component (2020-2032) (USD Billion)
11.5.1.10.2 Qatar Asset Performance Management Market Estimates and Forecasts, by Vertical (2020-2032) (USD Billion)
11.5.1.10.3 Qatar Asset Performance Management Market Estimates and Forecasts, by Deployment (2020-2032) (USD Billion)
11.5.1.10.4 Qatar Asset Performance Management Market Estimates and Forecasts, by Organization Size (2020-2032) (USD Billion)
11.5.1.11 Rest of Middle East
11.5.1.11.1 Rest of Middle East Asset Performance Management Market Estimates and Forecasts, by Component (2020-2032) (USD Billion)
11.5.1.11.2 Rest of Middle East Asset Performance Management Market Estimates and Forecasts, by Vertical (2020-2032) (USD Billion)
11.5.1.11.3 Rest of Middle East Asset Performance Management Market Estimates and Forecasts, by Deployment (2020-2032) (USD Billion)
11.5.1.11.4 Rest of Middle East Asset Performance Management Market Estimates and Forecasts, by Organization Size (2020-2032) (USD Billion)
11.5.2 Africa
11.5.2.1 Trends Analysis
11.5.2.2 Africa Asset Performance Management Market Estimates and Forecasts, by Country (2020-2032) (USD Billion)
11.5.2.3 Africa Asset Performance Management Market Estimates and Forecasts, by Component (2020-2032) (USD Billion)
11.5.2.4 Africa Asset Performance Management Market Estimates and Forecasts, by Vertical (2020-2032) (USD Billion)
11.5.2.5 Africa Asset Performance Management Market Estimates and Forecasts, by Deployment (2020-2032) (USD Billion)
11.5.2.6 Africa Asset Performance Management Market Estimates and Forecasts, by Organization Size (2020-2032) (USD Billion)
11.5.2.7 South Africa
11.5.2.7.1 South Africa Asset Performance Management Market Estimates and Forecasts, by Component (2020-2032) (USD Billion)
11.5.2.7.2 South Africa Asset Performance Management Market Estimates and Forecasts, by Vertical (2020-2032) (USD Billion)
11.5.2.7.3 South Africa Asset Performance Management Market Estimates and Forecasts, by Deployment (2020-2032) (USD Billion)
11.5.2.7.4 South Africa Asset Performance Management Market Estimates and Forecasts, by Organization Size (2020-2032) (USD Billion)
11.5.2.8 Nigeria
11.5.2.8.1 Nigeria Asset Performance Management Market Estimates and Forecasts, by Component (2020-2032) (USD Billion)
11.5.2.8.2 Nigeria Asset Performance Management Market Estimates and Forecasts, by Vertical (2020-2032) (USD Billion)
11.5.2.8.3 Nigeria Asset Performance Management Market Estimates and Forecasts, by Deployment (2020-2032) (USD Billion)
11.5.2.8.4 Nigeria Asset Performance Management Market Estimates and Forecasts, by Organization Size (2020-2032) (USD Billion)
11.5.2.9 Rest of Africa
11.5.2.9.1 Rest of Africa Asset Performance Management Market Estimates and Forecasts, by Component (2020-2032) (USD Billion)
11.5.2.9.2 Rest of Africa Asset Performance Management Market Estimates and Forecasts, by Vertical (2020-2032) (USD Billion)
11.5.2.9.3 Rest of Africa Asset Performance Management Market Estimates and Forecasts, by Deployment (2020-2032) (USD Billion)
11.5.2.9.4 Rest of Africa Asset Performance Management Market Estimates and Forecasts, by Organization Size (2020-2032) (USD Billion)
11.6 Latin America
11.6.1 Trends Analysis
11.6.2 Latin America Asset Performance Management Market Estimates and Forecasts, by Country (2020-2032) (USD Billion)
11.6.3 Latin America Asset Performance Management Market Estimates and Forecasts, by Component (2020-2032) (USD Billion)
11.6.4 Latin America Asset Performance Management Market Estimates and Forecasts, by Vertical (2020-2032) (USD Billion)
11.6.5 Latin America Asset Performance Management Market Estimates and Forecasts, by Deployment (2020-2032) (USD Billion)
11.6.6 Latin America Asset Performance Management Market Estimates and Forecasts, by Organization Size (2020-2032) (USD Billion)
11.6.7 Brazil
11.6.7.1 Brazil Asset Performance Management Market Estimates and Forecasts, by Component (2020-2032) (USD Billion)
11.6.7.2 Brazil Asset Performance Management Market Estimates and Forecasts, by Vertical (2020-2032) (USD Billion)
11.6.7.3 Brazil Asset Performance Management Market Estimates and Forecasts, by Deployment (2020-2032) (USD Billion)
11.6.7.4 Brazil Asset Performance Management Market Estimates and Forecasts, by Organization Size (2020-2032) (USD Billion)
11.6.8 Argentina
11.6.8.1 Argentina Asset Performance Management Market Estimates and Forecasts, by Component (2020-2032) (USD Billion)
11.6.8.2 Argentina Asset Performance Management Market Estimates and Forecasts, by Vertical (2020-2032) (USD Billion)
11.6.8.3 Argentina Asset Performance Management Market Estimates and Forecasts, by Deployment (2020-2032) (USD Billion)
11.6.8.4 Argentina Asset Performance Management Market Estimates and Forecasts, by Organization Size (2020-2032) (USD Billion)
11.6.9 Colombia
11.6.9.1 Colombia Asset Performance Management Market Estimates and Forecasts, by Component (2020-2032) (USD Billion)
11.6.9.2 Colombia Asset Performance Management Market Estimates and Forecasts, by Vertical (2020-2032) (USD Billion)
11.6.9.3 Colombia Asset Performance Management Market Estimates and Forecasts, by Deployment (2020-2032) (USD Billion)
11.6.9.4 Colombia Asset Performance Management Market Estimates and Forecasts, by Organization Size (2020-2032) (USD Billion)
11.6.10 Rest of Latin America
11.6.10.1 Rest of Latin America Asset Performance Management Market Estimates and Forecasts, by Component (2020-2032) (USD Billion)
11.6.10.2 Rest of Latin America Asset Performance Management Market Estimates and Forecasts, by Vertical (2020-2032) (USD Billion)
11.6.10.3 Rest of Latin America Asset Performance Management Market Estimates and Forecasts, by Deployment (2020-2032) (USD Billion)
11.6.10.4 Rest of Latin America Asset Performance Management Market Estimates and Forecasts, by Organization Size (2020-2032) (USD Billion)
12. Company Profiles
12.1 ABB Ltd
12.1.1 Company Overview
12.1.2 Financial
12.1.3 Products/ Verticals Offered
12.1.4 SWOT Analysis
12.2 AVEVA Group plc
12.2.1 Company Overview
12.2.2 Financial
12.2.3 Products/ Verticals Offered
12.2.4 SWOT Analysis
12.3 Aspen Technology
12.3.1 Company Overview
12.3.2 Financial
12.3.3 Products/ Verticals Offered
12.3.4 SWOT Analysis
12.4 Bentley Systems Incorporated
12.4.1 Company Overview
12.4.2 Financial
12.4.3 Products/ Verticals Offered
12.4.4 SWOT Analysis
12.5 AVEVA Group plc
12.5.1 Company Overview
12.5.2 Financial
12.5.3 Products/ Verticals Offered
12.5.4 SWOT Analysis
12.6 Rockwell Automation
12.6.1 Company Overview
12.6.2 Financial
12.6.3 Products/ Verticals Offered
12.6.4 SWOT Analysis
12.7 SAP SE
12.7.1 Company Overview
12.7.2 Financial
12.7.3 Products/ Verticals Offered
12.7.4 SWOT Analysis
12.8 SAS Institute
12.8.1 Company Overview
12.8.2 Financial
12.8.3 Products/ Verticals Offered
12.8.4 SWOT Analysis
12.9 Siemens Energy
12.9.1 Company Overview
12.9.2 Financial
12.9.3 Products/ Verticals Offered
12.9.4 SWOT Analysis
12.10 DNV GLAS
12.10.1 Company Overview
12.10.2 Financial
12.10.3 Products/ Verticals Offered
12.10.4 SWOT Analysis
13. Use Cases and Best Practices
14. Conclusion
An accurate research report requires proper strategizing as well as implementation. There are multiple factors involved in the completion of good and accurate research report and selecting the best methodology to compete the research is the toughest part. Since the research reports we provide play a crucial role in any company’s decision-making process, therefore we at SNS Insider always believe that we should choose the best method which gives us results closer to reality. This allows us to reach at a stage wherein we can provide our clients best and accurate investment to output ratio.
Each report that we prepare takes a timeframe of 350-400 business hours for production. Starting from the selection of titles through a couple of in-depth brain storming session to the final QC process before uploading our titles on our website we dedicate around 350 working hours. The titles are selected based on their current market cap and the foreseen CAGR and growth.
The 5 steps process:
Step 1: Secondary Research:
Secondary Research or Desk Research is as the name suggests is a research process wherein, we collect data through the readily available information. In this process we use various paid and unpaid databases which our team has access to and gather data through the same. This includes examining of listed companies’ annual reports, Journals, SEC filling etc. Apart from this our team has access to various associations across the globe across different industries. Lastly, we have exchange relationships with various university as well as individual libraries.

Step 2: Primary Research
When we talk about primary research, it is a type of study in which the researchers collect relevant data samples directly, rather than relying on previously collected data. This type of research is focused on gaining content specific facts that can be sued to solve specific problems. Since the collected data is fresh and first hand therefore it makes the study more accurate and genuine.
We at SNS Insider have divided Primary Research into 2 parts.
Part 1 wherein we interview the KOLs of major players as well as the upcoming ones across various geographic regions. This allows us to have their view over the market scenario and acts as an important tool to come closer to the accurate market numbers. As many as 45 paid and unpaid primary interviews are taken from both the demand and supply side of the industry to make sure we land at an accurate judgement and analysis of the market.
This step involves the triangulation of data wherein our team analyses the interview transcripts, online survey responses and observation of on filed participants. The below mentioned chart should give a better understanding of the part 1 of the primary interview.

Part 2: In this part of primary research the data collected via secondary research and the part 1 of the primary research is validated with the interviews from individual consultants and subject matter experts.
Consultants are those set of people who have at least 12 years of experience and expertise within the industry whereas Subject Matter Experts are those with at least 15 years of experience behind their back within the same space. The data with the help of two main processes i.e., FGDs (Focused Group Discussions) and IDs (Individual Discussions). This gives us a 3rd party nonbiased primary view of the market scenario making it a more dependable one while collation of the data pointers.
Step 3: Data Bank Validation
Once all the information is collected via primary and secondary sources, we run that information for data validation. At our intelligence centre our research heads track a lot of information related to the market which includes the quarterly reports, the daily stock prices, and other relevant information. Our data bank server gets updated every fortnight and that is how the information which we collected using our primary and secondary information is revalidated in real time.

Step 4: QA/QC Process
After all the data collection and validation our team does a final level of quality check and quality assurance to get rid of any unwanted or undesired mistakes. This might include but not limited to getting rid of the any typos, duplication of numbers or missing of any important information. The people involved in this process include technical content writers, research heads and graphics people. Once this process is completed the title gets uploader on our platform for our clients to read it.
Step 5: Final QC/QA Process:
This is the last process and comes when the client has ordered the study. In this process a final QA/QC is done before the study is emailed to the client. Since we believe in giving our clients a good experience of our research studies, therefore, to make sure that we do not lack at our end in any way humanly possible we do a final round of quality check and then dispatch the study to the client.
By Component
Solutions
Asset Strategy Management
Asset Reliability Management
Predictive Asset Management
Other Solutions
Services
Professional Services
Managed Services
By Deployment
On-premises
Cloud
By Organization Size
Large Enterprises
SMEs
By Vertical
Energy & Utilities
Manufacturing
Government & Defense
Chemicals
Telecommunications
Healthcare & Pharmaceuticals
Consumer Goods, Food & Beverages
Other Verticals
Request for Segment Customization as per your Business Requirement: Segment Customization Request
REGIONAL COVERAGE:
North America
US
Canada
Mexico
Europe
Eastern Europe
Poland
Romania
Hungary
Turkey
Rest of Eastern Europe
Western Europe
Germany
France
UK
Italy
Spain
Netherlands
Switzerland
Austria
Rest of Western Europe
Asia Pacific
China
India
Japan
South Korea
Vietnam
Singapore
Australia
Rest of Asia Pacific
Middle East & Africa
Middle East
UAE
Egypt
Saudi Arabia
Qatar
Rest of the Middle East
Africa
Nigeria
South Africa
Rest of Africa
Latin America
Brazil
Argentina
Colombia
Request for Country Level Research Report: Country Level Customization Request
Available Customization
With the given market data, SNS Insider offers customization as per the company’s specific needs. The following customization options are available for the report:
Product Analysis
Criss-Cross segment analysis (e.g. Product X Application)
Product Matrix which gives a detailed comparison of product portfolio of each company
Geographic Analysis
Additional countries in any of the regions
Company Information
Detailed analysis and profiling of additional market players (Up to five)
The Green IT Services Market was valued at USD 18.8 Billion in 2023 and is expected to reach USD 69.4 Billion by 2032, growing at a CAGR of 15.65% from 2024-2032.
IoT Middleware Market was valued at USD 15.4 billion in 2023 and is expected to reach USD 61.06 billion by 2032, growing at a CAGR of 16.58% by 2032.
Digital Asset Management Market Size was valued at USD 4.3 Billion in 2023 and is expected to reach USD 16 Billion by 2032, growing at a CAGR of 15.7% over the forecast period 2024-2032.
The Virtual Event Platform Market size was USD 13.73 Billion in 2023 and is expected to reach USD 45.58 Billion by 2032 with a growing CAGR of 14.26% over the forecast period of 2024-2032.
The Virtual Reality (VR) Content Creation Market size was valued at USD 4.80 billion in 2023 and is expected to reach USD 163.8 Billion by 2032, growing at a CAGR of 45.49% from 2024-2032.
The Smart Luggage Market was valued at USD 2.38 billion in 2023 and is expected to reach USD 9.22 billion by 2032, growing at a CAGR of 16.28% over the forecast period 2024-2032.

Hi! Click one of our member below to chat on Phone
© 2025 All Rights Reserved by SNS Insider Pvt Ltd


