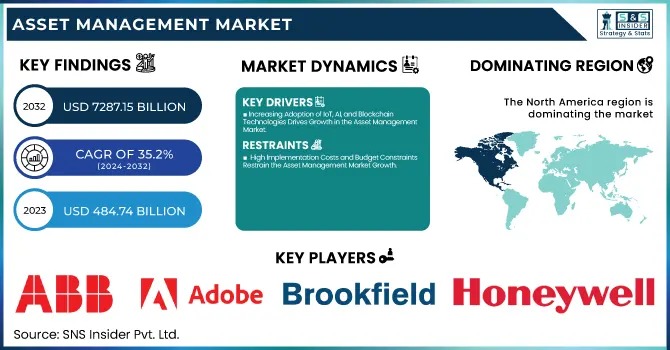
The Asset Management Market Size was valued at USD 484.74 Billion in 2023 and is expected to reach USD 7287.15 Billion by 2032 and grow at a CAGR of 35.2% over the forecast period 2024-2032. The Market penetration and technology adoption rates highlight the integration of AI, IoT, and blockchain. ROI metrics showcase cost savings and efficiency improvements, while operational efficiency statistics track downtime and maintenance cost reductions. Regulatory compliance metrics assess industry adherence to asset tracking standards. Investment trends monitor venture capital and private equity funding. End-user adoption rates reflect the shift from manual to digital solutions, while workforce impact statistics and industry benchmarks reveal productivity gains and asset utilization improvements across sectors.
Key Drivers:
Increasing Adoption of IoT, AI, and Blockchain Technologies Drives Growth in the Asset Management Market
The integration of IoT, AI, and blockchain in asset management is revolutionizing the way businesses track, monitor, and optimize assets. IoT-enabled sensors provide real-time asset tracking, predictive maintenance, and enhanced visibility, reducing operational downtime and maintenance costs. AI-driven analytics improve decision-making, risk assessment, and lifecycle management, enabling businesses to maximize asset efficiency. Blockchain enhances security, transparency, and traceability, ensuring compliance with regulatory standards and minimizing fraud risks. Industries such as manufacturing, healthcare, logistics, and energy are increasingly leveraging these technologies to streamline operations and improve ROI. As digital transformation accelerates, organizations are investing heavily in smart asset management solutions, driving significant market growth. Furthermore, the rising demand for sustainable and efficient asset utilization is pushing companies to adopt these advanced technologies. With ongoing advancements and increased automation, IoT, AI, and blockchain are expected to remain key drivers shaping the future of the Asset Management Market.
Restrain:
High Implementation Costs and Budget Constraints Restrain the Asset Management Market Growth
The adoption of advanced asset management solutions comes with high initial implementation costs, maintenance expenses, and integration challenges, which act as major restraints in market growth. Businesses, particularly small and medium-sized enterprises (SMEs), often struggle to allocate budgets for IoT infrastructure, AI-based analytics platforms, and blockchain integration, limiting market penetration. Additionally, the cost of training employees and upgrading legacy systems to accommodate digital asset management adds to the financial burden. Companies in sectors with tight profit margins, such as retail, logistics, and healthcare, may hesitate to invest in such solutions, fearing low short-term ROI. Moreover, the complexity of integrating new technologies with existing IT ecosystems creates additional challenges. Without proper financial planning and support from regulatory incentives, businesses may delay or completely avoid investing in asset management technologies, thereby hindering market expansion despite its long-term benefits.
Opportunities:
Growing Demand for Cloud-Based and AI-Powered Solutions Creates New Opportunities in the Asset Management Market
The rapid shift toward cloud-based and AI-powered asset management solutions presents significant growth opportunities for market players. Cloud-based platforms offer scalability, remote accessibility, and cost-effectiveness, making them ideal for businesses looking to enhance asset visibility and control across multiple locations. AI-driven predictive analytics further improve asset utilization, maintenance scheduling, and risk mitigation, ensuring operational efficiency and cost reduction. Companies are increasingly leveraging Software-as-a-Service (SaaS) models for asset tracking and lifecycle management, eliminating the need for expensive on-premise infrastructure. Additionally, the rise of Industry 4.0, smart factories, and digital twins is accelerating cloud adoption in manufacturing and logistics sectors. With cybersecurity advancements and improved data encryption, concerns regarding cloud security are being mitigated, further driving adoption. As enterprises prioritize digital transformation, automation, and data-driven decision-making, the demand for cloud-based and AI-powered asset management solutions will continue to grow, opening new revenue streams for technology providers.
Challenges:
Data Security and Cyber Threats Pose Major Challenges to the Asset Management Market Growth
As businesses increasingly rely on IoT, AI, and cloud-based asset management solutions, concerns over data security, cyber threats, and system vulnerabilities are rising. Asset management platforms store and process sensitive enterprise data, including financial records, equipment details, and operational insights, making them prime targets for cyberattacks. Ransomware, data breaches, and hacking incidents pose risks to asset integrity and business continuity. Additionally, the growing integration of IoT devices increases potential attack vectors, as unsecured endpoints can be exploited to access critical systems. Organizations must invest in advanced cybersecurity solutions, encryption technologies, and multi-factor authentication to safeguard their asset management networks. However, small and mid-sized businesses (SMBs) often lack the resources and expertise to implement strong cybersecurity frameworks, making them vulnerable to attacks. Regulatory bodies are enforcing strict compliance measures, requiring businesses to adopt robust data protection strategies. Addressing cybersecurity risks remains a key challenge for ensuring long-term market growth.
By Asset Type
The Digital Assets segment accounted for the largest revenue share of 25% in 2023, driven by the increasing demand for secure, scalable, and AI-powered asset management solutions. Businesses across industries are investing in blockchain, cloud-based storage, and AI-driven analytics to efficiently manage their growing digital asset portfolios. The adoption of blockchain for asset tokenization and secure data management is gaining momentum, ensuring transparency and reducing fraud risks. Organizations in sectors such as finance, media, and healthcare are leveraging advanced asset management platforms to streamline operations, reduce costs, and optimize asset utilization.
The In-Transit Assets segment is experiencing the highest CAGR of 37.62%, fueled by the increasing demand for real-time tracking, predictive analytics, and IoT-enabled logistics solutions. Companies are investing in RFID, GPS, and AI-powered analytics to improve supply chain visibility and asset security. The rise of e-commerce, global trade expansion, and just-in-time delivery models is further driving demand for advanced asset-tracking solutions. Logistics and transportation companies are increasingly leveraging cloud-based asset management platforms to reduce transit delays, optimize fleet performance, and mitigate risks.
By Function
The Location & Movement Tracking segment dominated the Asset Management Market with a 37% revenue share in 2023, driven by the increasing need for real-time visibility, operational efficiency, and security across industries. Businesses are integrating IoT, RFID, GPS, and AI-driven tracking solutions to enhance asset utilization, prevent losses, and improve productivity.
Industries such as logistics, manufacturing, healthcare, and aviation are increasingly adopting location and movement tracking solutions to optimize supply chains, workforce efficiency, and equipment management. With growing regulatory requirements for asset traceability and compliance, companies are investing in cloud-based asset-tracking platforms to ensure seamless integration and security.
The Repair and Maintenance segment is projected to grow at the highest CAGR of 37.73%, driven by the rising adoption of predictive maintenance, AI-powered diagnostics, and digital twin technology in asset management. Businesses are shifting from reactive to predictive maintenance models, reducing downtime, operational costs, and equipment failures.
In June 2024, IBM expanded its Maximo Application Suite, integrating AI-based predictive maintenance tools for industrial asset management. Similarly, Rockwell Automation introduced LifecycleIQ Services, providing proactive maintenance solutions to optimize asset performance and longevity.
By Application
The Aviation Asset Management segment dominated the Asset Management Market with a 63% revenue share in 2023, driven by the rising demand for fleet optimization, predictive maintenance, and digital tracking solutions. Airlines and airport authorities are increasingly adopting AI, IoT, blockchain, and cloud-based platforms to streamline asset lifecycle management, reduce operational costs, and enhance safety compliance.
In March 2024, SAP SE launched SAP Intelligent Asset Management, integrating AI-powered predictive analytics for aircraft maintenance and component tracking. Similarly, GE Aerospace introduced a digital twin-based asset management solution, allowing airlines to monitor engine performance and prevent failures in real time.
The aviation industry is under stringent regulatory pressure to ensure optimal asset utilization, risk mitigation, and compliance with safety standards. With the increasing adoption of smart asset tracking, blockchain-based leasing solutions, and automated maintenance scheduling, aviation companies are improving fleet longevity, reducing downtime, and optimizing fuel efficiency.
The Infrastructure Asset Management segment is experiencing the highest CAGR of 38.8%, driven by the increasing focus on smart infrastructure, digital transformation, and sustainability initiatives. Governments and enterprises are investing in IoT-enabled sensors, AI-driven predictive analytics, and cloud-based asset management platforms to enhance the efficiency and longevity of infrastructure assets such as transportation networks, energy grids, water systems, and public utilities.
In November 2024, Bentley Systems launched OpenCities Planner, a digital twin-based infrastructure asset management solution designed to improve urban planning and maintenance efficiency. Similarly, Hexagon AB introduced HxGN EAM, an AI-powered asset management platform tailored for critical infrastructure monitoring and lifecycle optimization.
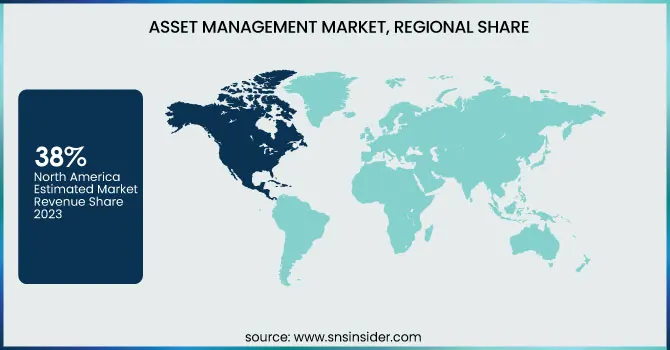
North America led the Asset Management Market in 2023, holding an estimated 38% market share, driven by high technology adoption, strong regulatory frameworks, and substantial investments in digital asset management solutions. The region’s dominance is fueled by the presence of key market players such as IBM, Oracle, Rockwell Automation, and Honeywell, which are continuously innovating in AI, IoT, and cloud-based asset management.
Additionally, Zebra Technologies launched an upgraded MotionWorks Asset Tracking solution, enhancing real-time asset visibility for logistics and healthcare industries. The stringent regulatory requirements in sectors like healthcare, aviation, and infrastructure have also pushed organizations to adopt smart asset management solutions.
The Asia Pacific region is experiencing the highest growth in the Asset Management Market, with an estimated CAGR of 39.4%, driven by rapid industrialization, digital transformation, and increased investments in infrastructure and smart asset management solutions.
Similarly, Siemens expanded its MindSphere IoT suite, enabling real-time tracking and predictive analytics for industrial assets. The rising adoption of cloud-based asset management platforms in sectors such as manufacturing, energy, and transportation is accelerating growth in the region. With government initiatives promoting smart infrastructure and digital transformation, Asia Pacific is expected to witness exponential growth, making it the most promising region in the global Asset Management Market.
Some of the major players in the Asset Management Market are:
ABB Inc. (ABB Ability™ Asset Suite, ABB Ability™ Smart Sensor)
Adobe Systems Inc. (Adobe Experience Manager Assets, Adobe Workfront)
Brookfield Asset Management Inc. (Brookfield Infrastructure Asset Solutions, Brookfield Asset Lifecycle Management)
Honeywell International Inc. (Honeywell Forge Asset Performance Management, Honeywell RTLS for Asset Tracking)
IBM Corp. (IBM Maximo Application Suite, IBM TRIRIGA)
Oracle Corp. (Oracle Enterprise Asset Management (EAM), Oracle Primavera Unifier)
Rockwell Automation, Inc. (FactoryTalk AssetCentre, Rockwell Automation LifecycleIQ Services)
Siemens AG (Siemens Teamcenter Asset Management, Siemens MindSphere)
WSP Global Inc. (WSP Asset Management Advisory, WSP Infrastructure Asset Solutions)
Zebra Technologies Corp. (Zebra MotionWorks Asset Tracking, Zebra RFID Asset Management)
Hitachi, Ltd. (Hitachi Lumada Asset Performance Management, Hitachi Asset Lifecycle Management)
General Electric Company (GE Digital APM (Asset Performance Management), GE Predix Asset Performance Management)
Bentley Systems, Incorporated (Bentley AssetWise, Bentley OpenUtilities)
Hexagon AB (Hexagon HxGN EAM (Enterprise Asset Management), Hexagon Asset Lifecycle Intelligence)
AssetWorks, Inc. (AssetWorks EAM, AssetWorks FleetFocus)
SAP SE (SAP Intelligent Asset Management, SAP Enterprise Asset Management)
November 2024: ABB completed its second investment in Pratexo, an edge-to-cloud solution provider, strengthening its capabilities in industrial asset management. This investment aimed to enhance real-time data processing and decision-making for asset-intensive industries.
June 2024: Adobe introduced a generative AI-powered Content Hub to transform digital asset management. The platform enabled brands to manage and optimize millions of creative assets efficiently, improving workflow automation and asset utilization.
Report Attributes | Details |
Market Size in 2023 | US$ 484.74 Billion |
Market Size by 2032 | US$ 7287.15 Billion |
CAGR | CAGR of 35.2 % From 2024 to 2032 |
Base Year | 2023 |
Forecast Period | 2024-2032 |
Historical Data | 2020-2022 |
Report Scope & Coverage | Market Size, Segments Analysis, Competitive Landscape, Regional Analysis, DROC & SWOT Analysis, Forecast Outlook |
Key Segments | • By Component (Solution [Real-Time Location System (RTLS), Barcode, Mobile Computer, Labels, Global Positioning System (GPS), Others], Service [Strategic Asset Management, Operational Asset Management, Tactical Asset Management]) • By Asset Type (Digital Assets, Returnable Transport Assets, In-transit Assets, Manufacturing Assets, Personnel/Staff) • By Function (Location & Movement Tracking, Check-In/Check-Out, Repair and Maintenance, Others) • By Application (Infrastructure Asset Management [Transportation, Energy Infrastructure, Water & Waste Infrastructure, Critical Infrastructure, Others], Enterprise Asset Management, Healthcare Asset Management, Aviation Asset Management, Others) |
Regional Analysis/Coverage | North America (US, Canada, Mexico), Europe (Eastern Europe [Poland, Romania, Hungary, Turkey, Rest of Eastern Europe] Western Europe] Germany, France, UK, Italy, Spain, Netherlands, Switzerland, Austria, Rest of Western Europe]), Asia Pacific (China, India, Japan, South Korea, Vietnam, Singapore, Australia, Rest of Asia Pacific), Middle East & Africa (Middle East [UAE, Egypt, Saudi Arabia, Qatar, Rest of Middle East], Africa [Nigeria, South Africa, Rest of Africa], Latin America (Brazil, Argentina, Colombia, Rest of Latin America) |
Company Profiles | ABB Inc., Adobe Systems Inc., Brookfield Asset Management Inc., Honeywell International Inc., IBM Corp., Oracle Corp., Rockwell Automation, Inc., Siemens AG, WSP Global Inc., Zebra Technologies Corp., Hitachi, Ltd., General Electric Company, Bentley Systems, Incorporated, Hexagon AB, AssetWorks, Inc., SAP SE. |
Ans: The Asset Management Market is expected to grow at a CAGR of 35.2% during 2024-2032.
Ans: The Asset Management Market size was USD 484.74 billion in 2023 and is expected to Reach USD 7287.15 billion by 2032.
Ans: The major growth factor of the Asset Management Market is the increasing adoption of AI, IoT, and cloud-based solutions for real-time asset tracking, predictive maintenance, and operational efficiency across industries.
Ans: The Digital Assets segment dominated the Asset Management Market.
Ans: North America dominated the Asset Management Market in 2023.
Table Of Content
1. Introduction
1.1 Market Definition
1.2 Scope (Inclusion and Exclusions)
1.3 Research Assumptions
2. Executive Summary
2.1 Market Overview
2.2 Regional Synopsis
2.3 Competitive Summary
3. Research Methodology
3.1 Top-Down Approach
3.2 Bottom-up Approach
3.3. Data Validation
3.4 Primary Interviews
4. Market Dynamics Impact Analysis
4.1 Market Driving Factors Analysis
4.1.1 Drivers
4.1.2 Restraints
4.1.3 Opportunities
4.1.4 Challenges
4.2 PESTLE Analysis
4.3 Porter’s Five Forces Model
5. Statistical Insights and Trends Reporting
5.1 Return on Investment (ROI), 2023
5.2 Regulatory Compliance Metrics, 2023
5.3 Investment & Funding Trends, 2023
5.4 Lifecycle Cost Analysis
6. Competitive Landscape
6.1 List of Major Companies, By Region
6.2 Market Share Analysis, By Region
6.3 Product Benchmarking
6.3.1 Product specifications and features
6.3.2 Pricing
6.4 Strategic Initiatives
6.4.1 Marketing and promotional activities
6.4.2 Distribution and Supply Chain Strategies
6.4.3 Expansion plans and new product launches
6.4.4 Strategic partnerships and collaborations
6.5 Technological Advancements
6.6 Market Positioning and Branding
7. Asset Management Market Segmentation, By Application
7.1 Chapter Overview
7.2 Infrastructure Asset Management
7.2.1 Infrastructure Asset Management Market Trends Analysis (2020-2032)
7.2.2 Infrastructure Asset Management Market Size Estimates and Forecasts to 2032 (USD Billion)
7.2.3 Transportation
7.2.3.1 Transportation Market Trends Analysis (2020-2032)
7.2.3.2 Transportation Market Size Estimates and Forecasts to 2032 (USD Billion)
7.2.4 Energy Infrastructure
7.2.4.1 Energy Infrastructure Market Trends Analysis (2020-2032)
7.2.4.2 Energy Infrastructure Market Size Estimates and Forecasts to 2032 (USD Billion)
7.2.5 Water & Waste Infrastructure
7.2.5.1 Water & Waste Infrastructure Market Trends Analysis (2020-2032)
7.2.5.2 Water & Waste Infrastructure Market Size Estimates and Forecasts to 2032 (USD Billion)
7.2.6 Critical Infrastructure
7.2.6.1 Critical Infrastructure Market Trends Analysis (2020-2032)
7.2.6.2 Critical Infrastructure Market Size Estimates and Forecasts to 2032 (USD Billion)
7.2.7 Others
7.2.7.1 Others Market Trends Analysis (2020-2032)
7.2.7.2 Others Market Size Estimates and Forecasts to 2032 (USD Billion)
7.3 Enterprise Asset Management
7.3.1 Enterprise Asset Management Market Trends Analysis (2020-2032)
7.3.2 Enterprise Asset Management Market Size Estimates and Forecasts to 2032 (USD Billion)
7.4 Healthcare Asset Management
7.4.1 Healthcare Asset Management Market Trends Analysis (2020-2032)
7.4.2 Healthcare Asset Management Market Size Estimates and Forecasts to 2032 (USD Billion)
7.5 Aviation Asset Management
7.5.1 Aviation Asset Management Market Trends Analysis (2020-2032)
7.5.2 Aviation Asset Management Market Size Estimates and Forecasts to 2032 (USD Billion)
7.6 Others
7.6.1 Others Market Trends Analysis (2020-2032)
7.6.2 Others Market Size Estimates and Forecasts to 2032 (USD Billion)
8. Asset Management Market Segmentation, By Component
8.1 Chapter Overview
8.2 Solution
8.2.1 Solution Market Trends Analysis (2020-2032)
8.2.2 Solution Market Size Estimates and Forecasts to 2032 (USD Billion)
8.2.3 Real-Time Location System (RTLS)
8.2.3.1 Real-Time Location System (RTLS) Market Trends Analysis (2020-2032)
8.2.3.2 Real-Time Location System (RTLS) Market Size Estimates and Forecasts to 2032 (USD Billion)
8.2.4 Barcode
8.2.4.1 Barcode Market Trends Analysis (2020-2032)
8.2.4.2 Barcode Market Size Estimates and Forecasts to 2032 (USD Billion)
8.2.5 Mobile Computer
8.2.5.1 Mobile Computer Market Trends Analysis (2020-2032)
8.2.5.2 Mobile Computer Market Size Estimates and Forecasts to 2032 (USD Billion)
8.2.6 Labels
8.2.6.1 Labels Market Trends Analysis (2020-2032)
8.2.6.2 Labels Market Size Estimates and Forecasts to 2032 (USD Billion)
8.2.7 Global Positioning System (GPS)
8.2.7.1 Global Positioning System (GPS) Market Trends Analysis (2020-2032)
8.2.7.2 Global Positioning System (GPS) Market Size Estimates and Forecasts to 2032 (USD Billion)
8.2.8 Others
8.2.8.1 Others Market Trends Analysis (2020-2032)
8.2.8.2 Others Market Size Estimates and Forecasts to 2032 (USD Billion)
8.3 Services
8.3.1 Services Market Trends Analysis (2020-2032)
8.3.2 Services Market Size Estimates and Forecasts to 2032 (USD Billion)
8.3.3 Strategic Asset Management
8.3.3.1 Strategic Asset Management Market Trends Analysis (2020-2032)
8.3.3.2 Strategic Asset Management Market Size Estimates and Forecasts to 2032 (USD Billion)
8.3.4 Operational Asset Management
8.3.4.1 Operational Asset Management Market Trends Analysis (2020-2032)
8.3.4.2 Operational Asset Management Market Size Estimates and Forecasts to 2032 (USD Billion)
8.3.5 Tactical Asset Management
8.3.5.1 Tactical Asset Management Market Trends Analysis (2020-2032)
8.3.5.2 Tactical Asset Management Size Estimates and Forecasts to 2032 (USD Billion)
9. Asset Management Market Segmentation, By Asset Type
9.1 Chapter Overview
9.2 Digital Assets
9.2.1 Digital Assets Market Trends Analysis (2020-2032)
9.2.2 Digital Assets Market Size Estimates and Forecasts to 2032 (USD Billion)
9.3 Returnable Transport Assets
9.3.1 Returnable Transport Assets Market Trends Analysis (2020-2032)
9.3.2 Returnable Transport Assets Market Size Estimates and Forecasts to 2032 (USD Billion)
9.4 In-transit Assets
9.4.1 In-transit Assets Market Trends Analysis (2020-2032)
9.4.2 In-transit Assets Market Size Estimates and Forecasts to 2032 (USD Billion)
9.5 Manufacturing Assets
9.5.1 Manufacturing Assets Assets Market Trends Analysis (2020-2032)
9.5.2 Manufacturing Assets Market Size Estimates and Forecasts to 2032 (USD Billion)
9.6 Personnel/ Staff
9.6.1 Personnel/ Staff Market Trends Analysis (2020-2032)
9.6.2 Personnel/ Staff Market Size Estimates and Forecasts to 2032 (USD Billion)
10. Asset Management Market Segmentation, By Function
10.1 Chapter Overview
10.2 Location & Movement Tracking
10.2.1 Location & Movement Tracking Market Trends Analysis (2020-2032)
10.2.2 Location & Movement Tracking Market Size Estimates and Forecasts to 2032 (USD Billion)
10.3 Check In/ Check Out
10.3.1 Check In/ Check Out Market Trends Analysis (2020-2032)
10.3.2 Check In/ Check Out Market Size Estimates and Forecasts to 2032 (USD Billion)
10.4 Repair and Maintenance
10.4.1 Repair and Maintenance Market Trends Analysis (2020-2032)
10.4.2 Repair and Maintenance Market Size Estimates and Forecasts to 2032 (USD Billion)
10.5 Others
10.5.1 Others Market Trends Analysis (2020-2032)
10.5.2 Others Market Size Estimates and Forecasts to 2032 (USD Billion)
11. Regional Analysis
11.1 Chapter Overview
11.2 North America
11.2.1 Trends Analysis
11.2.2 North America Asset Management Market Estimates and Forecasts, by Country (2020-2032) (USD Billion)
11.2.3 North America Asset Management Market Estimates and Forecasts, By Application (2020-2032) (USD Billion)
11.2.4 North America Asset Management Market Estimates and Forecasts, By Component (2020-2032) (USD Billion)
11.2.5 North America Asset Management Market Estimates and Forecasts, By Asset Type (2020-2032) (USD Billion)
11.2.6 North America Asset Management Market Estimates and Forecasts, By Function(2020-2032) (USD Billion)
11.2.7 USA
11.2.7.1 USA Asset Management Market Estimates and Forecasts, By Application (2020-2032) (USD Billion)
11.2.7.2 USA Asset Management Market Estimates and Forecasts, By Component (2020-2032) (USD Billion)
11.2.7.3 USA Asset Management Market Estimates and Forecasts, By Asset Type (2020-2032) (USD Billion)
11.2.7.4 USA Asset Management Market Estimates and Forecasts, By Function(2020-2032) (USD Billion)
11.2.8 Canada
11.2.8.1 Canada Asset Management Market Estimates and Forecasts, By Application (2020-2032) (USD Billion)
11.2.8.2 Canada Asset Management Market Estimates and Forecasts, By Component (2020-2032) (USD Billion)
11.2.8.3 Canada Asset Management Market Estimates and Forecasts, By Asset Type (2020-2032) (USD Billion)
11.2.8.4 Canada Asset Management Market Estimates and Forecasts, By Function (2020-2032) (USD Billion)
11.2.9 Mexico
11.2.9.1 Mexico Asset Management Market Estimates and Forecasts, By Application (2020-2032) (USD Billion)
11.2.9.2 Mexico Asset Management Market Estimates and Forecasts, By Component (2020-2032) (USD Billion)
11.2.9.3 Mexico Asset Management Market Estimates and Forecasts, By Asset Type (2020-2032) (USD Billion)
11.2.9.4 Mexico Asset Management Market Estimates and Forecasts, By Function (2020-2032) (USD Billion)
11.3 Europe
11.3.1 Eastern Europe
11.3.1.1 Trends Analysis
11.3.1.2 Eastern Europe Asset Management Market Estimates and Forecasts, by Country (2020-2032) (USD Billion)
11.3.1.3 Eastern Europe Asset Management Market Estimates and Forecasts, By Application (2020-2032) (USD Billion)
11.3.1.4 Eastern Europe Asset Management Market Estimates and Forecasts, By Component (2020-2032) (USD Billion)
11.3.1.5 Eastern Europe Asset Management Market Estimates and Forecasts, By Asset Type (2020-2032) (USD Billion)
11.3.1.6 Eastern Europe Asset Management Market Estimates and Forecasts, By Function(2020-2032) (USD Billion)
11.3.1.7 Poland
11.3.1.7.1 Poland Asset Management Market Estimates and Forecasts, By Application (2020-2032) (USD Billion)
11.3.1.7.2 Poland Asset Management Market Estimates and Forecasts, By Component (2020-2032) (USD Billion)
11.3.1.7.3 Poland Asset Management Market Estimates and Forecasts, By Asset Type (2020-2032) (USD Billion)
11.3.1.7.4 Poland Asset Management Market Estimates and Forecasts, By Function(2020-2032) (USD Billion)
11.3.1.8 Romania
11.3.1.8.1 Romania Asset Management Market Estimates and Forecasts, By Application (2020-2032) (USD Billion)
11.3.1.8.2 Romania Asset Management Market Estimates and Forecasts, By Component (2020-2032) (USD Billion)
11.3.1.8.3 Romania Asset Management Market Estimates and Forecasts, By Asset Type (2020-2032) (USD Billion)
11.3.1.8.4 Romania Asset Management Market Estimates and Forecasts, By Function (2020-2032) (USD Billion)
11.3.1.9 Hungary
11.3.1.9.1 Hungary Asset Management Market Estimates and Forecasts, By Application (2020-2032) (USD Billion)
11.3.1.9.2 Hungary Asset Management Market Estimates and Forecasts, By Component (2020-2032) (USD Billion)
11.3.1.9.3 Hungary Asset Management Market Estimates and Forecasts, By Asset Type (2020-2032) (USD Billion)
11.3.1.9.4 Hungary Asset Management Market Estimates and Forecasts, By Function (2020-2032) (USD Billion)
11.3.1.10 Turkey
11.3.1.10.1 Turkey Asset Management Market Estimates and Forecasts, By Application (2020-2032) (USD Billion)
11.3.1.10.2 Turkey Asset Management Market Estimates and Forecasts, By Component (2020-2032) (USD Billion)
11.3.1.10.3 Turkey Asset Management Market Estimates and Forecasts, By Asset Type (2020-2032) (USD Billion)
11.3.1.10.4 Turkey Asset Management Market Estimates and Forecasts, By Function (2020-2032) (USD Billion)
11.3.1.11 Rest of Eastern Europe
11.3.1.11.1 Rest of Eastern Europe Asset Management Market Estimates and Forecasts, By Application (2020-2032) (USD Billion)
11.3.1.11.2 Rest of Eastern Europe Asset Management Market Estimates and Forecasts, By Component (2020-2032) (USD Billion)
11.3.1.11.3 Rest of Eastern Europe Asset Management Market Estimates and Forecasts, By Asset Type (2020-2032) (USD Billion)
11.3.1.11.4 Rest of Eastern Europe Asset Management Market Estimates and Forecasts, By Function (2020-2032) (USD Billion)
11.3.2 Western Europe
11.3.2.1 Trends Analysis
11.3.2.2 Western Europe Asset Management Market Estimates and Forecasts, by Country (2020-2032) (USD Billion)
11.3.2.3 Western Europe Asset Management Market Estimates and Forecasts, By Application (2020-2032) (USD Billion)
11.3.2.4 Western Europe Asset Management Market Estimates and Forecasts, By Component (2020-2032) (USD Billion)
11.3.2.5 Western Europe Asset Management Market Estimates and Forecasts, By Asset Type (2020-2032) (USD Billion)
11.3.2.6 Western Europe Asset Management Market Estimates and Forecasts, By Function (2020-2032) (USD Billion)
11.3.2.7 Germany
11.3.2.7.1 Germany Asset Management Market Estimates and Forecasts, By Application (2020-2032) (USD Billion)
11.3.2.7.2 Germany Asset Management Market Estimates and Forecasts, By Component (2020-2032) (USD Billion)
11.3.2.7.3 Germany Asset Management Market Estimates and Forecasts, By Asset Type (2020-2032) (USD Billion)
11.3.2.7.4 Germany Asset Management Market Estimates and Forecasts, By Function (2020-2032) (USD Billion)
11.3.2.8 France
11.3.2.8.1 France Asset Management Market Estimates and Forecasts, By Application (2020-2032) (USD Billion)
11.3.2.8.2 France Asset Management Market Estimates and Forecasts, By Component (2020-2032) (USD Billion)
11.3.2.8.3 France Asset Management Market Estimates and Forecasts, By Asset Type (2020-2032) (USD Billion)
11.3.2.8.4 France Asset Management Market Estimates and Forecasts, By Function (2020-2032) (USD Billion)
11.3.2.9 UK
11.3.2.9.1 UK Asset Management Market Estimates and Forecasts, By Application (2020-2032) (USD Billion)
11.3.2.9.2 UK Asset Management Market Estimates and Forecasts, By Component (2020-2032) (USD Billion)
11.3.2.9.3 UK Asset Management Market Estimates and Forecasts, By Asset Type (2020-2032) (USD Billion)
11.3.2.9.4 UK Asset Management Market Estimates and Forecasts, By Function (2020-2032) (USD Billion)
11.3.2.10 Italy
11.3.2.10.1 Italy Asset Management Market Estimates and Forecasts, By Application (2020-2032) (USD Billion)
11.3.2.10.2 Italy Asset Management Market Estimates and Forecasts, By Component (2020-2032) (USD Billion)
11.3.2.10.3 Italy Asset Management Market Estimates and Forecasts, By Asset Type (2020-2032) (USD Billion)
11.3.2.10.4 Italy Asset Management Market Estimates and Forecasts, By Function (2020-2032) (USD Billion)
11.3.2.11 Spain
11.3.2.11.1 Spain Asset Management Market Estimates and Forecasts, By Application (2020-2032) (USD Billion)
11.3.2.11.2 Spain Asset Management Market Estimates and Forecasts, By Component (2020-2032) (USD Billion)
11.3.2.11.3 Spain Asset Management Market Estimates and Forecasts, By Asset Type (2020-2032) (USD Billion)
11.3.2.11.4 Spain Asset Management Market Estimates and Forecasts, By Function (2020-2032) (USD Billion)
11.3.2.12 Netherlands
11.3.2.12.1 Netherlands Asset Management Market Estimates and Forecasts, By Application (2020-2032) (USD Billion)
11.3.2.12.2 Netherlands Asset Management Market Estimates and Forecasts, By Component (2020-2032) (USD Billion)
11.3.2.12.3 Netherlands Asset Management Market Estimates and Forecasts, By Asset Type (2020-2032) (USD Billion)
11.3.2.12.4 Netherlands Asset Management Market Estimates and Forecasts, By Function (2020-2032) (USD Billion)
11.3.2.13 Switzerland
11.3.2.13.1 Switzerland Asset Management Market Estimates and Forecasts, By Application (2020-2032) (USD Billion)
11.3.2.13.2 Switzerland Asset Management Market Estimates and Forecasts, By Component (2020-2032) (USD Billion)
11.3.2.13.3 Switzerland Asset Management Market Estimates and Forecasts, By Asset Type (2020-2032) (USD Billion)
11.3.2.13.4 Switzerland Asset Management Market Estimates and Forecasts, By Function (2020-2032) (USD Billion)
11.3.2.14 Austria
11.3.2.14.1 Austria Asset Management Market Estimates and Forecasts, By Application (2020-2032) (USD Billion)
11.3.2.14.2 Austria Asset Management Market Estimates and Forecasts, By Component (2020-2032) (USD Billion)
11.3.2.14.3 Austria Asset Management Market Estimates and Forecasts, By Asset Type (2020-2032) (USD Billion)
11.3.2.14.4 Austria Asset Management Market Estimates and Forecasts, By Function (2020-2032) (USD Billion)
11.3.2.15 Rest of Western Europe
11.3.2.15.1 Rest of Western Europe Asset Management Market Estimates and Forecasts, By Application (2020-2032) (USD Billion)
11.3.2.15.2 Rest of Western Europe Asset Management Market Estimates and Forecasts, By Component (2020-2032) (USD Billion)
11.3.2.15.3 Rest of Western Europe Asset Management Market Estimates and Forecasts, By Asset Type (2020-2032) (USD Billion)
11.3.2.15.4 Rest of Western Europe Asset Management Market Estimates and Forecasts, By Function (2020-2032) (USD Billion)
11.4 Asia Pacific
11.4.1 Trends Analysis
11.4.2 Asia Pacific Asset Management Market Estimates and Forecasts, by Country (2020-2032) (USD Billion)
11.4.3 Asia Pacific Asset Management Market Estimates and Forecasts, By Application (2020-2032) (USD Billion)
11.4.4 Asia Pacific Asset Management Market Estimates and Forecasts, By Component (2020-2032) (USD Billion)
11.4.5 Asia Pacific Asset Management Market Estimates and Forecasts, By Asset Type (2020-2032) (USD Billion)
11.4.6 Asia Pacific Asset Management Market Estimates and Forecasts, By Function (2020-2032) (USD Billion)
11.4.7 China
11.4.7.1 China Asset Management Market Estimates and Forecasts, By Application (2020-2032) (USD Billion)
11.4.7.2 China Asset Management Market Estimates and Forecasts, By Component (2020-2032) (USD Billion)
11.4.7.3 China Asset Management Market Estimates and Forecasts, By Asset Type (2020-2032) (USD Billion)
11.4.7.4 China Asset Management Market Estimates and Forecasts, By Function (2020-2032) (USD Billion)
11.4.8 India
11.4.8.1 India Asset Management Market Estimates and Forecasts, By Application (2020-2032) (USD Billion)
11.4.8.2 India Asset Management Market Estimates and Forecasts, By Component (2020-2032) (USD Billion)
11.4.8.3 India Asset Management Market Estimates and Forecasts, By Asset Type (2020-2032) (USD Billion)
11.4.8.4 India Asset Management Market Estimates and Forecasts, By Function (2020-2032) (USD Billion)
11.4.9 Japan
11.4.9.1 Japan Asset Management Market Estimates and Forecasts, By Application (2020-2032) (USD Billion)
11.4.9.2 Japan Asset Management Market Estimates and Forecasts, By Component (2020-2032) (USD Billion)
11.4.9.3 Japan Asset Management Market Estimates and Forecasts, By Asset Type (2020-2032) (USD Billion)
11.4.9.4 Japan Asset Management Market Estimates and Forecasts, By Function (2020-2032) (USD Billion)
11.4.10 South Korea
11.4.10.1 South Korea Asset Management Market Estimates and Forecasts, By Application (2020-2032) (USD Billion)
11.4.10.2 South Korea Asset Management Market Estimates and Forecasts, By Component (2020-2032) (USD Billion)
11.4.10.3 South Korea Asset Management Market Estimates and Forecasts, By Asset Type (2020-2032) (USD Billion)
11.4.10.4 South Korea Asset Management Market Estimates and Forecasts, By Function (2020-2032) (USD Billion)
11.4.11 Vietnam
11.4.11.1 Vietnam Asset Management Market Estimates and Forecasts, By Application (2020-2032) (USD Billion)
11.4.11.2 Vietnam Asset Management Market Estimates and Forecasts, By Component (2020-2032) (USD Billion)
11.4.11.3 Vietnam Asset Management Market Estimates and Forecasts, By Asset Type (2020-2032) (USD Billion)
11.4.11.4 Vietnam Asset Management Market Estimates and Forecasts, By Function (2020-2032) (USD Billion)
11.4.12 Singapore
11.4.12.1 Singapore Asset Management Market Estimates and Forecasts, By Application (2020-2032) (USD Billion)
11.4.12.2 Singapore Asset Management Market Estimates and Forecasts, By Component (2020-2032) (USD Billion)
11.4.12.3 Singapore Asset Management Market Estimates and Forecasts, By Asset Type (2020-2032) (USD Billion)
11.4.12.4 Singapore Asset Management Market Estimates and Forecasts, By Function (2020-2032) (USD Billion)
11.4.13 Australia
11.4.13.1 Australia Asset Management Market Estimates and Forecasts, By Application (2020-2032) (USD Billion)
11.4.13.2 Australia Asset Management Market Estimates and Forecasts, By Component (2020-2032) (USD Billion)
11.4.13.3 Australia Asset Management Market Estimates and Forecasts, By Asset Type (2020-2032) (USD Billion)
11.4.13.4 Australia Asset Management Market Estimates and Forecasts, By Function (2020-2032) (USD Billion)
11.4.14 Rest of Asia Pacific
11.4.14.1 Rest of Asia Pacific Asset Management Market Estimates and Forecasts, By Application (2020-2032) (USD Billion)
11.4.14.2 Rest of Asia Pacific Asset Management Market Estimates and Forecasts, By Component (2020-2032) (USD Billion)
11.4.14.3 Rest of Asia Pacific Asset Management Market Estimates and Forecasts, By Asset Type (2020-2032) (USD Billion)
11.4.14.4 Rest of Asia Pacific Asset Management Market Estimates and Forecasts, By Function (2020-2032) (USD Billion)
11.5 Middle East and Africa
11.5.1 Middle East
11.5.1.1 Trends Analysis
11.5.1.2 Middle East Asset Management Market Estimates and Forecasts, by Country (2020-2032) (USD Billion)
11.5.1.3 Middle East Asset Management Market Estimates and Forecasts, By Application (2020-2032) (USD Billion)
11.5.1.4 Middle East Asset Management Market Estimates and Forecasts, By Component (2020-2032) (USD Billion)
11.5.1.5 Middle East Asset Management Market Estimates and Forecasts, By Asset Type (2020-2032) (USD Billion)
11.5.1.6 Middle East Asset Management Market Estimates and Forecasts, By Function (2020-2032) (USD Billion)
11.5.1.7 UAE
11.5.1.7.1 UAE Asset Management Market Estimates and Forecasts, By Application (2020-2032) (USD Billion)
11.5.1.7.2 UAE Asset Management Market Estimates and Forecasts, By Component (2020-2032) (USD Billion)
11.5.1.7.3 UAE Asset Management Market Estimates and Forecasts, By Asset Type (2020-2032) (USD Billion)
11.5.1.7.4 UAE Asset Management Market Estimates and Forecasts, By Function (2020-2032) (USD Billion)
11.5.1.8 Egypt
11.5.1.8.1 Egypt Asset Management Market Estimates and Forecasts, By Application (2020-2032) (USD Billion)
11.5.1.8.2 Egypt Asset Management Market Estimates and Forecasts, By Component (2020-2032) (USD Billion)
11.5.1.8.3 Egypt Asset Management Market Estimates and Forecasts, By Asset Type (2020-2032) (USD Billion)
11.5.1.8.4 Egypt Asset Management Market Estimates and Forecasts, By Function (2020-2032) (USD Billion)
11.5.1.9 Saudi Arabia
11.5.1.9.1 Saudi Arabia Asset Management Market Estimates and Forecasts, By Application (2020-2032) (USD Billion)
11.5.1.9.2 Saudi Arabia Asset Management Market Estimates and Forecasts, By Component (2020-2032) (USD Billion)
11.5.1.9.3 Saudi Arabia Asset Management Market Estimates and Forecasts, By Asset Type (2020-2032) (USD Billion)
11.5.1.9.4 Saudi Arabia Asset Management Market Estimates and Forecasts, By Function (2020-2032) (USD Billion)
11.5.1.10 Qatar
11.5.1.10.1 Qatar Asset Management Market Estimates and Forecasts, By Application (2020-2032) (USD Billion)
11.5.1.10.2 Qatar Asset Management Market Estimates and Forecasts, By Component (2020-2032) (USD Billion)
11.5.1.10.3 Qatar Asset Management Market Estimates and Forecasts, By Asset Type (2020-2032) (USD Billion)
11.5.1.10.4 Qatar Asset Management Market Estimates and Forecasts, By Function (2020-2032) (USD Billion)
11.5.1.11 Rest of Middle East
11.5.1.11.1 Rest of Middle East Asset Management Market Estimates and Forecasts, By Application (2020-2032) (USD Billion)
11.5.1.11.2 Rest of Middle East Asset Management Market Estimates and Forecasts, By Component (2020-2032) (USD Billion)
11.5.1.11.3 Rest of Middle East Asset Management Market Estimates and Forecasts, By Asset Type (2020-2032) (USD Billion)
11.5.1.11.4 Rest of Middle East Asset Management Market Estimates and Forecasts, By Function (2020-2032) (USD Billion)
11.5.2 Africa
11.5.2.1 Trends Analysis
11.5.2.2 Africa Asset Management Market Estimates and Forecasts, by Country (2020-2032) (USD Billion)
11.5.2.3 Africa Asset Management Market Estimates and Forecasts, By Application (2020-2032) (USD Billion)
11.5.2.4 Africa Asset Management Market Estimates and Forecasts, By Component (2020-2032) (USD Billion)
11.5.2.5 Africa Asset Management Market Estimates and Forecasts, By Asset Type (2020-2032) (USD Billion)
11.5.2.6 Africa Asset Management Market Estimates and Forecasts, By Function (2020-2032) (USD Billion)
11.5.2.7 South Africa
11.5.2.7.1 South Africa Asset Management Market Estimates and Forecasts, By Application (2020-2032) (USD Billion)
11.5.2.7.2 South Africa Asset Management Market Estimates and Forecasts, By Component (2020-2032) (USD Billion)
11.5.2.7.3 South Africa Asset Management Market Estimates and Forecasts, By Asset Type (2020-2032) (USD Billion)
11.5.2.7.4 South Africa Asset Management Market Estimates and Forecasts, By Function (2020-2032) (USD Billion)
11.5.2.8 Nigeria
11.5.2.8.1 Nigeria Asset Management Market Estimates and Forecasts, By Application (2020-2032) (USD Billion)
11.5.2.8.2 Nigeria Asset Management Market Estimates and Forecasts, By Component (2020-2032) (USD Billion)
11.5.2.8.3 Nigeria Asset Management Market Estimates and Forecasts, By Asset Type (2020-2032) (USD Billion)
11.5.2.8.4 Nigeria Asset Management Market Estimates and Forecasts, By Function (2020-2032) (USD Billion)
11.5.2.9 Rest of Africa
11.5.2.9.1 Rest of Africa Asset Management Market Estimates and Forecasts, By Application (2020-2032) (USD Billion)
11.5.2.9.2 Rest of Africa Asset Management Market Estimates and Forecasts, By Component (2020-2032) (USD Billion)
11.5.2.9.3 Rest of Africa Asset Management Market Estimates and Forecasts, By Asset Type (2020-2032) (USD Billion)
11.5.2.9.4 Rest of Africa Asset Management Market Estimates and Forecasts, By Function (2020-2032) (USD Billion)
11.6 Latin America
11.6.1 Trends Analysis
11.6.2 Latin America Asset Management Market Estimates and Forecasts, by Country (2020-2032) (USD Billion)
11.6.3 Latin America Asset Management Market Estimates and Forecasts, By Application (2020-2032) (USD Billion)
11.6.4 Latin America Asset Management Market Estimates and Forecasts, By Component (2020-2032) (USD Billion)
11.6.5 Latin America Asset Management Market Estimates and Forecasts, By Asset Type (2020-2032) (USD Billion)
11.6.6 Latin America Asset Management Market Estimates and Forecasts, By Function (2020-2032) (USD Billion)
11.6.7 Brazil
11.6.7.1 Brazil Asset Management Market Estimates and Forecasts, By Application (2020-2032) (USD Billion)
11.6.7.2 Brazil Asset Management Market Estimates and Forecasts, By Component (2020-2032) (USD Billion)
11.6.7.3 Brazil Asset Management Market Estimates and Forecasts, By Asset Type (2020-2032) (USD Billion)
11.6.7.4 Brazil Asset Management Market Estimates and Forecasts, By Function (2020-2032) (USD Billion)
11.6.8 Argentina
11.6.8.1 Argentina Asset Management Market Estimates and Forecasts, By Application (2020-2032) (USD Billion)
11.6.8.2 Argentina Asset Management Market Estimates and Forecasts, By Component (2020-2032) (USD Billion)
11.6.8.3 Argentina Asset Management Market Estimates and Forecasts, By Asset Type (2020-2032) (USD Billion)
11.6.8.4 Argentina Asset Management Market Estimates and Forecasts, By Function (2020-2032) (USD Billion)
11.6.9 Colombia
11.6.9.1 Colombia Asset Management Market Estimates and Forecasts, By Application (2020-2032) (USD Billion)
11.6.9.2 Colombia Asset Management Market Estimates and Forecasts, By Component (2020-2032) (USD Billion)
11.6.9.3 Colombia Asset Management Market Estimates and Forecasts, By Asset Type (2020-2032) (USD Billion)
11.6.9.4 Colombia Asset Management Market Estimates and Forecasts, By Function (2020-2032) (USD Billion)
11.6.10 Rest of Latin America
11.6.10.1 Rest of Latin America Asset Management Market Estimates and Forecasts, By Application (2020-2032) (USD Billion)
11.6.10.2 Rest of Latin America Asset Management Market Estimates and Forecasts, By Component (2020-2032) (USD Billion)
11.6.10.3 Rest of Latin America Asset Management Market Estimates and Forecasts, By Asset Type (2020-2032) (USD Billion)
11.6.10.4 Rest of Latin America Asset Management Market Estimates and Forecasts, By Function (2020-2032) (USD Billion)
12. Company Profiles
12.1 ABB Inc.
12.1.1 Company Overview
12.1.2 Financial
12.1.3 Products/ Services Offered
12.1.4 SWOT Analysis
12.2 Adobe Systems Inc.
12.2.1 Company Overview
12.2.2 Financial
12.2.3 Products/ Services Offered
12.2.4 SWOT Analysis
12.3 Brookfield Asset Management Inc.
12.3.1 Company Overview
12.3.2 Financial
12.3.3 Products/ Services Offered
12.3.4 SWOT Analysis
12.4 Honeywell International Inc.
12.4.1 Company Overview
12.4.2 Financial
12.4.3 Products/ Services Offered
12.4.4 SWOT Analysis
12.5 IBM Corp.
12.5.1 Company Overview
12.5.2 Financial
12.5.3 Products/ Services Offered
12.5.4 SWOT Analysis
12.6 Oracle Corp.
12.6.1 Company Overview
12.6.2 Financial
12.6.3 Products/ Services Offered
12.6.4 SWOT Analysis
12.7 Rockwell Automation, Inc.
12.7.1 Company Overview
12.7.2 Financial
12.7.3 Products/ Services Offered
12.7.4 SWOT Analysis
12.8 Siemens AG
12.8.1 Company Overview
12.8.2 Financial
12.8.3 Products/ Services Offered
12.8.4 SWOT Analysis
12.9 WSP Global Inc.
12.9.1 Company Overview
12.9.2 Financial
12.9.3 Products/ Services Offered
12.9.4 SWOT Analysis
12.10 Zebra Technologies Corp.
12.10.1 Company Overview
12.10.2 Financial
12.10.3 Products/ Services Offered
12.10.4 SWOT Analysis
13. Use Cases and Best Practices
14. Conclusion
An accurate research report requires proper strategizing as well as implementation. There are multiple factors involved in the completion of good and accurate research report and selecting the best methodology to compete the research is the toughest part. Since the research reports we provide play a crucial role in any company’s decision-making process, therefore we at SNS Insider always believe that we should choose the best method which gives us results closer to reality. This allows us to reach at a stage wherein we can provide our clients best and accurate investment to output ratio.
Each report that we prepare takes a timeframe of 350-400 business hours for production. Starting from the selection of titles through a couple of in-depth brain storming session to the final QC process before uploading our titles on our website we dedicate around 350 working hours. The titles are selected based on their current market cap and the foreseen CAGR and growth.
The 5 steps process:
Step 1: Secondary Research:
Secondary Research or Desk Research is as the name suggests is a research process wherein, we collect data through the readily available information. In this process we use various paid and unpaid databases which our team has access to and gather data through the same. This includes examining of listed companies’ annual reports, Journals, SEC filling etc. Apart from this our team has access to various associations across the globe across different industries. Lastly, we have exchange relationships with various university as well as individual libraries.
Step 2: Primary Research
When we talk about primary research, it is a type of study in which the researchers collect relevant data samples directly, rather than relying on previously collected data. This type of research is focused on gaining content specific facts that can be sued to solve specific problems. Since the collected data is fresh and first hand therefore it makes the study more accurate and genuine.
We at SNS Insider have divided Primary Research into 2 parts.
Part 1 wherein we interview the KOLs of major players as well as the upcoming ones across various geographic regions. This allows us to have their view over the market scenario and acts as an important tool to come closer to the accurate market numbers. As many as 45 paid and unpaid primary interviews are taken from both the demand and supply side of the industry to make sure we land at an accurate judgement and analysis of the market.
This step involves the triangulation of data wherein our team analyses the interview transcripts, online survey responses and observation of on filed participants. The below mentioned chart should give a better understanding of the part 1 of the primary interview.
Part 2: In this part of primary research the data collected via secondary research and the part 1 of the primary research is validated with the interviews from individual consultants and subject matter experts.
Consultants are those set of people who have at least 12 years of experience and expertise within the industry whereas Subject Matter Experts are those with at least 15 years of experience behind their back within the same space. The data with the help of two main processes i.e., FGDs (Focused Group Discussions) and IDs (Individual Discussions). This gives us a 3rd party nonbiased primary view of the market scenario making it a more dependable one while collation of the data pointers.
Step 3: Data Bank Validation
Once all the information is collected via primary and secondary sources, we run that information for data validation. At our intelligence centre our research heads track a lot of information related to the market which includes the quarterly reports, the daily stock prices, and other relevant information. Our data bank server gets updated every fortnight and that is how the information which we collected using our primary and secondary information is revalidated in real time.
Step 4: QA/QC Process
After all the data collection and validation our team does a final level of quality check and quality assurance to get rid of any unwanted or undesired mistakes. This might include but not limited to getting rid of the any typos, duplication of numbers or missing of any important information. The people involved in this process include technical content writers, research heads and graphics people. Once this process is completed the title gets uploader on our platform for our clients to read it.
Step 5: Final QC/QA Process:
This is the last process and comes when the client has ordered the study. In this process a final QA/QC is done before the study is emailed to the client. Since we believe in giving our clients a good experience of our research studies, therefore, to make sure that we do not lack at our end in any way humanly possible we do a final round of quality check and then dispatch the study to the client.
Key Segments:
By Component
Solution
Real-Time Location System (RTLS)
Barcode
Mobile Computer
Labels
Global Positioning System (GPS)
Others
Service
Strategic Asset Management
Operational Asset Management
Tactical Asset Management
By Asset Type
Digital Assets
Returnable Transport Assets
In-transit Assets
Manufacturing Assets
Personnel/ Staff
By Function
Location & Movement Tracking
Check In/ Check Out
Repair and Maintenance
Others
By Application
Infrastructure Asset Management
Transportation
Energy Infrastructure
Water & Waste Infrastructure
Critical Infrastructure
Others
Enterprise Asset Management
Healthcare Asset Management
Aviation Asset Management
Others
Request for Segment Customization as per your Business Requirement: Segment Customization Request
Regional Coverage:
North America
US
Canada
Mexico
Europe
Eastern Europe
Poland
Romania
Hungary
Turkey
Rest of Eastern Europe
Western Europe
Germany
France
UK
Italy
Spain
Netherlands
Switzerland
Austria
Rest of Western Europe
Asia Pacific
China
India
Japan
South Korea
Vietnam
Singapore
Australia
Rest of Asia Pacific
Middle East & Africa
Middle East
UAE
Egypt
Saudi Arabia
Qatar
Rest of Middle East
Africa
Nigeria
South Africa
Rest of Africa
Latin America
Brazil
Argentina
Colombia
Rest of Latin America
Request for Country Level Research Report: Country Level Customization Request
Available Customization
With the given market data, SNS Insider offers customization as per the company’s specific needs. The following customization options are available for the report:
Detailed Volume Analysis
Criss-Cross segment analysis (e.g. Product X Application)
Competitive Product Benchmarking
Geographic Analysis
Additional countries in any of the regions
Customized Data Representation
Detailed analysis and profiling of additional market players
Digital Twin Market Size was valued at USD 16.2 Billion in 2023 and is expected to reach USD 287.2 Billion by 2032, growing at a CAGR of 37.7 % over the forecast period 2024-2032.
The Web Application Firewall Market was valued at USD 6.6 Billion in 2023 and is expected to reach USD 31.9 Billion by 2032, growing at a CAGR of 19.21% from 2024-2032.
The Video Conferencing Systems Market was valued at USD 13.51 billion in 2023 and is expected to reach USD 66.13 billion by 2032, growing at a remarkable CAGR of 19.30% during the forecast period of 2024-2032.
5G Tester Market was valued at USD 3.45 billion in 2023 and is expected to reach USD 7.05 billion by 2032, growing at a CAGR of 8.29% from 2024-2032.
The Casino Management system Market size was valued at USD 7.7 Billion in 2023 and will grow to USD 29.09 Billion and CAGR of 15.8% by 2032.
The Content Services Platforms Market, valued at USD 61.9 Bn in 2023, is projected to reach USD 228.2 Bn by 2032, growing at a 15.61% CAGR from 2024 to 2032.
Hi! Click one of our member below to chat on Phone