Get More Information on Asia Pacific Global Capability Centers (GCCs) Market - Request Sample Report
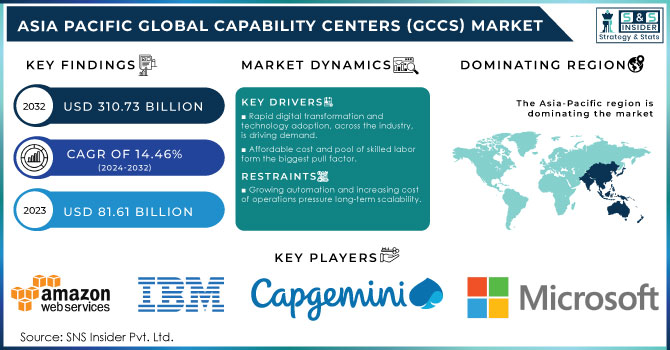
The Asia Pacific Global Capability Centers (GCCs) Market Size was valued at USD 81.61 Billion in 2023 and is expected to reach USD 310.73 Billion by 2032 and grow at a CAGR of 14.46% over the forecast period 2024-2032.
Global Capability Centres have become an important driver in the scaling up of operations and efficiency for multinational corporations with access to global talent. For instance, India boasts of more than 1,700 GCCs, 50% share of the world market, and a total of more than 1.9 million under its employment. Engineering, Research, and Development (ER&D) comprises 42% of GCC employment and stands as a robust talent pool for India, pushing its growth.
Government policies of countries in Asia Pacific also promote the development of GCCs. In India, such centers are attracted toward the regimes of Digital India and Make in India. Thailand 4.0 focuses on transforming the country toward becoming an innovation-driven economy, and Malaysia focuses on becoming a leading digital hub in Southeast Asia through its Malaysia’s Digital Economy Blueprint. Singapore stays competitive with the Smart Nation vision, promoting technological adoption in finance and IT sectors.
Emerging technologies like Blockchain, AI, and 5G also hold promise in the future, as GCCs are expected to play a crucial role in inducting these solutions into business processes. For instance, HCLTech launched its “Metafinity” platform in 2023, which supports businesses entering the metaverse. This aligns with India’s shift towards more advanced digital capabilities. Already in demand are high-end ER&D and data analytics services, and this is bound to facilitate market growth in the near future.
KEY DRIVERS:
Rapid digital transformation and technology adoption, across the industry, is driving demand.
Digital transformation has become the top imperative for companies, particularly those in industries like IT, finance, and healthcare, that need to integrate data in real time and conduct global operations. The intensifying demands for digital services such as cloud computing, AI, and cybersecurity have led to an increase in GCCs through companies in the Asia Pacific region interested in leveraging growing technological capabilities within the region. For example, the Philippines and Vietnam have experienced sharp growth in demand for IT Outsourcing and Business Process Management Services due to huge pools of technology-skilled laborers. Companies are increasingly opting for these locations to scale up their global operations and enhance business continuity through advanced technological infrastructure.
Affordable cost and pool of skilled labor form the biggest pull factor.
Asia Pacific countries, particularly India, the Philippines, and Malaysia, offer competitive advantages, with a very skilled and affordable labor force compared to Western markets. At about 1.5 million engineering graduates annually, India has become a global magnet for tech talent and a prime destination for foreign companies that are willing to set up shared services centers. The demand and supply gap in India's tech talent is the lowest, at 21.1%, among the top tech countries, including the US, China and the UK and GCCs are taking notice. Of more than 1,700 GCCs in the country, nearly 78% have set up here to add on or create a better talent pool. This trend repeats in other regional hubs wherein experts in IT and engineering sectors continue to drive growth in GCCs. Companies are using these sources to maintain operational efficiencies and keep pace with global competition.
RESTRAIN:
Growing automation and increasing cost of operations pressure long-term scalability.
Indeed, while adoption of automation will improve operational efficiencies, it will still prove to be a challenge for the GCC market. As Artificial Intelligence and Machine Learning are growing more sophisticated, companies are automating systems with little or no human interaction. Rising operational costs, especially in previously viewed 'low cost' locations, such as India and the Philippines, may force companies to seek alternative sites or optimize operations to balance their costs.
The adoption of AI, cloud computing, and automation is making it more efficient while reducing operational costs. A survey suggests that 40% of the enterprises worldwide report their intention to reduce staff levels through automation. Similarly, 24% of these respondents intend to move their GCCs to less expensive regions. As companies have to balance the advantages of automation against the maintenance costs of global operations through GCCs, this restriction will pose an obstruction to any growth in the future.
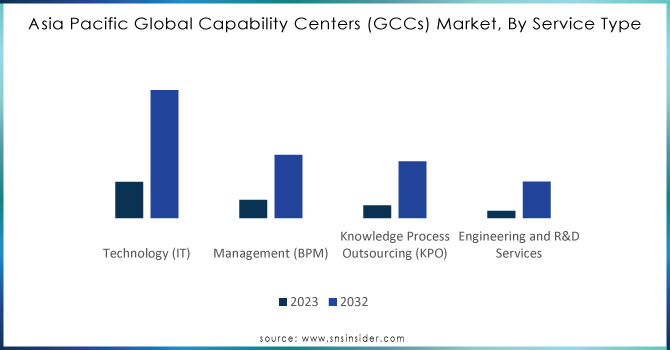
BY INDUSTRY VERTICAL
In 2023, IT sector dominated the market with 48.59% of the overall share; this can be attributed to the high demand for global IT outsourcing, software development, and digital transformation services. GCCs are now essential for the management of global IT infrastructures, software development, and cybersecurity solutions, especially in countries like India and Singapore.
According to a report, freshers can expect to see a 40% growth in hiring by GCCs compared with last year and the IT services companies project a 20-25% growth in recruitment. Significant demand for skills in software development, cloud technologies, and data engineering continues to drive these numbers.
ER&D Services is yet another fast-growing segment and is expected to grow at the fastest pace during the forecast period 2024-2032, with a projected CAGR of 17.89%. ER&D services are centered on innovation, design, product development, and research initiatives that deliver high-value solutions in industries as diverse as automotive, aerospace, healthcare, and manufacturing. The growth is driven by the rising demand for specialized engineering talent and the need for companies to innovate and respond efficiently to technological changes. India and Vietnam will also increasingly emerge as significant ER&D hubs in the coming years with major investments from global firms wanting to set up or expand R&D capabilities in the region.
Need Any Customization Research On Asia Pacific Global Capability Centers (GCCs) Market - Inquiry Now
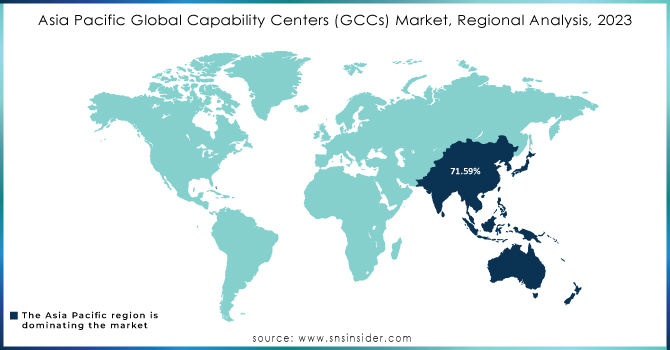
India dominated the Asia Pacific GCC market in 2023; the country led with 71.59% market share. It is the world's largest hub for GCC operations, specifically for IT and ER&D, because of its large talent pool, state-of-the-art infrastructure, and pro-government policies like “Digital India” and “Make in India” that attract multinational corporations to the country. India is also expected to maintain this position because of the growing share of ER&D services within the country. For instance, 42% of the GCC workforce present in Bengaluru, India is working in ER&D.
On the contrary, Vietnam is likely to grow at the highest rate, in the forecast period from 2024 till 2032. The growth herein is stimulated by the growing significance of Vietnam as a manufacturing and IT outsourcing hub, government policies, and competitive labor costs.
Some of the major players in the Asia Pacific Global Capability Centers (GCCs) Market are
Microsoft (Cloud Computing, Software Development)
Amazon Web Services (AWS) (Cloud Infrastructure, Data Centers)
Google (Search Engine Services, Cloud Solutions)
Cognizant (IT Consulting, Business Process Outsourcing)
Accenture (Digital Transformation, Technology Consulting)
IBM (Cloud Services, AI & Cognitive Solutions)
Infosys (IT Services, Business Process Management)
Tata Consultancy Services (TCS) (Software Services, IT Consulting)
Wipro (Managed IT Services, Digital Consulting)
Deloitte (Consulting, Risk Advisory)
KPMG (Audit, Business Advisory)
Capgemini (IT Services, Outsourcing)
Goldman Sachs (Financial Services, Investment Banking)
HSBC (Banking, Wealth Management)
J.P. Morgan (Investment Banking, Financial Services)
Standard Chartered (Corporate Banking, Treasury Services)
Shell (Energy Solutions, Oil & Gas Exploration)
Schneider Electric (Energy Management, Automation Solutions)
Siemens (Engineering Solutions, Industrial Automation)
Philips (Medical Devices, Health Technology)
October 2024: NeoSOFT remains very actively engaged in the Indian GCC landscape with critical partnerships that help companies traverse complex regulations and provide highly secure and compliant services to a global clientele. Its strategic expertise in various facets of technology has set new standards for excellence in India.
September 2024: The Karnataka government, on Friday, released the draft of India's first ever Global Capability Centre policy. That has been envisioned as setting up 500 new GCCs by 2029, contributing hugely to the state's economy and creating 3.5 lakh jobs, the Karnataka government said. The draft policy is now open for public comments and the government has invited inputs to refine and strengthen the policy.
| Report Attributes | Details |
|---|---|
| Market Size in 2023 | US$ 81.61 Billion |
| Market Size by 2032 | US$ 310.73 Billion |
| CAGR | CAGR of 14.46 % From 2024 to 2032 |
| Base Year | 2023 |
| Forecast Period | 2024-2032 |
| Historical Data | 2020-2022 |
| Report Scope & Coverage | Market Size, Segments Analysis, Competitive Landscape, Regional Analysis, DROC & SWOT Analysis, Forecast Outlook |
| Key Segments | • By Service Type (Information Technology (IT) Services, Business Process Management (BPM), Knowledge Process Outsourcing (KPO), Engineering and R&D Services) • By Industry Vertical (Banking, Financial Services, and Insurance (BFSI), Healthcare and Life Sciences, Retail and Consumer Goods, Manufacturing and Automotive, Telecom & IT) • By Organization Size (Large Enterprises, Small and Medium Enterprises (SMEs)) |
| Regional Analysis/Coverage | Asia Pacific (China, India, Japan, South Korea, Vietnam, Singapore, Australia, Rest of Asia Pacific) |
| Company Profiles | Microsoft, Amazon Web Services (AWS), Google, Cognizant, Accenture, IBM, Infosys, Tata Consultancy Services (TCS), Wipro, Deloitte, KPMG, Capgemini, Goldman Sachs, HSBC, J.P. Morgan, Standard Chartered, Shell, Schneider Electric, Siemens, Philips. |
| Key Drivers | • Rapid digital transformation and technology adoption, across the industry, is driving demand. • Affordable cost and pool of skilled labor form the biggest pull factor. |
| Restraints | • Growing automation and increasing cost of operations pressure long-term scalability. |
Ans: The Asia Pacific Global Capability Centers (GCCs) Market is expected to grow at a CAGR of 14.46% during 2024-2032.
Ans: Asia Pacific Global Capability Centers (GCCs) Market size was USD 81.61 Billion in 2023 and is expected to Reach USD 310.73 Billion by 2032.
Ans: The major growth factors of the Asia Pacific Global Capability Centers (GCCs) Market are Rapid Digital Transformation & Technology Adoption and Affordable Cost & Pool of Skilled Labors.
Ans: The IT Services dominated the Asia Pacific Global Capability Centers (GCCs) Market.
Ans: India dominated the Asia Pacific Global Capability Centers (GCCs) Market in 2023.
TABLE OF CONTENT
1. Introduction
1.1 Market Definition
1.2 Scope (Inclusion and Exclusions)
1.3 Research Assumptions
2. Executive Summary
2.1 Market Overview
2.2 Regional Synopsis
2.3 Competitive Summary
3. Research Methodology
3.1 Top-Down Approach
3.2 Bottom-up Approach
3.3. Data Validation
3.4 Primary Interviews
4. Market Dynamics Impact Analysis
4.1 Market Driving Factors Analysis
4.1.1 Drivers
4.1.2 Restraints
4.1.3 Opportunities
4.1.4 Challenges
4.2 PESTLE Analysis
4.3 Porter’s Five Forces Model
5. Statistical Insights and Trends Reporting
5.1 Foreign Direct Investment (FDI) Trends, By Industry (2023)
5.2 Workforce and Talent Pool
5.3 Industry-Specific Data for GCC
5.4 Infrastructure and Business Environment
6. Competitive Landscape
6.1 List of Major Companies, By Region
6.2 Market Share Analysis, By Region
6.3 Product Benchmarking
6.3.1 Product specifications and features
6.3.2 Pricing
6.4 Strategic Initiatives
6.4.1 Marketing and promotional activities
6.4.2 Distribution and Supply Chain Strategies
6.4.3 Expansion plans and new product launches
6.4.4 Strategic partnerships and collaborations
6.5 Technological Advancements
6.6 Market Positioning and Branding
7. Asia Pacific Global Capability Centers (GCCs) Market Segmentation, By Service Type
7.1 Chapter Overview
7.2 Information Technology (IT) Services
7.2.1 Information Technology (IT) Services Market Trends Analysis (2020-2032)
7.2.2 Information Technology (IT) Services Market Size Estimates and Forecasts to 2032 (USD Billion)
7.3 Business Process Management (BPM)
7.3.1 Business Process Management (BPM) Market Trends Analysis (2020-2032)
7.3.2 Business Process Management (BPM) Market Size Estimates and Forecasts to 2032 (USD Billion)
7.4 Knowledge Process Outsourcing (KPO)
7.4.1 Knowledge Process Outsourcing (KPO) Market Trends Analysis (2020-2032)
7.4.2 Knowledge Process Outsourcing (KPO) Market Size Estimates and Forecasts to 2032 (USD Billion)
7.5 Engineering and R&D Services
7.5.1 Engineering and R&D Services Market Trends Analysis (2020-2032)
7.5.2 Engineering and R&D Services Market Size Estimates and Forecasts to 2032 (USD Billion)
8. Asia Pacific Global Capability Centers (GCCs) Market Segmentation, By Industry Vertical
8.1 Chapter Overview
8.2 Banking, Financial Services, and Insurance (BFSI)
8.2.1 Banking, Financial Services, and Insurance (BFSI) Market Trends Analysis (2020-2032)
8.2.2 Banking, Financial Services, and Insurance (BFSI) Market Size Estimates and Forecasts to 2032 (USD Billion)
8.3 Healthcare and Life Sciences
8.3.1 Healthcare and Life Sciences Market Trends Analysis (2020-2032)
8.3.2 Healthcare and Life Sciences Market Size Estimates and Forecasts to 2032 (USD Billion)
8.4 Retail and Consumer Goods
8.4.1 Retail and Consumer Goods Market Trends Analysis (2020-2032)
8.4.2 Retail and Consumer Goods Market Size Estimates and Forecasts to 2032 (USD Billion)
8.5 Manufacturing and Automotive
8.5.1 Manufacturing and Automotive Market Trends Analysis (2020-2032)
8.5.2 Manufacturing and Automotive Market Size Estimates and Forecasts to 2032 (USD Billion)
8.6 Telecom & IT
8.6.1 Telecom & IT Market Trends Analysis (2020-2032)
8.6.2 Telecom & IT Market Size Estimates and Forecasts to 2032 (USD Billion)
9. Asia Pacific Global Capability Centers (GCCs) Market Segmentation, By Organization Size
9.1 Chapter Overview
9.2 Large Enterprises
9.2.1 Large Enterprises Market Trends Analysis (2020-2032)
9.2.2 Large Enterprises Market Size Estimates and Forecasts to 2032 (USD Billion)
9.3 Small and Medium Enterprises (SMEs)
9.3.1 Small and Medium Enterprises (SMEs) Market Trends Analysis (2020-2032)
9.3.2 Small and Medium Enterprises (SMEs) Market Size Estimates and Forecasts to 2032 (USD Billion)
10. Regional Analysis
10.1 Chapter Overview
10.2 Asia Pacific
10.2.1 Trends Analysis
10.2.2 Asia Pacific Asia Pacific Global Capability Centers (GCCs) Market Estimates and Forecasts, by Country (2020-2032) (USD Billion)
10.2.3 Asia Pacific Asia Pacific Global Capability Centers (GCCs) Market Estimates and Forecasts, By Service Type (2020-2032) (USD Billion)
10.2.4 Asia Pacific Asia Pacific Global Capability Centers (GCCs) Market Estimates and Forecasts, By Industry Vertical (2020-2032) (USD Billion)
10.2.5 Asia Pacific Asia Pacific Global Capability Centers (GCCs) Market Estimates and Forecasts, By Organization Size (2020-2032) (USD Billion)
10.2.6 China
10.2.6.1 China Asia Pacific Global Capability Centers (GCCs) Market Estimates and Forecasts, By Service Type (2020-2032) (USD Billion)
10.2.6.2 China Asia Pacific Global Capability Centers (GCCs) Market Estimates and Forecasts, By Industry Vertical (2020-2032) (USD Billion)
10.2.6.3 China Asia Pacific Global Capability Centers (GCCs) Market Estimates and Forecasts, By Organization Size (2020-2032) (USD Billion)
10.2.7 India
10.2.7.1 India Asia Pacific Global Capability Centers (GCCs) Market Estimates and Forecasts, By Service Type (2020-2032) (USD Billion)
10.2.7.2 India Asia Pacific Global Capability Centers (GCCs) Market Estimates and Forecasts, By Industry Vertical (2020-2032) (USD Billion)
10.2.7.3 India Asia Pacific Global Capability Centers (GCCs) Market Estimates and Forecasts, By Organization Size (2020-2032) (USD Billion)
10.2.8 Japan
10.2.8.1 Japan Asia Pacific Global Capability Centers (GCCs) Market Estimates and Forecasts, By Service Type (2020-2032) (USD Billion)
10.2.8.2 Japan Asia Pacific Global Capability Centers (GCCs) Market Estimates and Forecasts, By Industry Vertical (2020-2032) (USD Billion)
10.2.8.3 Japan Asia Pacific Global Capability Centers (GCCs) Market Estimates and Forecasts, By Organization Size (2020-2032) (USD Billion)
10.2.9 South Korea
10.2.9.1 South Korea Asia Pacific Global Capability Centers (GCCs) Market Estimates and Forecasts, By Service Type (2020-2032) (USD Billion)
10.2.9.2 South Korea Asia Pacific Global Capability Centers (GCCs) Market Estimates and Forecasts, By Industry Vertical (2020-2032) (USD Billion)
10.2.9.3 South Korea Asia Pacific Global Capability Centers (GCCs) Market Estimates and Forecasts, By Organization Size (2020-2032) (USD Billion)
10.2.10 Vietnam
10.2.10.1 Vietnam Asia Pacific Global Capability Centers (GCCs) Market Estimates and Forecasts, By Service Type (2020-2032) (USD Billion)
10.2.10.2 Vietnam Asia Pacific Global Capability Centers (GCCs) Market Estimates and Forecasts, By Industry Vertical (2020-2032) (USD Billion)
10.2.10.3 Vietnam Asia Pacific Global Capability Centers (GCCs) Market Estimates and Forecasts, By Organization Size (2020-2032) (USD Billion)
10.2.11 Singapore
10.2.11.1 Singapore Asia Pacific Global Capability Centers (GCCs) Market Estimates and Forecasts, By Service Type (2020-2032) (USD Billion)
10.2.11.2 Singapore Asia Pacific Global Capability Centers (GCCs) Market Estimates and Forecasts, By Industry Vertical (2020-2032) (USD Billion)
10.2.11.3 Singapore Asia Pacific Global Capability Centers (GCCs) Market Estimates and Forecasts, By Organization Size (2020-2032) (USD Billion)
10.2.12 Australia
10.2.12.1 Australia Asia Pacific Global Capability Centers (GCCs) Market Estimates and Forecasts, By Service Type (2020-2032) (USD Billion)
10.2.12.2 Australia Asia Pacific Global Capability Centers (GCCs) Market Estimates and Forecasts, By Industry Vertical (2020-2032) (USD Billion)
10.2.12.3 Australia Asia Pacific Global Capability Centers (GCCs) Market Estimates and Forecasts, By Organization Size (2020-2032) (USD Billion)
10.2.13 Rest of Asia Pacific
10.2.13.1 Rest of Asia Pacific Asia Pacific Global Capability Centers (GCCs) Market Estimates and Forecasts, By Service Type (2020-2032) (USD Billion)
10.2.13.2 Rest of Asia Pacific Asia Pacific Global Capability Centers (GCCs) Market Estimates and Forecasts, By Industry Vertical (2020-2032) (USD Billion)
10.2.13.3 Rest of Asia Pacific Asia Pacific Global Capability Centers (GCCs) Market Estimates and Forecasts, By Organization Size (2020-2032) (USD Billion)
11. Company Profiles
11.1 Microsoft
11.1.1 Company Overview
11.1.2 Financial
11.1.3 Products/ Services Offered
11.1.4 SWOT Analysis
11.2 Amazon Web Services (AWS)
11.2.1 Company Overview
11.2.2 Financial
11.2.3 Products/ Services Offered
11.2.4 SWOT Analysis
11.3 Google
11.3.1 Company Overview
11.3.2 Financial
11.3.3 Products/ Services Offered
11.3.4 SWOT Analysis
11.4 Cognizant
11.4.1 Company Overview
11.4.2 Financial
11.4.3 Products/ Services Offered
11.4.4 SWOT Analysis
11.5 Accenture
11.5.1 Company Overview
11.5.2 Financial
11.5.3 Products/ Services Offered
11.5.4 SWOT Analysis
11.6 IBM
11.6.1 Company Overview
11.6.2 Financial
11.6.3 Products/ Services Offered
11.6.4 SWOT Analysis
11.7 Infosys
11.7.1 Company Overview
11.7.2 Financial
11.7.3 Products/ Services Offered
11.7.4 SWOT Analysis
11.8 Tata Consultancy Services (TCS)
11.8.1 Company Overview
11.8.2 Financial
11.8.3 Products/ Services Offered
11.8.4 SWOT Analysis
11.9 Wipro
11.9.1 Company Overview
11.9.2 Financial
11.9.3 Products/ Services Offered
11.9.4 SWOT Analysis
11.10 Deloitte
11.10.1 Company Overview
11.10.2 Financial
11.10.3 Products/ Services Offered
11.10.4 SWOT Analysis
12. Use Cases and Best Practices
13. Conclusion
An accurate research report requires proper strategizing as well as implementation. There are multiple factors involved in the completion of good and accurate research report and selecting the best methodology to compete the research is the toughest part. Since the research reports we provide play a crucial role in any company’s decision-making process, therefore we at SNS Insider always believe that we should choose the best method which gives us results closer to reality. This allows us to reach at a stage wherein we can provide our clients best and accurate investment to output ratio.
Each report that we prepare takes a timeframe of 350-400 business hours for production. Starting from the selection of titles through a couple of in-depth brain storming session to the final QC process before uploading our titles on our website we dedicate around 350 working hours. The titles are selected based on their current market cap and the foreseen CAGR and growth.
The 5 steps process:
Step 1: Secondary Research:
Secondary Research or Desk Research is as the name suggests is a research process wherein, we collect data through the readily available information. In this process we use various paid and unpaid databases which our team has access to and gather data through the same. This includes examining of listed companies’ annual reports, Journals, SEC filling etc. Apart from this our team has access to various associations across the globe across different industries. Lastly, we have exchange relationships with various university as well as individual libraries.

Step 2: Primary Research
When we talk about primary research, it is a type of study in which the researchers collect relevant data samples directly, rather than relying on previously collected data. This type of research is focused on gaining content specific facts that can be sued to solve specific problems. Since the collected data is fresh and first hand therefore it makes the study more accurate and genuine.
We at SNS Insider have divided Primary Research into 2 parts.
Part 1 wherein we interview the KOLs of major players as well as the upcoming ones across various geographic regions. This allows us to have their view over the market scenario and acts as an important tool to come closer to the accurate market numbers. As many as 45 paid and unpaid primary interviews are taken from both the demand and supply side of the industry to make sure we land at an accurate judgement and analysis of the market.
This step involves the triangulation of data wherein our team analyses the interview transcripts, online survey responses and observation of on filed participants. The below mentioned chart should give a better understanding of the part 1 of the primary interview.

Part 2: In this part of primary research the data collected via secondary research and the part 1 of the primary research is validated with the interviews from individual consultants and subject matter experts.
Consultants are those set of people who have at least 12 years of experience and expertise within the industry whereas Subject Matter Experts are those with at least 15 years of experience behind their back within the same space. The data with the help of two main processes i.e., FGDs (Focused Group Discussions) and IDs (Individual Discussions). This gives us a 3rd party nonbiased primary view of the market scenario making it a more dependable one while collation of the data pointers.
Step 3: Data Bank Validation
Once all the information is collected via primary and secondary sources, we run that information for data validation. At our intelligence centre our research heads track a lot of information related to the market which includes the quarterly reports, the daily stock prices, and other relevant information. Our data bank server gets updated every fortnight and that is how the information which we collected using our primary and secondary information is revalidated in real time.

Step 4: QA/QC Process
After all the data collection and validation our team does a final level of quality check and quality assurance to get rid of any unwanted or undesired mistakes. This might include but not limited to getting rid of the any typos, duplication of numbers or missing of any important information. The people involved in this process include technical content writers, research heads and graphics people. Once this process is completed the title gets uploader on our platform for our clients to read it.
Step 5: Final QC/QA Process:
This is the last process and comes when the client has ordered the study. In this process a final QA/QC is done before the study is emailed to the client. Since we believe in giving our clients a good experience of our research studies, therefore, to make sure that we do not lack at our end in any way humanly possible we do a final round of quality check and then dispatch the study to the client.
BY SERVICE TYPE
Information Technology (IT) Services
Business Process Management (BPM)
Knowledge Process Outsourcing (KPO)
Engineering and R&D Services
BY INDUSTRY VERTICAL
Banking, Financial Services, and Insurance (BFSI)
Healthcare and Life Sciences
Retail and Consumer Goods
Manufacturing and Automotive
Telecom & IT
BY ORGANIZATION SIZE
Large Enterprises
Small and Medium Enterprises (SMEs)
Request for Segment Customization as per your Business Requirement: Segment Customization Request
REGIONAL COVERAGE:
Asia Pacific
China
India
Japan
South Korea
Vietnam
Singapore
Australia
Rest of Asia Pacific
Request for Country Level Research Report: Country Level Customization Request
Available Customization
With the given market data, SNS Insider offers customization as per the company’s specific needs. The following customization options are available for the report:
Product Analysis
Criss-Cross segment analysis (e.g. Product X Application)
Product Matrix which gives a detailed comparison of product portfolio of each company
Geographic Analysis
Additional countries in any of the regions
Company Information
Detailed analysis and profiling of additional market players (Up to five)
The Privacy Management Software Market size was valued at USD 3.9 Billion in 2023 and will grow to USD 68.2 Billion by 2032 and grow at a CAGR of 37.4% by 2032.
Virtual Reality In Gaming Market was valued at USD 26.39 billion in 2023 and will reach USD 212.46 billion by 2032, growing at a CAGR of 26.17% by 2032.
The Commerce Cloud Market was valued at USD 21.0 Billion in 2023 and is expected to reach USD 138.3 Billion by 2032, growing at a CAGR of 23.35% from 2024-2032.
QR Code Payments Market was valued at USD 11.8 billion in 2023 and is expected to reach USD 45.9 billion by 2032, growing at a CAGR of 16.27% over 2024-2032.
Business Email Compromise Market was valued at USD 1.35 billion in 2023 and is expected to reach USD 7.24 billion by 2032, growing at a CAGR of 20.53% from 2024-2032.
Connected Worker Market was valued at USD 5.65 billion in 2023 and is expected to reach USD 43.34 billion by 2032, growing at a CAGR of 25.42% over 2024-2032.

Hi! Click one of our member below to chat on Phone
© 2025 All Rights Reserved by SNS Insider Pvt Ltd


