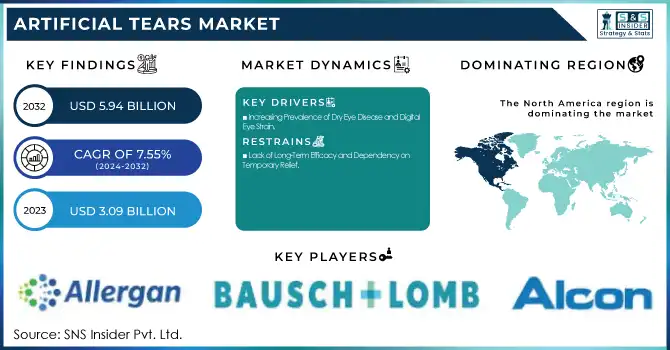
The Artificial Tears Market size was USD 3.09 Billion in 2023 and is expected to reach USD 5.94 Billion by 2032 and grow at a CAGR of 7.55% over the forecast period of 2024-2032. This study discusses prescription and OTC trends with the rise in demand for convenient eye care remedies amid rising dry eye condition awareness. Trends and innovations in products are explained in terms of the introduction of novel formulations and the inclusion of high-end ingredients designed to enhance extended relief and comfort. Consumer awareness and purchasing behavior trends show an increasing move towards convenience products, specifically highlighting preservative-free and eco-friendly products. The report also factors in the role of digitalization and screen use, where the increased screen use leads to a rise in digital eye strain incidents, thereby driving the demand for artificial tear products.
Get More Information on Artificial Tears Market - Request Sample Report
Drivers
Increasing Prevalence of Dry Eye Disease and Digital Eye Strain.
The increasing incidence of dry eye disease, especially because of lifestyle factors, is a major growth driver for the artificial tears market. Approximately 16 million Americans have dry eye disease, and more cases are being diagnosed every year worldwide. Contributing factors like increased screen time, aging populations, and environmental toxins worsen the condition. Digital eye strain, or "computer vision syndrome," has resulted in increased use of artificial tears as individuals spend more and more hours on digital devices. In a 2022 study, more than 60% of the global workforce indicated symptoms of eye strain related to the overuse of screens. Moreover, increased awareness of dry eye disease, fueled by medical campaigns and ease of access to treatment products, has encouraged consumers to opt for artificial tear solutions. Increased use of preservative-free and natural products, and the rise in self-medication, have further contributed to the growth of the market, particularly for over-the-counter (OTC) solutions.
Restraints
Lack of Long-Term Efficacy and Dependency on Temporary Relief.
Although artificial tears are a temporary solution for dry eye disease, they do not treat the underlying causes of the condition, like inflammation or meibomian gland dysfunction. This reliance on symptomatic relief over curative interventions has resulted in skepticism regarding their long-term efficacy. In a study appearing in the Journal of Ophthalmology, approximately 40% of patients claim that artificial tears do not yield long-term relief, and they are not satisfied. Additionally, excessive use of preservatives in certain products causes ocular toxicity and irritation. This problem creates a dilemma for the formulation of long-term treatments and has caused many patients to turn to alternative options, like punctal plugs or anti-inflammatory medications. The inability to devise a universally satisfactory remedy restricts the total market potential of artificial tears, causing companies to face the challenge of consistent customer retention.
Opportunities
Technological Advancements in Formulations and Natural Alternatives.
There is a high potential for innovation in the artificial tears market based on developments in product formulation and technology. The introduction of preservative-free and longer-duration eye drops has generated consumer interest. The demand for preservative-free artificial tears has increased by 25% over the past five years, as per a report. In addition, advances like liposomal-based artificial tears, which simulate the natural lipid layer of the eye, present the possibility for more efficient and longer-lasting products. In addition, with a move toward organic and natural products, there is the potential to bring plant-derived and bioengineered products into the market. Products containing ingredients such as hyaluronic acid and aloe vera are becoming more in demand, answering the increasing interest in "clean label" solutions. The growing emphasis on sustainability also opens up the opportunity for businesses to launch green packaging and manufacturing methods. Businesses riding these waves can cater to consumer needs and expand market share.
Challenges
High Cost of Innovative Formulations and Limited Access in Emerging Markets.
High-end products like liposomal-based or preservative-free artificial tears tend to be more expensive than conventional products, which may be a deterrent for price-conscious consumers, especially in developing countries. According to a World Health Organization (WHO) report, it was discovered that almost 40% of the population in low-income countries does not have access to basic medicines, including eye care products. In the emerging economies of India and Brazil, the penetration of sophisticated artificial tear products is sluggish because of high prices and low awareness about dry eye disease. Moreover, the increasing prevalence of spurious and substandard products in these markets further hinders the market. Regulatory barriers and distribution issues also restrict the availability of high-end eye care solutions. Breaking these barriers will involve reducing costs of production, raising awareness, and enhancing access to ensure innovative artificial tears can reach more consumers across the world.
By Type
In 2023, the Glycerin segment captured the largest market share in the Artificial Tears Market with 35% of total market revenue. Artificial tears based on glycerin are most popular because they have excellent moisture retention and long-term hydration, which is required to relieve dry eye symptoms. Glycerin is a humectant that attracts water towards the eye to retain moisture and avoid irritation. This makes it a good and popular ingredient in artificial tear preparations, especially for those who have moderate to severe dry eye discomfort. The increased demand for preservative-free, safe, and moisturizing products has played a major role in glycerin's market supremacy. Moreover, its efficacy in treating dry eye syndrome as well as giving temporary relief from irritation due to environmental factors has rendered glycerin-based products the most popular choice among consumers. With increasing demand for treatments for diseases such as digital eye strain, worsened by excessive screen time, the demand for effective, moisture-holding products is anticipated to propel persistent growth in the glycerin segment. With improvements in product composition and growing awareness among consumers about its advantages, the Glycerin segment will continue to lead the market during the forecast period.
By Delivery Mode
The Eye Drops category led the way in 2023 with a commanding 45% market share. Eye drops represent the most convenient and easiest form of artificial tear delivery. They are convenient, portable, and offer fast relief to those who have dry eyes or computer eye strain. As awareness for eye care, particularly following the growth of screen time and environmental factors leading to eye strain, the market for eye drops has boomed in recent years. Their effectiveness in delivering instant moisture to the eyes is also the reason behind their popularity, particularly for individuals who suffer from sudden dry eye irritation caused by reasons like air conditioning, pollution, or excessive reading and screen use. Additionally, improvements in eye drop formulations, including preservative-free products and those with extended relief action, have consolidated their market leadership. In the future, the Eye Drops segment will be the most rapidly growing category in the market, as it is fueled by growing awareness of dry eye disorders, digital eye fatigue, and the ease of over-the-counter medications. With more individuals acknowledging the advantages of eye drops in maintaining their eye health, the segment is likely to grow during the forecast period.
By Application
The Dry Eye Syndrome segment of the market was leading in 2023, with 53.2% of the overall market share. Dry Eye Syndrome is among the most common eye diseases in the world, with millions of patients suffering from it owing to different reasons like aging, external conditions, and long-duration screen exposure. Increased usage of digital devices has caused the incidence of digital eye strain, which is one of the primary causes of dry eye symptoms. As individuals are glued to computers, smartphones, and other electronic gadgets, blinking occurs less often, causing improper lubrication and wetness on the surface of the eye. Dry eye comfort has become the priority for many consumers because of this. The Dry Eye Syndrome segment is likely to maintain its leadership because of the increasing awareness of the condition and the rising availability of over-the-counter and prescription products. In addition, improvements in eye care products, including preservative-free artificial tears and advances in eye drops, have assisted in addressing the varied needs of patients with dry eye syndrome. This category is expected to continue as the most rapidly growing area of application for artificial tears, as more individuals look for relief from the discomfort of dry eyes, especially following contemporary digital lifestyles and environmental causes.
By Distribution Channel
Hospital Pharmacies held a 40% market share in the artificial tears market in 2023. Hospital pharmacies are also very important for the distribution of prescription eye care products like artificial tears, particularly for patients who are struggling with severe or chronic eye problems like dry eye syndrome, glaucoma, or post-surgery recovery. Such pharmacies are staffed with the know-how to dispense specialized eye care products that are usually prescribed by ophthalmologists or other medical practitioners. Hospital pharmacies have a more customized service, with patients being treated with the proper medication for their individual needs. Additionally, they tend to offer useful advice to consumers on the proper use of eye drops or ointments, which leads to better treatment outcomes. As the market for artificial tears keeps developing, Online Pharmacies are surfacing as the most rapidly increasing distribution channel. The ease of buying products in the comfort of one's own home, and the convenience of being able to access a full line of artificial tear products by different brands, have made online pharmacies increasingly popular. As e-commerce grows globally, consumers are becoming increasingly more inclined to buy eye care products through online platforms, which is expected to drive segment growth over the forecast period.
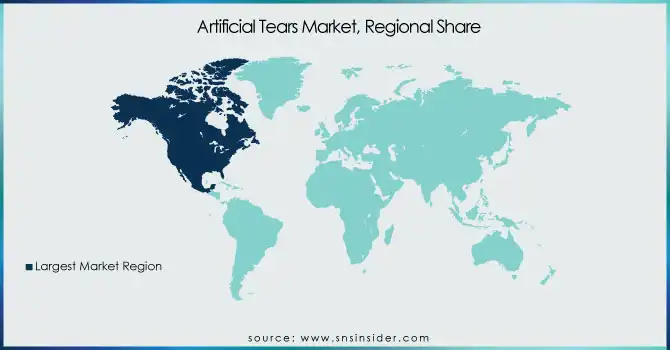
In 2023, the artificial tears market was dominated by North America due to strong consumer awareness of eye care and the widespread availability of prescription and over-the-counter artificial tear products. The region is supported by sophisticated healthcare infrastructure and a strong distribution network that involves hospital and retail pharmacies and online channels, providing easy access to a range of eye care solutions.
In Europe, the market is growing as a result of growing environmental and lifestyle factors that lead to dry eye conditions. There is a growing demand for preservative-free artificial tear formulations that mirror the increased demand for safer, more natural products. Germany, the UK, and France are at the forefront with a concentration on technological developments and better treatments for dry eye syndrome.
The Asia-Pacific market is projected to witness the fastest growth in the coming years, fueled by a fast-growing aging population, increased awareness of eye health, and growing digital eye strain. The major markets of Japan, China, and India are at the core of this growth. While in Latin America and the Middle East & Africa, the market is increasing steadily driven by enhancements in healthcare access and the increasing prevalence of dry eye conditions associated with environmental factors and lifestyle changes.
Need any customization research on Artificial Tears Market - Enquiry Now
Johnson and Johnson Vision Care - Blink Contacts, Blink Tears
Allergan plc - Refresh Tears, Refresh Optive
Alcon Plc - Systane Ultra, Systane Balance
Bausch & Lomb Incorporated - Renu, Bausch & Lomb Advanced Eye Relief
Santen, Inc - Thealoz Duo, Sante FX
URSAPHARM Arzneimittel GmbH - Thealoz, Artelac
ROHTO Pharmaceutical CO., LTD - Rohto Dry-Aid, Rohto Z!
Similasan Corporation - Similasan Dry Eye Relief
Ocusoft - Retaine MGD, Ocusoft Lid Scrub
Nicox - NCX 470
Abbott - Blink Gel Tears
LUMECARE - LumeCare Dry Eye Drops
Menicon - Menicon Tears
Thea Pharmaceuticals - Thealoz Duo
SEED Co. Ltd. - Seed Dry Eye Relief
Hikma Pharmaceuticals - Hikma Dry Eye Drops
In April 2023, Sun Pharmaceutical Industries Limited launched CEQUA, a novel treatment for Dry Eye Disease (DED) with inflammation in India. This is the first dry eye therapy in the country utilizing nano micellar (NCELL) technology, offering a new solution for patients suffering from this common condition.
| Report Attributes | Details |
|---|---|
|
Market Size in 2023 |
USD 3.09 billion |
|
Market Size by 2032 |
USD 5.94 billion |
|
CAGR |
CAGR of 7.55% From 2024 to 2032 |
|
Base Year |
2023 |
|
Forecast Period |
2024-2032 |
|
Historical Data |
2020-2022 |
|
Report Scope & Coverage |
Market Size, Segments Analysis, Competitive Landscape, Regional Analysis, DROC & SWOT Analysis, Forecast Outlook |
|
Key Segments |
• By Type [Polyethylene Glycol, Propylene Glycol, Cellulose, Glycerin, Others] |
|
Regional Analysis/Coverage |
North America (US, Canada, Mexico), Europe (Eastern Europe [Poland, Romania, Hungary, Turkey, Rest of Eastern Europe] Western Europe] Germany, France, UK, Italy, Spain, Netherlands, Switzerland, Austria, Rest of Western Europe]), Asia Pacific (China, India, Japan, South Korea, Vietnam, Singapore, Australia, Rest of Asia Pacific), Middle East & Africa (Middle East [UAE, Egypt, Saudi Arabia, Qatar, Rest of Middle East], Africa [Nigeria, South Africa, Rest of Africa], Latin America (Brazil, Argentina, Colombia, Rest of Latin America) |
|
Company Profiles |
Johnson and Johnson Vision Care, Allergan plc, Alcon Plc, Bausch & Lomb Incorporated, Santen, Inc, URSAPHARM Arzneimittel GmbH, ROHTO Pharmaceutical CO., LTD, Similasan Corporation, Ocusoft, Nicox, Abbott, LUMECARE, Menicon, Thea Pharmaceuticals, SEED Co. Ltd., Hikma Pharmaceuticals. |
Ans: The Artificial Tears market is projected to grow at a CAGR of 7.55% during the forecast period.
Ans: By 2032, the Artificial Tears market is expected to reach USD 5.94 billion, up from USD 3.09 billion in 2023.
Ans: The increasing incidence of dry eye disease, especially because of lifestyle factors, is a major growth driver for the artificial tears market.
Ans: Lack of Long-Term Efficacy and Dependency on Temporary Relief hinder market growth.
Ans: North America is the dominant region in the Artificial Tears market.
1. Introduction
1.1 Market Definition
1.2 Scope (Inclusion and Exclusions)
1.3 Research Assumptions
2. Executive Summary
2.1 Market Overview
2.2 Regional Synopsis
2.3 Competitive Summary
3. Research Methodology
3.1 Top-Down Approach
3.2 Bottom-up Approach
3.3. Data Validation
3.4 Primary Interviews
4. Market Dynamics Impact Analysis
4.1 Market Driving Factors Analysis
4.1.1 Drivers
4.1.2 Restraints
4.1.3 Opportunities
4.1.4 Challenges
4.2 PESTLE Analysis
4.3 Porter’s Five Forces Model
5. Statistical Insights and Trends Reporting
5.1 Prescription and Over-the-Counter (OTC) Trends (2023)
5.2 Product Trends and Innovations (2023-2032)
5.3 Consumer Behavior and Awareness Trends (2023)
5.4 Impact of Digitalization and Screen Time (2023)
5.5 Technology and Research & Development (R&D) Trends (2023-2032)
6. Competitive Landscape
6.1 List of Major Companies, By Region
6.2 Market Share Analysis, By Region
6.3 Product Benchmarking
6.3.1 Product specifications and features
6.3.2 Pricing
6.4 Strategic Initiatives
6.4.1 Marketing and Promotional Activities
6.4.2 Distribution and Supply Chain Strategies
6.4.3 Expansion plans and new product launches
6.4.4 Strategic partnerships and collaborations
6.5 Technological Advancements
6.6 Market Positioning and Branding
7. Artificial Tears Market Segmentation, by Type
7.1 Chapter Overview
7.2 Polyethylene Glycol
7.2.1 Polyethylene Glycol Market Trends Analysis (2020-2032)
7.2.2 Polyethylene Glycol Market Size Estimates and Forecasts to 2032 (USD Billion)
7.3 Propylene Glycol
7.3.1 Propylene Glycol Market Trends Analysis (2020-2032)
7.3.2 Propylene Glycol Market Size Estimates and Forecasts to 2032 (USD Billion)
7.4 Cellulose
7.4.1 Cellulose Market Trends Analysis (2020-2032)
7.4.2 Cellulose Market Size Estimates and Forecasts to 2032 (USD Billion)
7.5 Glycerin
7.5.1 Glycerin Market Trends Analysis (2020-2032)
7.5.2 Glycerin Market Size Estimates and Forecasts to 2032 (USD Billion)
7.6 Others
7.6.1 Others Market Trends Analysis (2020-2032)
7.6.2 Others Market Size Estimates and Forecasts to 2032 (USD Billion)
8. Artificial Tears Market Segmentation, By Technology
8.1 Chapter Overview
8.2 Eye Drops
8.2.1 Eye Drops Market Trends Analysis (2020-2032)
8.2.2 Eye Drops Market Size Estimates and Forecasts to 2032 (USD Billion)
8.3 Ointments
8.3.1 Ointments Market Trends Analysis (2020-2032)
8.3.2 Ointments Market Size Estimates And Forecasts To 2032 (USD Billion)
8.4 Sprays
8.4.1 Sprays Market Trends Analysis (2020-2032)
8.4.2 Sprays Market Size Estimates And Forecasts To 2032 (USD Billion)
9. Artificial Tears Market Segmentation, by Application
9.1 Chapter Overview
9.2 Dry Eye Syndrome
9.2.1 Dry Eye Syndrome Market Trends Analysis (2020-2032)
9.2.2 Dry Eye Syndrome Market Size Estimates and Forecasts to 2032 (USD Billion)
9.3 Allergies And Infections
9.3.1 Allergies And Infections Market Trends Analysis (2020-2032)
9.3.2 Allergies And Infections Market Size Estimates and Forecasts to 2032 (USD Billion)
9.4 Others
9.4.1 Others Market Trends Analysis (2020-2032)
9.4.2 Others Market Size Estimates and Forecasts to 2032 (USD Billion)
10. Artificial Tears Market Segmentation, By Distribution Channel
10.1 Chapter Overview
10.2 Hospital Pharmacies
10.2.1 Hospital Pharmacies Market Trends Analysis (2020-2032)
10.2.2 Hospital Pharmacies Market Size Estimates and Forecasts to 2032 (USD Billion)
10.3 Drug Stores
10.3.1 Drug Stores Market Trends Analysis (2020-2032)
10.3.2 Drug Stores Market Size Estimates and Forecasts to 2032 (USD Billion)
10.4 Retail Pharmacies
10.4.1 Retail Pharmacies Market Trends Analysis (2020-2032)
10.4.2 Retail Pharmacies Market Size Estimates and Forecasts to 2032 (USD Billion)
10.5 Online Pharmacies
10.5.1 Online Pharmacies Market Trends Analysis (2020-2032)
10.5.2 Online Pharmacies Market Size Estimates and Forecasts to 2032 (USD Billion)
11. Regional Analysis
11.1 Chapter Overview
11.2 North America
11.2.1 Trends Analysis
11.2.2 North America Artificial Tears Market Estimates and Forecasts, by Country (2020-2032) (USD Billion)
11.2.3 North America Artificial Tears Market Estimates and Forecasts, by Type (2020-2032) (USD Billion)
11.2.4 North America Artificial Tears Market Estimates and Forecasts, By Technology (2020-2032) (USD Billion)
11.2.5 North America Artificial Tears Market Estimates and Forecasts, by Application (2020-2032) (USD Billion)
11.2.6 North America Artificial Tears Market Estimates and Forecasts, By Distribution Channel (2020-2032) (USD Billion)
11.2.7 USA
11.2.7.1 USA Artificial Tears Market Estimates and Forecasts, by Type (2020-2032) (USD Billion)
11.2.7.2 USA Artificial Tears Market Estimates and Forecasts, By Technology (2020-2032) (USD Billion)
11.2.7.3 USA Artificial Tears Market Estimates and Forecasts, by Application (2020-2032) (USD Billion)
11.2.7.4 USA Artificial Tears Market Estimates and Forecasts, By Distribution Channel (2020-2032) (USD Billion)
11.2.8 Canada
11.2.8.1 Canada Artificial Tears Market Estimates and Forecasts, by Type (2020-2032) (USD Billion)
11.2.8.2 Canada Artificial Tears Market Estimates and Forecasts, By Technology (2020-2032) (USD Billion)
11.2.8.3 Canada Artificial Tears Market Estimates and Forecasts, by Application (2020-2032) (USD Billion)
11.2.8.4 Canada Artificial Tears Market Estimates and Forecasts, By Distribution Channel (2020-2032) (USD Billion)
11.2.9 Mexico
11.2.9.1 Mexico Artificial Tears Market Estimates and Forecasts, by Type (2020-2032) (USD Billion)
11.2.9.2 Mexico Artificial Tears Market Estimates and Forecasts, By Technology (2020-2032) (USD Billion)
11.2.9.3 Mexico Artificial Tears Market Estimates and Forecasts, by Application (2020-2032) (USD Billion)
11.2.9.4 Mexico Artificial Tears Market Estimates and Forecasts, By Distribution Channel (2020-2032) (USD Billion
11.3 Europe
11.3.1 Eastern Europe
11.3.1.1 Trends Analysis
11.3.1.2 Eastern Europe Artificial Tears Market Estimates and Forecasts, by Country (2020-2032) (USD Billion)
11.3.1.3 Eastern Europe Artificial Tears Market Estimates and Forecasts, by Type (2020-2032) (USD Billion)
11.3.1.4 Eastern Europe Artificial Tears Market Estimates and Forecasts, By Technology (2020-2032) (USD Billion)
11.3.1.5 Eastern Europe Artificial Tears Market Estimates and Forecasts, by Application (2020-2032) (USD Billion)
11.3.1.6 Eastern Europe Artificial Tears Market Estimates and Forecasts, By Distribution Channel (2020-2032) (USD Billion)
11.3.1.7 Poland
11.3.1.7.1 Poland Artificial Tears Market Estimates and Forecasts, by Type (2020-2032) (USD Billion)
11.3.1.7.2 Poland Artificial Tears Market Estimates and Forecasts, By Technology (2020-2032) (USD Billion)
11.3.1.7.3 Poland Artificial Tears Market Estimates and Forecasts, by Application (2020-2032) (USD Billion)
11.3.1.7.4 Poland Artificial Tears Market Estimates and Forecasts, By Distribution Channel (2020-2032) (USD Billion)
11.3.1.8 Romania
11.3.1.8.1 Romania Artificial Tears Market Estimates and Forecasts, by Type (2020-2032) (USD Billion)
11.3.1.8.2 Romania Artificial Tears Market Estimates and Forecasts, By Technology (2020-2032) (USD Billion)
11.3.1.8.3 Romania Artificial Tears Market Estimates and Forecasts, by Application (2020-2032) (USD Billion)
11.3.1.8.4 Romania Artificial Tears Market Estimates and Forecasts, By Distribution Channel (2020-2032) (USD Billion)
11.3.1.9 Hungary
11.3.1.9.1 Hungary Artificial Tears Market Estimates and Forecasts, by Type (2020-2032) (USD Billion)
11.3.1.9.2 Hungary Artificial Tears Market Estimates and Forecasts, By Technology (2020-2032) (USD Billion)
11.3.1.9.3 Hungary Artificial Tears Market Estimates and Forecasts, by Application (2020-2032) (USD Billion)
11.3.1.9.4 Hungary Artificial Tears Market Estimates and Forecasts, By Distribution Channel (2020-2032) (USD Billion)
11.3.1.10 Turkey
11.3.1.10.1 Turkey Artificial Tears Market Estimates and Forecasts, by Type (2020-2032) (USD Billion)
11.3.1.10.2 Turkey Artificial Tears Market Estimates and Forecasts, By Technology (2020-2032) (USD Billion)
11.3.1.10.3 Turkey Artificial Tears Market Estimates and Forecasts, by Application (2020-2032) (USD Billion)
11.3.1.10.4 Turkey Artificial Tears Market Estimates and Forecasts, By Distribution Channel (2020-2032) (USD Billion)
11.3.1.11 Rest of Eastern Europe
11.3.1.11.1 Rest of Eastern Europe Artificial Tears Market Estimates and Forecasts, by Type (2020-2032) (USD Billion)
11.3.1.11.2 Rest of Eastern Europe Artificial Tears Market Estimates and Forecasts, By Technology (2020-2032) (USD Billion)
11.3.1.11.3 Rest of Eastern Europe Artificial Tears Market Estimates and Forecasts, by Application (2020-2032) (USD Billion)
11.3.1.11.4 Rest of Eastern Europe Artificial Tears Market Estimates and Forecasts, By Distribution Channel (2020-2032) (USD Billion)
11.3.2 Western Europe
11.3.2.1 Trends Analysis
11.3.2.2 Western Europe Artificial Tears Market Estimates and Forecasts, by Country (2020-2032) (USD Billion)
11.3.2.3 Western Europe Artificial Tears Market Estimates and Forecasts, by Type (2020-2032) (USD Billion)
11.3.2.4 Western Europe Artificial Tears Market Estimates and Forecasts, By Application (2020-2032) (USD Billion)
11.3.2.5 Western Europe Artificial Tears Market Estimates and Forecasts, by Delivery Mode (2020-2032) (USD Billion)
11.3.2.6 Western Europe Artificial Tears Market Estimates and Forecasts, By Distribution Channel (2020-2032) (USD Billion)
11.3.2.7 Germany
11.3.2.7.1 Germany Artificial Tears Market Estimates and Forecasts, by Type (2020-2032) (USD Billion)
11.3.2.7.2 Germany Artificial Tears Market Estimates and Forecasts, By Technology (2020-2032) (USD Billion)
11.3.2.7.3 Germany Artificial Tears Market Estimates and Forecasts, by Application (2020-2032) (USD Billion)
11.3.2.7.4 Germany Artificial Tears Market Estimates and Forecasts, By Distribution Channel (2020-2032) (USD Billion)
11.3.2.8 France
11.3.2.8.1 France Artificial Tears Market Estimates and Forecasts, by Type (2020-2032) (USD Billion)
11.3.2.8.2 France Artificial Tears Market Estimates and Forecasts, By Technology (2020-2032) (USD Billion)
11.3.2.8.3 France Artificial Tears Market Estimates and Forecasts, by Application (2020-2032) (USD Billion)
11.3.2.8.4 France Artificial Tears Market Estimates and Forecasts, By Distribution Channel (2020-2032) (USD Billion)
11.3.2.9 UK
11.3.2.9.1 UK Artificial Tears Market Estimates and Forecasts, by Type (2020-2032) (USD Billion)
11.3.2.9.2 UK Artificial Tears Market Estimates and Forecasts, By Technology (2020-2032) (USD Billion)
11.3.2.9.3 UK Artificial Tears Market Estimates and Forecasts, by Application (2020-2032) (USD Billion)
11.3.2.9.4 UK Artificial Tears Market Estimates and Forecasts, By Distribution Channel (2020-2032) (USD Billion)
11.3.2.10 Italy
11.3.2.10.1 Italy Artificial Tears Market Estimates and Forecasts, by Type (2020-2032) (USD Billion)
11.3.2.10.2 Italy Artificial Tears Market Estimates and Forecasts, By Technology (2020-2032) (USD Billion)
11.3.2.10.3 Italy Artificial Tears Market Estimates and Forecasts, by Application (2020-2032) (USD Billion)
11.3.2.10.4 Italy Artificial Tears Market Estimates and Forecasts, By Distribution Channel (2020-2032) (USD Billion)
11.3.2.11 Spain
11.3.2.11.1 Spain Artificial Tears Market Estimates and Forecasts, by Type (2020-2032) (USD Billion)
11.3.2.11.2 Spain Artificial Tears Market Estimates and Forecasts, By Technology (2020-2032) (USD Billion)
11.3.2.11.3 Spain Artificial Tears Market Estimates and Forecasts, by Application (2020-2032) (USD Billion)
11.3.2.11.4 Spain Artificial Tears Market Estimates and Forecasts, By Distribution Channel (2020-2032) (USD Billion)
11.3.2.12 Netherlands
11.3.2.12.1 Netherlands Artificial Tears Market Estimates and Forecasts, by Type (2020-2032) (USD Billion)
11.3.2.12.2 Netherlands Artificial Tears Market Estimates and Forecasts, By Technology (2020-2032) (USD Billion)
11.3.2.12.3 Netherlands Artificial Tears Market Estimates and Forecasts, by Application (2020-2032) (USD Billion)
11.3.2.12.4 Netherlands Artificial Tears Market Estimates and Forecasts, By Distribution Channel (2020-2032) (USD Billion)
11.3.2.13 Switzerland
11.3.2.13.1 Switzerland Artificial Tears Market Estimates and Forecasts, by Type (2020-2032) (USD Billion)
11.3.2.13.2 Switzerland Artificial Tears Market Estimates and Forecasts, By Technology (2020-2032) (USD Billion)
11.3.2.13.3 Switzerland Artificial Tears Market Estimates and Forecasts, by Application (2020-2032) (USD Billion)
11.3.2.13.4 Switzerland Artificial Tears Market Estimates and Forecasts, By Distribution Channel (2020-2032) (USD Billion)
11.3.2.14 Austria
11.3.2.14.1 Austria Artificial Tears Market Estimates and Forecasts, by Type (2020-2032) (USD Billion)
11.3.2.14.2 Austria Artificial Tears Market Estimates and Forecasts, By Technology (2020-2032) (USD Billion)
11.3.2.14.3 Austria Artificial Tears Market Estimates and Forecasts, by Application (2020-2032) (USD Billion)
11.3.2.14.4 Austria Artificial Tears Market Estimates and Forecasts, By Distribution Channel (2020-2032) (USD Billion)
11.3.2.15 Rest of Western Europe
11.3.2.15.1 Rest of Western Europe Artificial Tears Market Estimates and Forecasts, by Type (2020-2032) (USD Billion)
11.3.2.15.2 Rest of Western Europe Artificial Tears Market Estimates and Forecasts, By Technology (2020-2032) (USD Billion)
11.3.2.15.3 Rest of Western Europe Artificial Tears Market Estimates and Forecasts, by Application (2020-2032) (USD Billion)
11.3.2.15.4 Rest of Western Europe Artificial Tears Market Estimates and Forecasts, By Distribution Channel (2020-2032) (USD Billion)
11.4 Asia Pacific
11.4.1 Trends Analysis
11.4.2 Asia Pacific Artificial Tears Market Estimates and Forecasts, by Country (2020-2032) (USD Billion)
11.4.3 Asia Pacific Artificial Tears Market Estimates and Forecasts, by Type (2020-2032) (USD Billion)
11.4.4 Asia Pacific Artificial Tears Market Estimates and Forecasts, By Technology (2020-2032) (USD Billion)
11.4.5 Asia Pacific Artificial Tears Market Estimates and Forecasts, by Application (2020-2032) (USD Billion)
11.4.6 Asia Pacific Artificial Tears Market Estimates and Forecasts, By Distribution Channel (2020-2032) (USD Billion)
11.4.7 China
11.4.7.1 China Artificial Tears Market Estimates and Forecasts, by Type (2020-2032) (USD Billion)
11.4.7.2 China Artificial Tears Market Estimates and Forecasts, By Technology (2020-2032) (USD Billion)
11.4.7.3 China Artificial Tears Market Estimates and Forecasts, by Application (2020-2032) (USD Billion)
11.4.7.4 China Artificial Tears Market Estimates and Forecasts, By Distribution Channel (2020-2032) (USD Billion)
11.4.8 India
11.4.8.1 India Artificial Tears Market Estimates and Forecasts, by Type (2020-2032) (USD Billion)
11.4.8.2 India Artificial Tears Market Estimates and Forecasts, By Technology (2020-2032) (USD Billion)
11.4.8.3 India Artificial Tears Market Estimates and Forecasts, by Application (2020-2032) (USD Billion)
11.4.8.4 India Artificial Tears Market Estimates and Forecasts, By Distribution Channel (2020-2032) (USD Billion)
11.4.9 Japan
11.4.9.1 Japan Artificial Tears Market Estimates and Forecasts, by Type (2020-2032) (USD Billion)
11.4.9.2 Japan Artificial Tears Market Estimates and Forecasts, By Technology (2020-2032) (USD Billion)
11.4.9.3 Japan Artificial Tears Market Estimates and Forecasts, by Application (2020-2032) (USD Billion)
11.4.9.4 Japan Artificial Tears Market Estimates and Forecasts, By Distribution Channel (2020-2032) (USD Billion)
11.4.10 South Korea
11.4.10.1 South Korea Artificial Tears Market Estimates and Forecasts, by Type (2020-2032) (USD Billion)
11.4.10.2 South Korea Artificial Tears Market Estimates and Forecasts, By Technology (2020-2032) (USD Billion)
11.4.10.3 South Korea Artificial Tears Market Estimates and Forecasts, by Application (2020-2032) (USD Billion)
11.4.10.4 South Korea Artificial Tears Market Estimates and Forecasts, By Distribution Channel (2020-2032) (USD Billion)
11.4.11 Vietnam
11.4.11.1 Vietnam Artificial Tears Market Estimates and Forecasts, by Type (2020-2032) (USD Billion)
11.4.11.2 Vietnam Artificial Tears Market Estimates and Forecasts, By Technology (2020-2032) (USD Billion)
11.4.11.3 Vietnam Artificial Tears Market Estimates and Forecasts, by Application (2020-2032) (USD Billion)
11.4.11.4 Vietnam Artificial Tears Market Estimates and Forecasts, By Distribution Channel (2020-2032) (USD Billion)
11.4.12 Singapore
11.4.12.1 Singapore Artificial Tears Market Estimates and Forecasts, by Type (2020-2032) (USD Billion)
11.4.12.2 Singapore Artificial Tears Market Estimates and Forecasts, By Technology (2020-2032) (USD Billion)
11.4.12.3 Singapore Artificial Tears Market Estimates and Forecasts, by Application (2020-2032) (USD Billion)
11.4.12.4 Singapore Artificial Tears Market Estimates and Forecasts, By Distribution Channel (2020-2032) (USD Billion)
11.4.13 Australia
11.4.13.1 Australia Artificial Tears Market Estimates and Forecasts, by Type (2020-2032) (USD Billion)
11.4.13.2 Australia Artificial Tears Market Estimates and Forecasts, By Technology (2020-2032) (USD Billion)
11.4.13.3 Australia Artificial Tears Market Estimates and Forecasts, by Application (2020-2032) (USD Billion)
11.4.13.4 Australia Artificial Tears Market Estimates and Forecasts, By Distribution Channel (2020-2032) (USD Billion)
11.4.14 Rest of Asia Pacific
11.4.14.1 Rest of Asia Pacific Artificial Tears Market Estimates and Forecasts, by Type (2020-2032) (USD Billion)
11.4.14.2 Rest of Asia Pacific Artificial Tears Market Estimates and Forecasts, By Technology (2020-2032) (USD Billion)
11.4.14.3 Rest of Asia Pacific Artificial Tears Market Estimates and Forecasts, by Application (2020-2032) (USD Billion)
11.4.14.4 Rest of Asia Pacific Artificial Tears Market Estimates and Forecasts, By Distribution Channel (2020-2032) (USD Billion)
11.5 Middle East and Africa
11.5.1 Middle East
11.5.1.1 Trends Analysis
11.5.1.2 Middle East Artificial Tears Market Estimates and Forecasts, by Country (2020-2032) (USD Billion)
11.5.1.3 Middle East Artificial Tears Market Estimates and Forecasts, by Type (2020-2032) (USD Billion)
11.5.1.4 Middle East Artificial Tears Market Estimates and Forecasts, By Technology (2020-2032) (USD Billion)
11.5.1.5 Middle East Artificial Tears Market Estimates and Forecasts, by Application (2020-2032) (USD Billion)
11.5.1.6 Middle East Artificial Tears Market Estimates and Forecasts, By Distribution Channel (2020-2032) (USD Billion)
11.5.1.7 UAE
11.5.1.7.1 UAE Artificial Tears Market Estimates and Forecasts, by Type (2020-2032) (USD Billion)
11.5.1.7.2 UAE Artificial Tears Market Estimates and Forecasts, By Technology (2020-2032) (USD Billion)
11.5.1.7.3 UAE Artificial Tears Market Estimates and Forecasts, by Application (2020-2032) (USD Billion)
11.5.1.7.4 UAE Artificial Tears Market Estimates and Forecasts, By Distribution Channel (2020-2032) (USD Billion)
11.5.1.8 Egypt
11.5.1.8.1 Egypt Artificial Tears Market Estimates and Forecasts, by Type (2020-2032) (USD Billion)
11.5.1.8.2 Egypt Artificial Tears Market Estimates and Forecasts, By Technology (2020-2032) (USD Billion)
11.5.1.8.3 Egypt Artificial Tears Market Estimates and Forecasts, by Application (2020-2032) (USD Billion)
11.5.1.8.4 Egypt Artificial Tears Market Estimates and Forecasts, By Distribution Channel (2020-2032) (USD Billion)
11.5.1.9 Saudi Arabia
11.5.1.9.1 Saudi Arabia Artificial Tears Market Estimates and Forecasts, by Type (2020-2032) (USD Billion)
11.5.1.9.2 Saudi Arabia Artificial Tears Market Estimates and Forecasts, By Technology (2020-2032) (USD Billion)
11.5.1.9.3 Saudi Arabia Artificial Tears Market Estimates and Forecasts, by Application (2020-2032) (USD Billion)
11.5.1.9.4 Saudi Arabia Artificial Tears Market Estimates and Forecasts, By Distribution Channel (2020-2032) (USD Billion)
11.5.1.10 Qatar
11.5.1.10.1 Qatar Artificial Tears Market Estimates and Forecasts, by Type (2020-2032) (USD Billion)
11.5.1.10.2 Qatar Artificial Tears Market Estimates and Forecasts, By Technology (2020-2032) (USD Billion)
11.5.1.10.3 Qatar Artificial Tears Market Estimates and Forecasts, by Application (2020-2032) (USD Billion)
11.5.1.10.4 Qatar Artificial Tears Market Estimates and Forecasts, By Distribution Channel (2020-2032) (USD Billion)
11.5.1.11 Rest of Middle East
11.5.1.11.1 Rest of Middle East Artificial Tears Market Estimates and Forecasts, by Type (2020-2032) (USD Billion)
11.5.1.11.2 Rest of Middle East Artificial Tears Market Estimates and Forecasts, By Technology (2020-2032) (USD Billion)
11.5.1.11.3 Rest of Middle East Artificial Tears Market Estimates and Forecasts, by Application (2020-2032) (USD Billion)
11.5.1.11.4 Rest of Middle East Artificial Tears Market Estimates and Forecasts, By Distribution Channel (2020-2032) (USD Billion)
11.5.2 Africa
11.5.2.1 Trends Analysis
11.5.2.2 Africa Artificial Tears Market Estimates and Forecasts, by Country (2020-2032) (USD Billion)
11.5.2.3 Africa Artificial Tears Market Estimates and Forecasts, by Type (2020-2032) (USD Billion)
11.5.2.4 Africa Artificial Tears Market Estimates and Forecasts, By Technology (2020-2032) (USD Billion)
11.5.2.5 Africa Artificial Tears Market Estimates and Forecasts, by Application (2020-2032) (USD Billion)
11.5.2.6 Africa Artificial Tears Market Estimates and Forecasts, By Distribution Channel (2020-2032) (USD Billion)
11.5.2.7 South Africa
11.5.2.7.1 South Africa Artificial Tears Market Estimates and Forecasts, by Type (2020-2032) (USD Billion)
11.5.2.7.2 South Africa Artificial Tears Market Estimates and Forecasts, By Technology (2020-2032) (USD Billion)
11.5.2.7.3 South Africa Artificial Tears Market Estimates and Forecasts, by Application (2020-2032) (USD Billion)
11.5.2.7.4 South Africa Artificial Tears Market Estimates and Forecasts, By Distribution Channel (2020-2032) (USD Billion)
11.5.2.8 Nigeria
11.5.2.8.1 Nigeria Artificial Tears Market Estimates and Forecasts, by Type (2020-2032) (USD Billion)
11.5.2.8.2 Nigeria Artificial Tears Market Estimates and Forecasts, By Technology (2020-2032) (USD Billion)
11.5.2.8.3 Nigeria Artificial Tears Market Estimates and Forecasts, by Application (2020-2032) (USD Billion)
11.5.2.8.4 Nigeria Artificial Tears Market Estimates and Forecasts, By Distribution Channel (2020-2032) (USD Billion)
11.5.2.9 Rest of Africa
11.5.2.9.1 Rest of Africa Artificial Tears Market Estimates and Forecasts, by Type (2020-2032) (USD Billion)
11.5.2.9.2 Rest of Africa Artificial Tears Market Estimates and Forecasts, By Technology (2020-2032) (USD Billion)
11.5.2.9.3 Rest of Africa Artificial Tears Market Estimates and Forecasts, by Application (2020-2032) (USD Billion)
11.5.2.9.4 Rest of Africa Artificial Tears Market Estimates and Forecasts, By Distribution Channel (2020-2032) (USD Billion)
11.6 Latin America
11.6.1 Trends Analysis
11.6.2 Latin America Artificial Tears Market Estimates and Forecasts, by Country (2020-2032) (USD Billion)
11.6.3 Latin America Artificial Tears Market Estimates and Forecasts, by Type (2020-2032) (USD Billion)
11.6.4 Latin America Artificial Tears Market Estimates and Forecasts, By Technology (2020-2032) (USD Billion)
11.6.5 Latin America Artificial Tears Market Estimates and Forecasts, by Application (2020-2032) (USD Billion)
11.6.6 Latin America Artificial Tears Market Estimates and Forecasts, By Distribution Channel (2020-2032) (USD Billion)
11.6.7 Brazil
11.6.7.1 Brazil Artificial Tears Market Estimates and Forecasts, by Type (2020-2032) (USD Billion)
11.6.7.2 Brazil Artificial Tears Market Estimates and Forecasts, By Technology (2020-2032) (USD Billion)
11.6.7.3 Brazil Artificial Tears Market Estimates and Forecasts, by Application (2020-2032) (USD Billion)
11.6.7.4 Brazil Artificial Tears Market Estimates and Forecasts, By Distribution Channel (2020-2032) (USD Billion)
11.6.8 Argentina
11.6.8.1 Argentina Artificial Tears Market Estimates and Forecasts, by Type (2020-2032) (USD Billion)
11.6.8.2 Argentina Artificial Tears Market Estimates and Forecasts, By Technology (2020-2032) (USD Billion)
11.6.8.3 Argentina Artificial Tears Market Estimates and Forecasts, by Application (2020-2032) (USD Billion)
11.6.8.4 Argentina Artificial Tears Market Estimates and Forecasts, By Distribution Channel (2020-2032) (USD Billion)
11.6.9 Colombia
11.6.9.1 Colombia Artificial Tears Market Estimates and Forecasts, by Type (2020-2032) (USD Billion)
11.6.9.2 Colombia Artificial Tears Market Estimates and Forecasts, By Technology (2020-2032) (USD Billion)
11.6.9.3 Colombia Artificial Tears Market Estimates and Forecasts, by Application (2020-2032) (USD Billion)
11.6.9.4 Colombia Artificial Tears Market Estimates and Forecasts, By Distribution Channel (2020-2032) (USD Billion)
11.6.10 Rest of Latin America
11.6.10.1 Rest of Latin America Artificial Tears Market Estimates and Forecasts, by Type (2020-2032) (USD Billion)
11.6.10.2 Rest of Latin America Artificial Tears Market Estimates and Forecasts, By Technology (2020-2032) (USD Billion)
11.6.10.3 Rest of Latin America Artificial Tears Market Estimates and Forecasts, by Application (2020-2032) (USD Billion)
11.6.10.4 Rest of Latin America Artificial Tears Market Estimates and Forecasts, By Distribution Channel (2020-2032) (USD Billion)
12. Company Profiles
12.1 Johnson and Johnson Vision Care
12.1.1 Company Overview
12.1.2 Financial
12.1.3 Product / Services Offered
12.1.4 SWOT Analysis
12.2 Allergan plc
12.2.1 Company Overview
12.2.2 Financial
12.2.3 Product / Services Offered
12.2.4 SWOT Analysis
12.3 Alcon Plc
12.3.1 Company Overview
12.3.2 Financial
12.3.3 Product / Services Offered
12.3.4 SWOT Analysis
12.4 Bausch & Lomb Incorporated
12.4.1 Company Overview
12.4.2 Financial
12.4.3 Product / Services Offered
12.4.4 SWOT Analysis
12.5 URSAPHARM Arzneimittel GmbH
12.5.1 Company Overview
12.5.2 Financial
12.5.3 Product / Services Offered
12.5.4 SWOT Analysis
12.6 ROHTO Pharmaceutical CO., LTD
12.6.1 Company Overview
12.6.2 Financial
12.6.3 Product / Services Offered
12.6.4 SWOT Analysis
12.7 Similasan Corporation
12.7.1 Company Overview
12.7.2 Financial
12.7.3 Product / Services Offered
12.7.4 SWOT Analysis
12.8 Abbott
12.8.1 Company Overview
12.8.2 Financial
12.8.3 Product / Services Offered
12.8.4 SWOT Analysis
12.9 Thea Pharmaceuticals
12.9.1 Company Overview
12.9.2 Financial
12.9.3 Product / Services Offered
12.9.4 SWOT Analysis
12.10 Hikma Pharmaceuticals
12.10.1 Company Overview
12.10.2 Financial
12.10.3 Product / Services Offered
12.10.4 SWOT Analysis
13. Use Cases and Best Practices
14. Conclusion
An accurate research report requires proper strategizing as well as implementation. There are multiple factors involved in the completion of good and accurate research report and selecting the best methodology to compete the research is the toughest part. Since the research reports we provide play a crucial role in any company’s decision-making process, therefore we at SNS Insider always believe that we should choose the best method which gives us results closer to reality. This allows us to reach at a stage wherein we can provide our clients best and accurate investment to output ratio.
Each report that we prepare takes a timeframe of 350-400 business hours for production. Starting from the selection of titles through a couple of in-depth brain storming session to the final QC process before uploading our titles on our website we dedicate around 350 working hours. The titles are selected based on their current market cap and the foreseen CAGR and growth.
The 5 steps process:
Step 1: Secondary Research:
Secondary Research or Desk Research is as the name suggests is a research process wherein, we collect data through the readily available information. In this process we use various paid and unpaid databases which our team has access to and gather data through the same. This includes examining of listed companies’ annual reports, Journals, SEC filling etc. Apart from this our team has access to various associations across the globe across different industries. Lastly, we have exchange relationships with various university as well as individual libraries.

Step 2: Primary Research
When we talk about primary research, it is a type of study in which the researchers collect relevant data samples directly, rather than relying on previously collected data. This type of research is focused on gaining content specific facts that can be sued to solve specific problems. Since the collected data is fresh and first hand therefore it makes the study more accurate and genuine.
We at SNS Insider have divided Primary Research into 2 parts.
Part 1 wherein we interview the KOLs of major players as well as the upcoming ones across various geographic regions. This allows us to have their view over the market scenario and acts as an important tool to come closer to the accurate market numbers. As many as 45 paid and unpaid primary interviews are taken from both the demand and supply side of the industry to make sure we land at an accurate judgement and analysis of the market.
This step involves the triangulation of data wherein our team analyses the interview transcripts, online survey responses and observation of on filed participants. The below mentioned chart should give a better understanding of the part 1 of the primary interview.

Part 2: In this part of primary research the data collected via secondary research and the part 1 of the primary research is validated with the interviews from individual consultants and subject matter experts.
Consultants are those set of people who have at least 12 years of experience and expertise within the industry whereas Subject Matter Experts are those with at least 15 years of experience behind their back within the same space. The data with the help of two main processes i.e., FGDs (Focused Group Discussions) and IDs (Individual Discussions). This gives us a 3rd party nonbiased primary view of the market scenario making it a more dependable one while collation of the data pointers.
Step 3: Data Bank Validation
Once all the information is collected via primary and secondary sources, we run that information for data validation. At our intelligence centre our research heads track a lot of information related to the market which includes the quarterly reports, the daily stock prices, and other relevant information. Our data bank server gets updated every fortnight and that is how the information which we collected using our primary and secondary information is revalidated in real time.

Step 4: QA/QC Process
After all the data collection and validation our team does a final level of quality check and quality assurance to get rid of any unwanted or undesired mistakes. This might include but not limited to getting rid of the any typos, duplication of numbers or missing of any important information. The people involved in this process include technical content writers, research heads and graphics people. Once this process is completed the title gets uploader on our platform for our clients to read it.
Step 5: Final QC/QA Process:
This is the last process and comes when the client has ordered the study. In this process a final QA/QC is done before the study is emailed to the client. Since we believe in giving our clients a good experience of our research studies, therefore, to make sure that we do not lack at our end in any way humanly possible we do a final round of quality check and then dispatch the study to the client.
By Type
Polyethylene Glycol
Propylene Glycol
Cellulose
Glycerin
Others
By Delivery Mode
Eye Drops
Ointments
Sprays
By Application
Dry Eye Syndrome
Allergies And Infections
Others
By Distribution Channel
Hospital Pharmacies
Drug Stores
Retail Pharmacies
Online Pharmacies
Request for Segment Customization as per your Business Requirement: Segment Customization Request
Regional Coverage:
North America
US
Canada
Mexico
Europe
Eastern Europe
Poland
Romania
Hungary
Turkey
Rest of Eastern Europe
Western Europe
Germany
France
UK
Italy
Spain
Netherlands
Switzerland
Austria
Rest of Western Europe
Asia Pacific
China
India
Japan
South Korea
Vietnam
Singapore
Australia
Rest of Asia Pacific
Middle East & Africa
Middle East
UAE
Egypt
Saudi Arabia
Qatar
Rest of Middle East
Africa
Nigeria
South Africa
Rest of Africa
Latin America
Brazil
Argentina
Colombia
Rest of Latin America
Request for Country Level Research Report: Country Level Customization Request
Available Customization
With the given market data, SNS Insider offers customization as per the company’s specific needs. The following customization options are available for the report:
Detailed Volume Analysis
Criss-Cross segment analysis (e.g. Product X Application)
Competitive Product Benchmarking
Geographic Analysis
Additional countries in any of the regions
Customized Data Representation
Detailed analysis and profiling of additional market players
The Digital PCR Market size was valued at USD 6.77 billion in 2023 & projected to reach USD 14.89 billion by 2032, at a CAGR of 9.16% by 2024-2032.
The Viral Vectors and Plasmid DNA Manufacturing Market size was estimated at USD 4.4 billion in 2022 and is expected to reach USD 19.4 billion by 2030 with a growing CAGR of 20.4% during the forecast period of 2023-2030.
Spay And Neuter Market Size was valued at USD 2.32 billion in 2023 and is expected to reach USD 3.43 billion by 2032, growing at a CAGR of 4.44% over the forecast period 2024-2032.
The global Oncology Drugs Market size was USD 202.3 billion in 2023, is projected to reach USD 530.39 billion by 2032, growing at an 11.34% CAGR (2024-2032).
The Newborn Screening Market size was USD 880 million in 2023 and is expected to reach USD 1,710.7 million by 2032, growing at a 7.68% CAGR from 2024 to 2032.
The Multiple Sclerosis Market size was valued at USD 23.64 billion in 2023 and is projected to reach USD 43.40 billion by 2032, growing at a CAGR of 7.00%.

Hi! Click one of our member below to chat on Phone
© 2025 All Rights Reserved by SNS Insider Pvt Ltd


