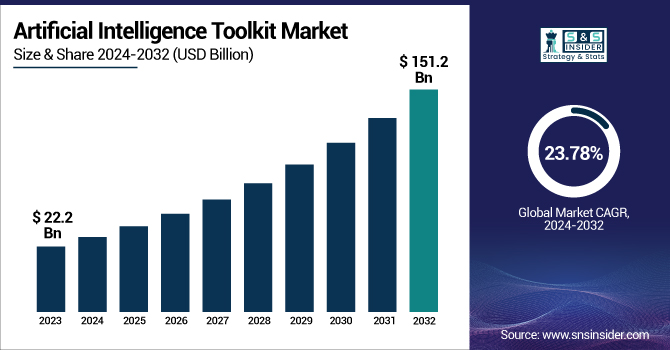
The Artificial Intelligence Toolkit Market was valued at USD 22.2 billion in 2023 and is expected to reach USD 151.2 billion by 2032, growing at a CAGR of 23.78% from 2024-2032.
To Get more information on Artificial Intelligence Toolkit Market - Request Free Sample Report
In the Artificial Intelligence Toolkit Market, adoption rates are highest in industries like healthcare, finance, retail, and manufacturing, driven by the need for intelligent automation and data-driven decision-making. Open-source AI toolkits are gaining popularity for their flexibility and community support, while proprietary solutions remain favored for enterprise-grade security and technical backing. Regionally, North America and Asia Pacific lead the market in revenue contribution, followed by steady growth in Europe. Cloud-based deployment dominates due to its scalability, ease of integration, and cost efficiency, though on-premise options continue to appeal in security-sensitive environments. The report could also explore integration trends with low-code/no-code platforms, AI toolkit marketplaces, and embedded AI functionalities within enterprise applications.
In the U.S. AI toolkit market, the market size was approximately USD 6.7 billion in 2023 and is projected to reach over USD 44.2 billion by 2032, reflecting a compound annual growth rate (CAGR) of around 23.42%. Growth factors include robust technological infrastructure, significant investments in AI research, and the presence of leading AI companies such as Google, Microsoft, and NVIDIA. The high adoption rates of AI in industries like healthcare, finance, retail, and automotive further propel market growth.
Driver
Rising demand for AI-driven business intelligence is accelerating the adoption of AI toolkits across key industries.
As a major driver of the Artificial Intelligence Toolkit Market, the ever-increasing demand for smart data analytical and decision-making capability. Companies from different verticals, such as healthcare, BFSI, retail, and logistics, are now using AI toolkits to extract useful intelligence from the growing amount of data, enhance personalization, and automate workflows involving complex processes. AI toolkits can make it easy to build, deploy, and manage AI models, saving time and money when it comes to implementation. Himanshu Varshney, Senior Director — AI & Data Analytics, Veritas Technologies: The widespread adoption of digital transformation initiatives among enterprises makes AI-powered business intelligence core to competitive advantage, thus propelling demand for AI toolkits featuring advanced machine learning, natural language processing, and computer vision capabilities.
Restraint
Technical complexities in AI model development and integration limit market accessibility for smaller enterprises.
However, the technical complexities involved in the development, training, and deployment of AI Models are a major restraint towards the adoption of this market despite the growth of the market. Artificial intelligence tool kits frequently need competencies in information science, machine learning, and infrastructure management, presenting a barrier for small and mid-sized enterprises that don’t have the talent in residence to capitalize on the opportunity. But the challenges of adoption are manifold — integrating AI solutions with existing IT systems, ensuring that the models you buy or build are correct, respecting privacy laws, and preventing AI systems from being hacked are just some of them. Furthermore, poor data quality and limitations with data infrastructures can affect AI toolkits’ performance. Such challenges restrict the accessibility of the market, especially for organizations in emerging economies or those with high regulatory requirements and legacy systems.
Opportunity
Integration with low-code/no-code platforms is enabling wider, faster, and more democratized AI adoption.
However, there is a large market opportunity available for bringing AI toolkits together with no or low-code AI development platforms. Such tools enable business analysts and other non-technical users to build, deploy, and manage AI options through visual interfaces with minimum coding expertise. Organizations can democratize AI adoption and bring AI projects to several organizational departments by lowering the technical barrier. AI toolkits are also the wave for them and vendors that offer these toolkits ail to be supported on low-code/no-code platforms to look more competitive as they counter talent shortage, though lowering the total cost of AI deployment. This trend of integration is especially beneficial for SMEs and modern industries that are new to AI implementation, and further drives the growth of the market in the coming years.
Challenge:
Growing concerns around data security, privacy, and AI ethics pose operational and compliance hurdles for providers.
Concerns regarding data security, privacy, and ethical use have become a major challenge for AI toolkit providers and users as more organizations adopt AI. As AI models are trained on sensitive personal, financial, and operational data, this reliance highlights the risk of breaches and unauthorized access to sensitive personal and business data. Also, AI algorithm biases can lead to biased decisions, scrutiny from regulators, and damaged reputations. Now ensure transparency, accountability, and compliance with GDPR, CCPA, and other laws and regulations, and you make one more set of operational complexities. To overcome these trust and compliance-related challenges in the market, toolkit providers will need to embed deep security protocols, model explainability, and bias mitigation within the solution.
By Type
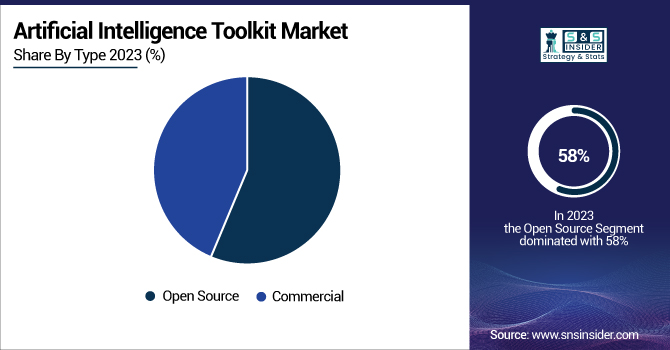
The open-source segment dominated the market and accounted for 58% of revenue share in 2023 and due to advantages like quick experimentation as well as customization of AI models by businesses and developers, flexibility for developing use cases, cost savings, and large community support. These AI toolkits like TensorFlow, PyTorch, and Scikit-learn, being open-source, contain tonnes of libraries and even frequent updates to hot plug into and hence are preferred in academia, start-up enterprises. This is especially so as the need for AI in research and innovation evolves, where the ability to have transparent and customizable solutions is increasingly vital.
The commercial segment is expected to register the fastest CAGR during the forecast period, as enterprises that place a higher demand on security, scalability, and enterprise-grade support for AI deployments. Commercial AI toolkits tend to include a suite of advanced features, including integrated analytics dashboards, model management, and regulatory compliance tools, making them more attractive for industries with complicated operational requirements. Moreover, increasing investments across enterprise-level solutions built on AI platforms, mostly in healthcare, finance, and manufacturing, are boosting the demand.
By Component
In 2023, the software segment dominated the market and accounted for 49% of revenue share, driven by the increasing demand for solutions for enterprise-wide development, deployment, and management of AI models. AI software toolkits make it easy to manipulate huge datasets, construct predictive models, and funnel AI into business workflows. The deployment of open-source and commercial AI software, meanwhile, along with ongoing updates and innovations with machine learning, computer vision, and NLP, drove market leadership.
The services segment is expected to record the fastest CAGR during the period ranging from 2024 to 2032, owing to the growing need for AI consulting, implementation support, integration, and managed services from enterprises. Companies are finding themselves more open to nostalgia-driven solutions to the tools they need to patch together, and so they want help in modifying the AI toolkit to their needs, getting even a few paid training models up and running, and meeting compliance in a more scalable manner. Enterprises that lack a tech background are also looking for AI model maintenance, performance tuning, and cloud migration services.
By Application
In 2023, the machine learning segment dominated the market and accounted for a significant revenue share, due to its extensive use in industries such as predictive analytics, recommendation systems, and anomaly detection in sectors like finance, healthcare, retail, and automotive. AI toolkits providing powerful machine learning frameworks enable organizations to discover meaningful insights from large data sets, automate decision-making, and enhance operational performance.
The natural language processing segment is projected to grow at the fastest CAGR between 2024 and 2032 as these solutions are increasingly used in AI-based chatbots, virtual assistants, and language translation tools. Today, enterprises leverage a plethora of NLP applications to automate customer communication channels, facilitate sentiment analysis, and build real-time language interpretive assistants, all to positively impact customer experience and improve operational efficiency. Increased NLP adoption across industries is augmented by generative AI models and conversational AI capabilities.
By End-Use
The IT & telecom segment dominated the market and accounted for a significant revenue share in 2023, due to early AI adoption, advanced digital infrastructure, and ongoing investments in intelligent network management and customer experience solutions. AI can automate many aspects of telecom operations, such as network optimisation, predictive maintenance, fraud detection, and personalized service delivery. Achieving this requires AI toolkits. Growing data traffic, pandemic-driven demand for AI-infused cybersecurity solutions, and rollouts of 5G network infrastructure bolstered the adoption.
The retail & e-commerce segment is expected to witness the fastest CAGR growth from 2024 to 2032 as it is driven by increasing demand for AI-powered personalization, dynamic pricing, inventory forecasting, and intelligent customer service tools. Retailers can leverage real-time customer data using AI toolkits, optimize recommendations on merchandise, automate logistics, and deploy conversational AI for conversational interaction with consumers.
North America was the largest market in 2023 and accounted for 39% of revenue share, With well-established digital infrastructure, higher adoption rates than other regions, and the presence of the main AI toolkit providers such as Google, IBM, Microsoft, and NVIDIA. Enterprise investments in AI-driven analytics, cybersecurity, and automation tools across sectors such as healthcare, BFSI, and IT & telecom drive the state of AI in the region.
The Asia Pacific is expected to exhibit the highest CAGR during 2024 and 2032, due to rapid digitalization coupled with the increasing deployment of AI across industries, as well as lucrative governmental investments and the enhancing AI talent pool in countries such as India, China, Japan, and South Korea. Rapid increase in demand from e-commerce, smart manufacturing, fintech, and public service sectors expands AI toolkits use Government-led AI innovation projects, along with the growing penetration of cloud architecture, are creating conducive space for this technology.

Get Customized Report as per Your Business Requirement - Enquiry Now
The major key players, along with their products, are
Google LLC – TensorFlow
Microsoft Corporation – Azure Machine Learning
IBM Corporation – IBM Watson Studio
Amazon Web Services, Inc. (AWS) – Amazon SageMaker
NVIDIA Corporation – NVIDIA AI Enterprise
Meta Platforms, Inc. – PyTorch
SAP SE – SAP AI Core
Oracle Corporation – Oracle AI Services
H2O.ai, Inc. – H2O Driverless AI
DataRobot, Inc. – DataRobot AI Platform
C3.ai, Inc. – C3 AI Suite
Salesforce, Inc. – Einstein AI
Anaconda, Inc. – Anaconda Distribution
MathWorks, Inc. – MATLAB AI Toolbox
RapidMiner, Inc. – RapidMiner Studio
In March 2025, Oracle expanded its distributed cloud capabilities by integrating NVIDIA AI Enterprise into Oracle Cloud Infrastructure (OCI), facilitating accelerated AI solution deployment.
In January 2025, DataRobot integrated Azure OpenAI’s GPT-4o mini into its platform, enhancing its generative AI capabilities for text and image processing tasks.
In December 2024, AWS unveiled the next generation of Amazon SageMaker, introducing features like SageMaker Unified Studio, SageMaker Lakehouse, and enhanced data and AI governance tools.
In September 2024, Salesforce introduced an AI benchmark for customer relationship management, aiming to assist businesses in selecting optimal large language models for their needs.
| Report Attributes | Details |
|---|---|
| Market Size in 2023 | US$ 22.2 Billion |
| Market Size by 2032 | US$ 151.2 Billion |
| CAGR | CAGR of 23.78 % From 2024 to 2032 |
| Base Year | 2023 |
| Forecast Period | 2024-2032 |
| Historical Data | 2020-2022 |
| Report Scope & Coverage | Market Size, Segments Analysis, Competitive Landscape, Regional Analysis, DROC & SWOT Analysis, Forecast Outlook |
| Key Segments | • By Type (Open source, Commercial) • By Component (Hardware, Software, Services) • By Application (Natural language processing, Machine learning, Computer vision, Others) • By End-Use (IT & telecom, Retail and e-commerce, BFSI, Manufacturing, Energy and utility, Government, Others) |
| Regional Analysis/Coverage | North America (US, Canada, Mexico), Europe (Eastern Europe [Poland, Romania, Hungary, Turkey, Rest of Eastern Europe] Western Europe] Germany, France, UK, Italy, Spain, Netherlands, Switzerland, Austria, Rest of Western Europe]), Asia Pacific (China, India, Japan, South Korea, Vietnam, Singapore, Australia, Rest of Asia Pacific), Middle East & Africa (Middle East [UAE, Egypt, Saudi Arabia, Qatar, Rest of Middle East], Africa [Nigeria, South Africa, Rest of Africa], Latin America (Brazil, Argentina, Colombia, Rest of Latin America) |
| Company Profiles | Google LLC, Microsoft Corporation, IBM Corporation, Amazon Web Services, Inc. (AWS), NVIDIA Corporation, Meta Platforms, Inc., SAP SE, Oracle Corporation, H2O.ai, Inc., DataRobot, Inc., C3.ai, Inc., Salesforce, Inc., Anaconda, Inc., MathWorks, Inc. |
Ans - The Artificial Intelligence Toolkit Market was valued at USD 22.2 billion in 2023 and is expected to reach USD 151.2 billion by 2032.
Ans- The CAGR of the Artificial Intelligence Toolkit Market during the forecast period is 23.78% from 2024-2032.
Ans- Asia-Pacific is expected to register the fastest CAGR during the forecast period.
Ans- Rising demand for AI-driven business intelligence is accelerating the adoption of AI toolkits across key industries.
Ans- Growing concerns around data security, privacy, and AI ethics pose operational and compliance hurdles for providers.
Table Of Content
1. Introduction
1.1 Market Definition
1.2 Scope (Inclusion and Exclusions)
1.3 Research Assumptions
2. Executive Summary
2.1 Market Overview
2.2 Regional Synopsis
2.3 Competitive Summary
3. Research Methodology
3.1 Top-Down Approach
3.2 Bottom-up Approach
3.3. Data Validation
3.4 Primary Interviews
4. Market Dynamics Impact Analysis
4.1 Market Driving Factors Analysis
4.1.1 Drivers
4.1.2 Restraints
4.1.3 Opportunities
4.1.4 Challenges
4.2 PESTLE Analysis
4.3 Porter’s Five Forces Model
5. Statistical Insights and Trends Reporting
5.1 Adoption Rate of AI Toolkits, by Industry Vertical (2022–2025)
5.2 Open-Source vs. Proprietary AI Toolkit Usage Share (2024)
5.3 Regional AI Toolkit Market Share, by Revenue (2023)
5.4 Deployment Mode Preference (Cloud vs. On-Premise) for AI Toolkits (2024)
6. Competitive Landscape
6.1 List of Major Companies By Region
6.2 Market Share Analysis By Region
6.3 Product Benchmarking
6.3.1 Product specifications and features
6.3.2 Pricing
6.4 Strategic Initiatives
6.4.1 Marketing and promotional activities
6.4.2 Distribution and Supply Chain Strategies
6.4.3 Expansion plans and new product launches
6.4.4 Strategic partnerships and collaborations
6.5 Technological Advancements
6.6 Market Positioning and Branding
7. Artificial Intelligence Toolkit Market Segmentation by Component
7.1 Chapter Overview
7.2 Hardware
7.2.1 Hardware Market Trends Analysis (2020-2032)
7.2.2 Hardware Market Size Estimates and Forecasts to 2032 (USD Billion)
7.3 Software
7.3.1 Software Market Trends Analysis (2020-2032)
7.3.2 Software Market Size Estimates and Forecasts to 2032 (USD Billion)
7.4 Services
7.4.1 Services Market Trends Analysis (2020-2032)
7.4.2 Services Market Size Estimates and Forecasts to 2032 (USD Billion)
8. Artificial Intelligence Toolkit Market Segmentation By Type
8.1 Chapter Overview
8.2 Open source
8.2.1 Open source Market Trends Analysis (2020-2032)
8.2.2 Open source Market Size Estimates and Forecasts to 2032 (USD Billion)
8.3 Commercial
8.3.1 Commercial Market Trends Analysis (2020-2032)
8.3.2 Commercial Market Size Estimates and Forecasts to 2032 (USD Billion)
9. Artificial Intelligence Toolkit Market Segmentation by Application
9.1 Chapter Overview
9.2 Natural language processing
9.2.1 Natural language processing Market Trends Analysis (2020-2032)
9.2.2 Natural language processing Market Size Estimates and Forecasts to 2032 (USD Billion)
9.3 Machine learning
9.3.1 Machine learning Market Trends Analysis (2020-2032)
9.3.2 Machine learning Market Size Estimates and Forecasts to 2032 (USD Billion)
9.4 Computer vision
9.4.1 Computer vision Market Trends Analysis (2020-2032)
9.4.2 Computer vision Market Size Estimates and Forecasts to 2032 (USD Billion)
9.5 Others
9.5.1 Others Market Trends Analysis (2020-2032)
9.5.2 Others Market Size Estimates and Forecasts to 2032 (USD Billion)
10. Artificial Intelligence Toolkit Market Segmentation by End-Use
10.1 Chapter Overview
10.2 BFSI
10.2.1 BFSI Market Trends Analysis (2020-2032)
10.2.2 BFSI Market Size Estimates and Forecasts to 2032 (USD Billion)
10.3 Retail and e-commerce
10.3.1 Retail and e-commerce Market Trend Analysis (2020-2032)
10.3.2 Retail and e-commerce Market Size Estimates and Forecasts to 2032 (USD Billion)
10.4 IT & Telecom
10.4.1 IT & Telecom Market Trends Analysis (2020-2032)
10.4.2 IT & Telecom Market Size Estimates and Forecasts to 2032 (USD Billion)
10.5 Government
10.5.1 Government Market Trends Analysis (2020-2032)
10.5.2 Government Market Size Estimates and Forecasts to 2032 (USD Billion)
10.6 Manufacturing
10.6.1 Manufacturing Market Trends Analysis (2020-2032)
10.6.2 Manufacturing Market Size Estimates and Forecasts to 2032 (USD Billion)
10.7 Energy and utility
10.7.1 Energy and utility Market Trends Analysis (2020-2032)
10.7.2 Energy and utility Market Size Estimates and Forecasts to 2032 (USD Billion)
10.8 Others
10.8.1 Others Market Trends Analysis (2020-2032)
10.8.2 Others Market Size Estimates and Forecasts to 2032 (USD Billion)
11. Regional Analysis
11.1 Chapter Overview
11.2 North America
11.2.1 Trend Analysis
11.2.2 North America Artificial Intelligence Toolkit Market Estimates and Forecasts by Country (2020-2032) (USD Billion)
11.2.3 North America Artificial Intelligence Toolkit Market Estimates and Forecasts by Component (2020-2032) (USD Billion)
11.2.4 North America Artificial Intelligence Toolkit Market Estimates and Forecasts By Type (2020-2032) (USD Billion)
11.2.5 North America Artificial Intelligence Toolkit Market Estimates and Forecasts by Application (2020-2032) (USD Billion)
11.2.6 North America Artificial Intelligence Toolkit Market Estimates and Forecasts by End-Use (2020-2032) (USD Billion)
11.2.7 USA
11.2.7.1 USA Artificial Intelligence Toolkit Market Estimates and Forecasts by Component (2020-2032) (USD Billion)
11.2.7.2 USA Artificial Intelligence Toolkit Market Estimates and Forecasts By Type (2020-2032) (USD Billion)
11.2.7.3 USA Artificial Intelligence Toolkit Market Estimates and Forecasts by Application (2020-2032) (USD Billion)
11.2.7.4 USA Artificial Intelligence Toolkit Market Estimates and Forecasts by End-Use (2020-2032) (USD Billion)
11.2.8 Canada
11.2.8.1 Canada Artificial Intelligence Toolkit Market Estimates and Forecasts by Component (2020-2032) (USD Billion)
11.2.8.2 Canada Artificial Intelligence Toolkit Market Estimates and Forecasts By Type (2020-2032) (USD Billion)
11.2.8.3 Canada Artificial Intelligence Toolkit Market Estimates and Forecasts by Application (2020-2032) (USD Billion)
11.2.8.4 Canada Artificial Intelligence Toolkit Market Estimates and Forecasts by End-Use (2020-2032) (USD Billion)
11.2.9 Mexico
11.2.9.1 Mexico Artificial Intelligence Toolkit Market Estimates and Forecasts by Component (2020-2032) (USD Billion)
11.2.9.2 Mexico Artificial Intelligence Toolkit Market Estimates and Forecasts By Type (2020-2032) (USD Billion)
11.2.9.3 Mexico Artificial Intelligence Toolkit Market Estimates and Forecasts by Application (2020-2032) (USD Billion)
11.2.9.4 Mexico Artificial Intelligence Toolkit Market Estimates and Forecasts by End-Use (2020-2032) (USD Billion)
11.3 Europe
11.3.1 Eastern Europe
11.3.1.1 Trend Analysis
11.3.1.2 Eastern Europe Artificial Intelligence Toolkit Market Estimates and Forecasts by Country (2020-2032) (USD Billion)
11.3.1.3 Eastern Europe Artificial Intelligence Toolkit Market Estimates and Forecasts by Component (2020-2032) (USD Billion)
11.3.1.4 Eastern Europe Artificial Intelligence Toolkit Market Estimates and Forecasts By Type (2020-2032) (USD Billion)
11.3.1.5 Eastern Europe Artificial Intelligence Toolkit Market Estimates and Forecasts by Application (2020-2032) (USD Billion)
11.3.1.6 Eastern Europe Artificial Intelligence Toolkit Market Estimates and Forecasts by End-Use (2020-2032) (USD Billion)
11.3.1.7 Poland
11.3.1.7.1 Poland Artificial Intelligence Toolkit Market Estimates and Forecasts by Component (2020-2032) (USD Billion)
11.3.1.7.2 Poland Artificial Intelligence Toolkit Market Estimates and Forecasts By Type (2020-2032) (USD Billion)
11.3.1.7.3 Poland Artificial Intelligence Toolkit Market Estimates and Forecasts by Application (2020-2032) (USD Billion)
11.3.1.7.4 Poland Artificial Intelligence Toolkit Market Estimates and Forecasts by End-Use (2020-2032) (USD Billion)
11.3.1.8 Romania
11.3.1.8.1 Romania Artificial Intelligence Toolkit Market Estimates and Forecasts by Component (2020-2032) (USD Billion)
11.3.1.8.2 Romania Artificial Intelligence Toolkit Market Estimates and Forecasts By Type (2020-2032) (USD Billion)
11.3.1.8.3 Romania Artificial Intelligence Toolkit Market Estimates and Forecasts by Application (2020-2032) (USD Billion)
11.3.1.8.4 Romania Artificial Intelligence Toolkit Market Estimates and Forecasts by End-Use (2020-2032) (USD Billion)
11.3.1.9 Hungary
11.3.1.9.1 Hungary Artificial Intelligence Toolkit Market Estimates and Forecasts by Component (2020-2032) (USD Billion)
11.3.1.9.2 Hungary Artificial Intelligence Toolkit Market Estimates and Forecasts By Type (2020-2032) (USD Billion)
11.3.1.9.3 Hungary Artificial Intelligence Toolkit Market Estimates and Forecasts by Application (2020-2032) (USD Billion)
11.3.1.9.4 Hungary Artificial Intelligence Toolkit Market Estimates and Forecasts by End-Use (2020-2032) (USD Billion)
11.3.1.10 Turkey
11.3.1.10.1 Turkey Artificial Intelligence Toolkit Market Estimates and Forecasts by Component (2020-2032) (USD Billion)
11.3.1.10.2 Turkey Artificial Intelligence Toolkit Market Estimates and Forecasts By Type (2020-2032) (USD Billion)
11.3.1.10.3 Turkey Artificial Intelligence Toolkit Market Estimates and Forecasts by Application (2020-2032) (USD Billion)
11.3.1.10.4 Turkey Artificial Intelligence Toolkit Market Estimates and Forecasts by End-Use (2020-2032) (USD Billion)
11.3.1.11 Rest of Eastern Europe
11.3.1.11.1 Rest of Eastern Europe Artificial Intelligence Toolkit Market Estimates and Forecasts by Component (2020-2032) (USD Billion)
11.3.1.11.2 Rest of Eastern Europe Artificial Intelligence Toolkit Market Estimates and Forecasts By Type (2020-2032) (USD Billion)
11.3.1.11.3 Rest of Eastern Europe Artificial Intelligence Toolkit Market Estimates and Forecasts by Application (2020-2032) (USD Billion)
11.3.1.11.4 Rest of Eastern Europe Artificial Intelligence Toolkit Market Estimates and Forecasts by End-Use (2020-2032) (USD Billion)
11.3.2 Western Europe
11.3.2.1 Trend Analysis
11.3.2.2 Western Europe Artificial Intelligence Toolkit Market Estimates and Forecasts by Country (2020-2032) (USD Billion)
11.3.2.3 Western Europe Artificial Intelligence Toolkit Market Estimates and Forecasts by Component (2020-2032) (USD Billion)
11.3.2.4 Western Europe Artificial Intelligence Toolkit Market Estimates and Forecasts By Type (2020-2032) (USD Billion)
11.3.2.5 Western Europe Artificial Intelligence Toolkit Market Estimates and Forecasts by Application (2020-2032) (USD Billion)
11.3.2.6 Western Europe Artificial Intelligence Toolkit Market Estimates and Forecasts by End-Use (2020-2032) (USD Billion)
11.3.2.7 Germany
11.3.2.7.1 Germany Artificial Intelligence Toolkit Market Estimates and Forecasts by Component (2020-2032) (USD Billion)
11.3.2.7.2 Germany Artificial Intelligence Toolkit Market Estimates and Forecasts By Type (2020-2032) (USD Billion)
11.3.2.7.3 Germany Artificial Intelligence Toolkit Market Estimates and Forecasts by Application (2020-2032) (USD Billion)
11.3.2.7.4 Germany Artificial Intelligence Toolkit Market Estimates and Forecasts by End-Use (2020-2032) (USD Billion)
11.3.2.8 France
11.3.2.8.1 France Artificial Intelligence Toolkit Market Estimates and Forecasts by Component (2020-2032) (USD Billion)
11.3.2.8.2 France Artificial Intelligence Toolkit Market Estimates and Forecasts By Type (2020-2032) (USD Billion)
11.3.2.8.3 France Artificial Intelligence Toolkit Market Estimates and Forecasts by Application (2020-2032) (USD Billion)
11.3.2.8.4 France Artificial Intelligence Toolkit Market Estimates and Forecasts by End-Use (2020-2032) (USD Billion)
11.3.2.9 UK
11.3.2.9.1 UK Artificial Intelligence Toolkit Market Estimates and Forecasts by Component (2020-2032) (USD Billion)
11.3.2.9.2 UK Artificial Intelligence Toolkit Market Estimates and Forecasts By Type (2020-2032) (USD Billion)
11.3.2.9.3 UK Artificial Intelligence Toolkit Market Estimates and Forecasts by Application (2020-2032) (USD Billion)
11.3.2.9.4 UK Artificial Intelligence Toolkit Market Estimates and Forecasts by End-Use (2020-2032) (USD Billion)
11.3.2.10 Italy
11.3.2.10.1 Italy Artificial Intelligence Toolkit Market Estimates and Forecasts by Component (2020-2032) (USD Billion)
11.3.2.10.2 Italy Artificial Intelligence Toolkit Market Estimates and Forecasts By Type (2020-2032) (USD Billion)
11.3.2.10.3 Italy Artificial Intelligence Toolkit Market Estimates and Forecasts by Application (2020-2032) (USD Billion)
11.3.2.10.4 Italy Artificial Intelligence Toolkit Market Estimates and Forecasts by End-Use (2020-2032) (USD Billion)
11.3.2.11 Spain
11.3.2.11.1 Spain Artificial Intelligence Toolkit Market Estimates and Forecasts by Component (2020-2032) (USD Billion)
11.3.2.11.2 Spain Artificial Intelligence Toolkit Market Estimates and Forecasts By Type (2020-2032) (USD Billion)
11.3.2.11.3 Spain Artificial Intelligence Toolkit Market Estimates and Forecasts by Application (2020-2032) (USD Billion)
11.3.2.11.4 Spain Artificial Intelligence Toolkit Market Estimates and Forecasts by End-Use (2020-2032) (USD Billion)
11.3.2.12 Netherlands
11.3.2.12.1 Netherlands Artificial Intelligence Toolkit Market Estimates and Forecasts by Component (2020-2032) (USD Billion)
11.3.2.12.2 Netherlands Artificial Intelligence Toolkit Market Estimates and Forecasts By Type (2020-2032) (USD Billion)
11.3.2.12.3 Netherlands Artificial Intelligence Toolkit Market Estimates and Forecasts by Application (2020-2032) (USD Billion)
11.3.2.12.4 Netherlands Artificial Intelligence Toolkit Market Estimates and Forecasts by End-Use (2020-2032) (USD Billion)
11.3.2.13 Switzerland
11.3.2.13.1 Switzerland Artificial Intelligence Toolkit Market Estimates and Forecasts by Component (2020-2032) (USD Billion)
11.3.2.13.2 Switzerland Artificial Intelligence Toolkit Market Estimates and Forecasts By Type (2020-2032) (USD Billion)
11.3.2.13.3 Switzerland Artificial Intelligence Toolkit Market Estimates and Forecasts by Application (2020-2032) (USD Billion)
11.3.2.13.4 Switzerland Artificial Intelligence Toolkit Market Estimates and Forecasts by End-Use (2020-2032) (USD Billion)
11.3.2.14 Austria
11.3.2.14.1 Austria Artificial Intelligence Toolkit Market Estimates and Forecasts by Component (2020-2032) (USD Billion)
11.3.2.14.2 Austria Artificial Intelligence Toolkit Market Estimates and Forecasts By Type (2020-2032) (USD Billion)
11.3.2.14.3 Austria Artificial Intelligence Toolkit Market Estimates and Forecasts by Application (2020-2032) (USD Billion)
11.3.2.14.4 Austria Artificial Intelligence Toolkit Market Estimates and Forecasts by End-Use (2020-2032) (USD Billion)
11.3.2.15 Rest of Western Europe
11.3.2.15.1 Rest of Western Europe Artificial Intelligence Toolkit Market Estimates and Forecasts by Component (2020-2032) (USD Billion)
11.3.2.15.2 Rest of Western Europe Artificial Intelligence Toolkit Market Estimates and Forecasts By Type (2020-2032) (USD Billion)
11.3.2.15.3 Rest of Western Europe Artificial Intelligence Toolkit Market Estimates and Forecasts by Application (2020-2032) (USD Billion)
11.3.2.15.4 Rest of Western Europe Artificial Intelligence Toolkit Market Estimates and Forecasts by End-Use (2020-2032) (USD Billion)
11.4 Asia Pacific
11.4.1 Trend Analysis
11.4.2 Asia Pacific Artificial Intelligence Toolkit Market Estimates and Forecasts by Country (2020-2032) (USD Billion)
11.4.3 Asia Pacific Artificial Intelligence Toolkit Market Estimates and Forecasts by Component (2020-2032) (USD Billion)
11.4.4 Asia Pacific Artificial Intelligence Toolkit Market Estimates and Forecasts By Type (2020-2032) (USD Billion)
11.4.5 Asia Pacific Artificial Intelligence Toolkit Market Estimates and Forecasts by Application (2020-2032) (USD Billion)
11.4.6 Asia Pacific Artificial Intelligence Toolkit Market Estimates and Forecasts by End-Use (2020-2032) (USD Billion)
11.4.7 China
11.4.7.1 China Artificial Intelligence Toolkit Market Estimates and Forecasts by Component (2020-2032) (USD Billion)
11.4.7.2 China Artificial Intelligence Toolkit Market Estimates and Forecasts By Type (2020-2032) (USD Billion)
11.4.7.3 China Artificial Intelligence Toolkit Market Estimates and Forecasts by Application (2020-2032) (USD Billion)
11.4.7.4 China Artificial Intelligence Toolkit Market Estimates and Forecasts by End-Use (2020-2032) (USD Billion)
11.4.8 India
11.4.8.1 India Artificial Intelligence Toolkit Market Estimates and Forecasts by Component (2020-2032) (USD Billion)
11.4.8.2 India Artificial Intelligence Toolkit Market Estimates and Forecasts By Type (2020-2032) (USD Billion)
11.4.8.3 India Artificial Intelligence Toolkit Market Estimates and Forecasts by Application (2020-2032) (USD Billion)
11.4.8.4 India Artificial Intelligence Toolkit Market Estimates and Forecasts by End-Use (2020-2032) (USD Billion)
11.4.9 Japan
11.4.9.1 Japan Artificial Intelligence Toolkit Market Estimates and Forecasts by Component (2020-2032) (USD Billion)
11.4.9.2 Japan Artificial Intelligence Toolkit Market Estimates and Forecasts By Type (2020-2032) (USD Billion)
11.4.9.3 Japan Artificial Intelligence Toolkit Market Estimates and Forecasts by Application (2020-2032) (USD Billion)
11.4.9.4 Japan Artificial Intelligence Toolkit Market Estimates and Forecasts by End-Use (2020-2032) (USD Billion)
11.4.10 South Korea
11.4.10.1 South Korea Artificial Intelligence Toolkit Market Estimates and Forecasts by Component (2020-2032) (USD Billion)
11.4.10.2 South Korea Artificial Intelligence Toolkit Market Estimates and Forecasts By Type (2020-2032) (USD Billion)
11.4.10.3 South Korea Artificial Intelligence Toolkit Market Estimates and Forecasts by Application (2020-2032) (USD Billion)
11.4.10.4 South Korea Artificial Intelligence Toolkit Market Estimates and Forecasts by End-Use (2020-2032) (USD Billion)
11.4.11 Vietnam
11.4.11.1 Vietnam Artificial Intelligence Toolkit Market Estimates and Forecasts by Component (2020-2032) (USD Billion)
11.4.11.2 Vietnam Artificial Intelligence Toolkit Market Estimates and Forecasts By Type (2020-2032) (USD Billion)
11.4.11.3 Vietnam Artificial Intelligence Toolkit Market Estimates and Forecasts by Application (2020-2032) (USD Billion)
11.4.11.4 Vietnam Artificial Intelligence Toolkit Market Estimates and Forecasts by End-Use (2020-2032) (USD Billion)
11.4.12 Singapore
11.4.12.1 Singapore Artificial Intelligence Toolkit Market Estimates and Forecasts by Component (2020-2032) (USD Billion)
11.4.12.2 Singapore Artificial Intelligence Toolkit Market Estimates and Forecasts By Type (2020-2032) (USD Billion)
11.4.12.3 Singapore Artificial Intelligence Toolkit Market Estimates and Forecasts by Application (2020-2032) (USD Billion)
11.4.12.4 Singapore Artificial Intelligence Toolkit Market Estimates and Forecasts by End-Use (2020-2032) (USD Billion)
11.4.13 Australia
11.4.13.1 Australia Artificial Intelligence Toolkit Market Estimates and Forecasts by Component (2020-2032) (USD Billion)
11.4.13.2 Australia Artificial Intelligence Toolkit Market Estimates and Forecasts By Type (2020-2032) (USD Billion)
11.4.13.3 Australia Artificial Intelligence Toolkit Market Estimates and Forecasts by Application (2020-2032) (USD Billion)
11.4.13.4 Australia Artificial Intelligence Toolkit Market Estimates and Forecasts by End-Use (2020-2032) (USD Billion)
11.4.14 Rest of Asia Pacific
11.4.14.1 Rest of Asia Pacific Artificial Intelligence Toolkit Market Estimates and Forecasts by Component (2020-2032) (USD Billion)
11.4.14.2 Rest of Asia Pacific Artificial Intelligence Toolkit Market Estimates and Forecasts By Type (2020-2032) (USD Billion)
11.4.14.3 Rest of Asia Pacific Artificial Intelligence Toolkit Market Estimates and Forecasts by Application (2020-2032) (USD Billion)
11.4.14.4 Rest of Asia Pacific Artificial Intelligence Toolkit Market Estimates and Forecasts by End-Use (2020-2032) (USD Billion)
11.5 Middle East and Africa
11.5.1 Middle East
11.5.1.1 Trend Analysis
11.5.1.2 Middle East Artificial Intelligence Toolkit Market Estimates and Forecasts by Country (2020-2032) (USD Billion)
11.5.1.3 Middle East Artificial Intelligence Toolkit Market Estimates and Forecasts by Component (2020-2032) (USD Billion)
11.5.1.4 Middle East Artificial Intelligence Toolkit Market Estimates and Forecasts By Type (2020-2032) (USD Billion)
11.5.1.5 Middle East Artificial Intelligence Toolkit Market Estimates and Forecasts by Application (2020-2032) (USD Billion)
11.5.1.6 Middle East Artificial Intelligence Toolkit Market Estimates and Forecasts by End-Use (2020-2032) (USD Billion)
11.5.1.7 UAE
11.5.1.7.1 UAE Artificial Intelligence Toolkit Market Estimates and Forecasts by Component (2020-2032) (USD Billion)
11.5.1.7.2 UAE Artificial Intelligence Toolkit Market Estimates and Forecasts By Type (2020-2032) (USD Billion)
11.5.1.7.3 UAE Artificial Intelligence Toolkit Market Estimates and Forecasts by Application (2020-2032) (USD Billion)
11.5.1.7.4 UAE Artificial Intelligence Toolkit Market Estimates and Forecasts by End-Use (2020-2032) (USD Billion)
11.5.1.8 Egypt
11.5.1.8.1 Egypt Artificial Intelligence Toolkit Market Estimates and Forecasts by Component (2020-2032) (USD Billion)
11.5.1.8.2 Egypt Artificial Intelligence Toolkit Market Estimates and Forecasts By Type (2020-2032) (USD Billion)
11.5.1.8.3 Egypt Artificial Intelligence Toolkit Market Estimates and Forecasts by Application (2020-2032) (USD Billion)
11.5.1.8.4 Egypt Artificial Intelligence Toolkit Market Estimates and Forecasts by End-Use (2020-2032) (USD Billion)
11.5.1.9 Saudi Arabia
11.5.1.9.1 Saudi Arabia Artificial Intelligence Toolkit Market Estimates and Forecasts by Component (2020-2032) (USD Billion)
11.5.1.9.2 Saudi Arabia Artificial Intelligence Toolkit Market Estimates and Forecasts By Type (2020-2032) (USD Billion)
11.5.1.9.3 Saudi Arabia Artificial Intelligence Toolkit Market Estimates and Forecasts by Application (2020-2032) (USD Billion)
11.5.1.9.4 Saudi Arabia Artificial Intelligence Toolkit Market Estimates and Forecasts by End-Use (2020-2032) (USD Billion)
11.5.1.10 Qatar
11.5.1.10.1 Qatar Artificial Intelligence Toolkit Market Estimates and Forecasts by Component (2020-2032) (USD Billion)
11.5.1.10.2 Qatar Artificial Intelligence Toolkit Market Estimates and Forecasts By Type (2020-2032) (USD Billion)
11.5.1.10.3 Qatar Artificial Intelligence Toolkit Market Estimates and Forecasts by Application (2020-2032) (USD Billion)
11.5.1.10.4 Qatar Artificial Intelligence Toolkit Market Estimates and Forecasts by End-Use (2020-2032) (USD Billion)
11.5.1.11 Rest of Middle East
11.5.1.11.1 Rest of Middle East Artificial Intelligence Toolkit Market Estimates and Forecasts by Component (2020-2032) (USD Billion)
11.5.1.11.2 Rest of Middle East Artificial Intelligence Toolkit Market Estimates and Forecasts By Type (2020-2032) (USD Billion)
11.5.1.11.3 Rest of Middle East Artificial Intelligence Toolkit Market Estimates and Forecasts by Application (2020-2032) (USD Billion)
11.5.1.11.4 Rest of Middle East Artificial Intelligence Toolkit Market Estimates and Forecasts by End-Use (2020-2032) (USD Billion)
11.5.2 Africa
11.5.2.1 Trend Analysis
11.5.2.2 Africa Artificial Intelligence Toolkit Market Estimates and Forecasts by Country (2020-2032) (USD Billion)
11.5.2.3 Africa Artificial Intelligence Toolkit Market Estimates and Forecasts by Component (2020-2032) (USD Billion)
11.5.2.4 Africa Artificial Intelligence Toolkit Market Estimates and Forecasts By Type (2020-2032) (USD Billion)
11.5.2.5 Africa Artificial Intelligence Toolkit Market Estimates and Forecasts by Application (2020-2032) (USD Billion)
11.5.2.6 Africa Artificial Intelligence Toolkit Market Estimates and Forecasts by End-Use (2020-2032) (USD Billion)
11.5.2.7 South Africa
11.5.2.7.1 South Africa Artificial Intelligence Toolkit Market Estimates and Forecasts by Component (2020-2032) (USD Billion)
11.5.2.7.2 South Africa Artificial Intelligence Toolkit Market Estimates and Forecasts By Type (2020-2032) (USD Billion)
11.5.2.7.3 South Africa Artificial Intelligence Toolkit Market Estimates and Forecasts by Application (2020-2032) (USD Billion)
11.5.2.7.4 South Africa Artificial Intelligence Toolkit Market Estimates and Forecasts by End-Use (2020-2032) (USD Billion)
11.5.2.8 Nigeria
11.5.2.8.1 Nigeria Artificial Intelligence Toolkit Market Estimates and Forecasts by Component (2020-2032) (USD Billion)
11.5.2.8.2 Nigeria Artificial Intelligence Toolkit Market Estimates and Forecasts By Type (2020-2032) (USD Billion)
11.5.2.8.3 Nigeria Artificial Intelligence Toolkit Market Estimates and Forecasts by Application (2020-2032) (USD Billion)
11.5.2.8.4 Nigeria Artificial Intelligence Toolkit Market Estimates and Forecasts by End-Use (2020-2032) (USD Billion)
11.5.2.9 Rest of Africa
11.5.2.9.1 Rest of Africa Artificial Intelligence Toolkit Market Estimates and Forecasts by Component (2020-2032) (USD Billion)
11.5.2.9.2 Rest of Africa Artificial Intelligence Toolkit Market Estimates and Forecasts By Type (2020-2032) (USD Billion)
11.5.2.9.3 Rest of Africa Artificial Intelligence Toolkit Market Estimates and Forecasts by Application (2020-2032) (USD Billion)
11.5.2.9.4 Rest of Africa Artificial Intelligence Toolkit Market Estimates and Forecasts by End-Use (2020-2032) (USD Billion)
11.6 Latin America
11.6.1 Trend Analysis
11.6.2 Latin America Artificial Intelligence Toolkit Market Estimates and Forecasts by Country (2020-2032) (USD Billion)
11.6.3 Latin America Artificial Intelligence Toolkit Market Estimates and Forecasts by Component (2020-2032) (USD Billion)
11.6.4 Latin America Artificial Intelligence Toolkit Market Estimates and Forecasts By Type (2020-2032) (USD Billion)
11.6.5 Latin America Artificial Intelligence Toolkit Market Estimates and Forecasts by Application (2020-2032) (USD Billion)
11.6.6 Latin America Artificial Intelligence Toolkit Market Estimates and Forecasts by End-Use (2020-2032) (USD Billion)
11.6.7 Brazil
11.6.7.1 Brazil Artificial Intelligence Toolkit Market Estimates and Forecasts by Component (2020-2032) (USD Billion)
11.6.7.2 Brazil Artificial Intelligence Toolkit Market Estimates and Forecasts By Type (2020-2032) (USD Billion)
11.6.7.3 Brazil Artificial Intelligence Toolkit Market Estimates and Forecasts by Application (2020-2032) (USD Billion)
11.6.7.4 Brazil Artificial Intelligence Toolkit Market Estimates and Forecasts by End-Use (2020-2032) (USD Billion)
11.6.8 Argentina
11.6.8.1 Argentina Artificial Intelligence Toolkit Market Estimates and Forecasts by Component (2020-2032) (USD Billion)
11.6.8.2 Argentina Artificial Intelligence Toolkit Market Estimates and Forecasts By Type (2020-2032) (USD Billion)
11.6.8.3 Argentina Artificial Intelligence Toolkit Market Estimates and Forecasts by Application (2020-2032) (USD Billion)
11.6.8.4 Argentina Artificial Intelligence Toolkit Market Estimates and Forecasts by End-Use (2020-2032) (USD Billion)
11.6.9 Colombia
11.6.9.1 Colombia Artificial Intelligence Toolkit Market Estimates and Forecasts by Component (2020-2032) (USD Billion)
11.6.9.2 Colombia Artificial Intelligence Toolkit Market Estimates and Forecasts By Type (2020-2032) (USD Billion)
11.6.9.3 Colombia Artificial Intelligence Toolkit Market Estimates and Forecasts by Application (2020-2032) (USD Billion)
11.6.9.4 Colombia Artificial Intelligence Toolkit Market Estimates and Forecasts by End-Use (2020-2032) (USD Billion)
11.6.10 Rest of Latin America
11.6.10.1 Rest of Latin America Artificial Intelligence Toolkit Market Estimates and Forecasts by Component (2020-2032) (USD Billion)
11.6.10.2 Rest of Latin America Artificial Intelligence Toolkit Market Estimates and Forecasts By Type (2020-2032) (USD Billion)
11.6.10.3 Rest of Latin America Artificial Intelligence Toolkit Market Estimates and Forecasts by Application (2020-2032) (USD Billion)
11.6.10.4 Rest of Latin America Artificial Intelligence Toolkit Market Estimates and Forecasts by End-Use (2020-2032) (USD Billion)
12. Company Profiles
12.1 Google LLC
12.1.1 Company Overview
12.1.2 Financial
12.1.3 Products/ Services Offered
12.1.4 SWOT Analysis
12.2 Microsoft Corporation
12.2.1 Company Overview
12.2.2 Financial
12.2.3 Products/ Services Offered
12.2.4 SWOT Analysis
12.3 IBM Corporation
12.3.1 Company Overview
12.3.2 Financial
12.3.3 Products/ Services Offered
12.3.4 SWOT Analysis
12.4 Amazon Web Services, Inc.
12.4.1 Company Overview
12.4.2 Financial
12.4.3 Products/ Services Offered
12.4.4 SWOT Analysis
12.5 NVIDIA Corporation
12.5.1 Company Overview
12.5.2 Financial
12.5.3 Products/ Services Offered
12.5.4 SWOT Analysis
12.6 Meta Platforms, Inc.
12.6.1 Company Overview
12.6.2 Financial
12.6.3 Products/ Services Offered
12.6.4 SWOT Analysis
12.7 SAP SE
12.7.1 Company Overview
12.7.2 Financial
12.7.3 Products/ Services Offered
12.7.4 SWOT Analysis
12.8 Oracle Corporation
12.8.1 Company Overview
12.8.2 Financial
12.8.3 Products/ Services Offered
12.8.4 SWOT Analysis
12.9 H2O.ai, Inc
12.9.1 Company Overview
12.9.2 Financial
12.9.3 Products/ Services Offered
12.9.4 SWOT Analysis
12.10 DataRobot, Inc
12.10.1 Company Overview
12.10.2 Financial
12.10.3 Products/ Services Offered
12.10.4 SWOT Analysis
13. Use Cases and Best Practices
14. Conclusio
An accurate research report requires proper strategizing as well as implementation. There are multiple factors involved in the completion of good and accurate research report and selecting the best methodology to compete the research is the toughest part. Since the research reports we provide play a crucial role in any company’s decision-making process, therefore we at SNS Insider always believe that we should choose the best method which gives us results closer to reality. This allows us to reach at a stage wherein we can provide our clients best and accurate investment to output ratio.
Each report that we prepare takes a timeframe of 350-400 business hours for production. Starting from the selection of titles through a couple of in-depth brain storming session to the final QC process before uploading our titles on our website we dedicate around 350 working hours. The titles are selected based on their current market cap and the foreseen CAGR and growth.
The 5 steps process:
Step 1: Secondary Research:
Secondary Research or Desk Research is as the name suggests is a research process wherein, we collect data through the readily available information. In this process we use various paid and unpaid databases which our team has access to and gather data through the same. This includes examining of listed companies’ annual reports, Journals, SEC filling etc. Apart from this our team has access to various associations across the globe across different industries. Lastly, we have exchange relationships with various university as well as individual libraries.

Step 2: Primary Research
When we talk about primary research, it is a type of study in which the researchers collect relevant data samples directly, rather than relying on previously collected data. This type of research is focused on gaining content specific facts that can be sued to solve specific problems. Since the collected data is fresh and first hand therefore it makes the study more accurate and genuine.
We at SNS Insider have divided Primary Research into 2 parts.
Part 1 wherein we interview the KOLs of major players as well as the upcoming ones across various geographic regions. This allows us to have their view over the market scenario and acts as an important tool to come closer to the accurate market numbers. As many as 45 paid and unpaid primary interviews are taken from both the demand and supply side of the industry to make sure we land at an accurate judgement and analysis of the market.
This step involves the triangulation of data wherein our team analyses the interview transcripts, online survey responses and observation of on filed participants. The below mentioned chart should give a better understanding of the part 1 of the primary interview.

Part 2: In this part of primary research the data collected via secondary research and the part 1 of the primary research is validated with the interviews from individual consultants and subject matter experts.
Consultants are those set of people who have at least 12 years of experience and expertise within the industry whereas Subject Matter Experts are those with at least 15 years of experience behind their back within the same space. The data with the help of two main processes i.e., FGDs (Focused Group Discussions) and IDs (Individual Discussions). This gives us a 3rd party nonbiased primary view of the market scenario making it a more dependable one while collation of the data pointers.
Step 3: Data Bank Validation
Once all the information is collected via primary and secondary sources, we run that information for data validation. At our intelligence centre our research heads track a lot of information related to the market which includes the quarterly reports, the daily stock prices, and other relevant information. Our data bank server gets updated every fortnight and that is how the information which we collected using our primary and secondary information is revalidated in real time.

Step 4: QA/QC Process
After all the data collection and validation our team does a final level of quality check and quality assurance to get rid of any unwanted or undesired mistakes. This might include but not limited to getting rid of the any typos, duplication of numbers or missing of any important information. The people involved in this process include technical content writers, research heads and graphics people. Once this process is completed the title gets uploader on our platform for our clients to read it.
Step 5: Final QC/QA Process:
This is the last process and comes when the client has ordered the study. In this process a final QA/QC is done before the study is emailed to the client. Since we believe in giving our clients a good experience of our research studies, therefore, to make sure that we do not lack at our end in any way humanly possible we do a final round of quality check and then dispatch the study to the client.
Key Segments:
By Type
Open source
Commercial
By Component
Hardware
Software
Services
By Application
Natural language processing
Machine learning
Computer vision
Others
By End-Use
IT & telecom
Retail and e-commerce
BFSI
Manufacturing
Energy and utility
Government
Others
Request for Segment Customization as per your Business Requirement: Segment Customization Request
Regional Coverage:
North America
US
Canada
Mexico
Europe
Eastern Europe
Poland
Romania
Hungary
Turkey
Rest of Eastern Europe
Western Europe
Germany
France
UK
Italy
Spain
Netherlands
Switzerland
Austria
Rest of Western Europe
Asia Pacific
China
India
Japan
South Korea
Vietnam
Singapore
Australia
Rest of Asia Pacific
Middle East & Africa
Middle East
UAE
Egypt
Saudi Arabia
Qatar
Rest of Middle East
Africa
Nigeria
South Africa
Rest of Africa
Latin America
Brazil
Argentina
Colombia
Rest of Latin America
Request for Country Level Research Report: Country Level Customization Request
Available Customization
With the given market data, SNS Insider offers customization as per the company’s specific needs. The following customization options are available for the report:
Detailed Volume Analysis
Criss-Cross segment analysis (e.g. Product X Application)
Competitive Product Benchmarking
Geographic Analysis
Additional countries in any of the regions
Customized Data Representation
Detailed analysis and profiling of additional market players
The Human Resource Technology Market was USD 52.57 billion in 2023 and will reach to USD 106.54 billion by 2032, growing at a CAGR of 8.19% by 2024-2032.
The High Availability Server Market Size was USD 13.67 Billion in 2023 and will reach to USD 24.31 Billion by 2032 with a growing CAGR of 6.61% by 2024-2032.
Inventory Management Software Market Size was valued at USD 2.87 Billion in 2023 and will reach USD 5.40 Billion by 2032 and grow at a CAGR of 7.4% by 2032.
Small Language Model Market was valued at USD 7.9 billion in 2023 and is expected to reach USD 29.64 billion by 2032, growing at a CAGR of 15.86% by 2032.
MPLS IP VPN Market was valued at USD 60.69 billion in 2023 and is expected to reach USD 110.92 billion by 2032, growing at a CAGR of 6.99% from 2024-2032.
The Self-Service Analytics Market was valued at USD 4.5 billion in 2023 and will reach USD 19.75 billion by 2032, growing at a CAGR of 17.90% by 2032.

Hi! Click one of our member below to chat on Phone
© 2025 All Rights Reserved by SNS Insider Pvt Ltd


