Get More Information on Aroma Chemicals Market - Request Sample Report
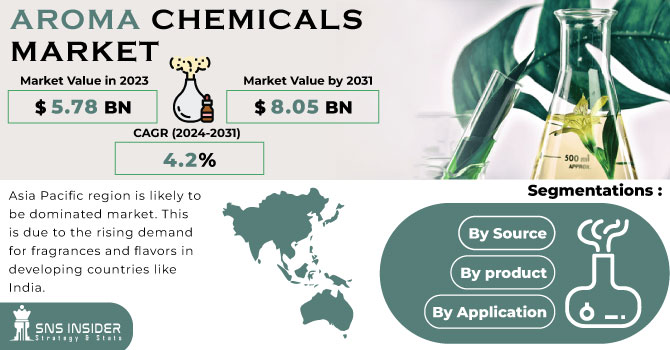
The Aroma Chemicals Market Size was valued at USD 5.59 Billion in 2023 and is expected to reach USD 8.66 Billion by 2032, growing at a CAGR of 4.99% over the forecast period of 2024-2032.
The Aroma Chemicals Market is witnessing dynamic growth, fueled by rising demand in fine fragrances, personal care, and food applications. Investment and expansion activities by key players are driving innovation, enhancing production capacities, and strengthening global footprints. Market dynamics are shaped by raw material price trends, where fluctuations in petrochemical and natural ingredient costs influence profitability. Shifting price trends of aroma chemicals reflect evolving consumer preferences, supply chain challenges, and advancements in synthetic production. Sustainability is a key focus, with eco-friendly initiatives promoting bio-based alternatives and green chemistry solutions. Meanwhile, stringent regulatory compliance and restrictions, including IFRA and REACH guidelines, continue to impact product formulations. Our report provides exclusive insights into these market forces, highlighting key opportunities and future growth trajectories.
Drivers
Increasing Consumer Preference for Natural and Sustainable Fragrances Fuels Growth in the Aroma Chemicals Market
As consumers become more aware of environmental sustainability, there is a noticeable shift towards natural and eco-friendly fragrances in various applications, including fine fragrances, personal care products, and food flavorings. This increasing preference for clean, green, and sustainable ingredients is driving demand for natural aroma chemicals. Manufacturers are investing heavily in the development of bio-based aroma chemicals, often derived from renewable plant sources. These natural alternatives are not only seen as environmentally friendly but also cater to the growing consumer trend towards transparency in product ingredients. This shift towards sustainability is supported by innovations in extraction and production methods, making natural ingredients more affordable and accessible. Moreover, the rising focus on sustainability in industries such as cosmetics and food further accelerate the adoption of natural aroma chemicals. This trend is expected to drive continued growth in the market, with natural aroma chemicals increasingly replacing synthetic variants, thus contributing to the expansion of market share for sustainable ingredients.
Restraints
High Raw Material Costs and Supply Chain Disruptions Affect Aroma Chemicals Market Growth
The aroma chemicals market is often impacted by fluctuations in the prices of raw materials, particularly those derived from petrochemicals and natural sources. The price volatility of key raw materials such as benzene, terpenes, and essential oils can lead to increased production costs, thereby affecting the overall pricing structure of aroma chemicals. Additionally, supply chain disruptions caused by geopolitical tensions, natural disasters, or the COVID-19 pandemic can exacerbate these issues. These disruptions can lead to shortages, delays, and higher costs for sourcing raw materials, which in turn may result in production delays and reduced profitability for manufacturers. The reliance on both natural and synthetic raw materials from different regions introduces complexities in securing a stable supply chain. As a result, manufacturers in the aroma chemicals industry face challenges in maintaining stable pricing and meeting consumer demand without compromising on product quality or production timelines.
Opportunities
Growing Trend for Sustainable and Natural Aroma Chemicals Creates New Product Development Opportunities
The global shift towards sustainability and eco-consciousness offers manufacturers a unique opportunity to develop and market sustainable aroma chemicals. With increasing consumer awareness of environmental impact and ethical sourcing, there is a growing demand for natural aroma chemicals derived from renewable resources, such as plant-based terpenes and essential oils. This trend is driving innovations in bio-based fragrance ingredients, allowing manufacturers to tap into the growing niche of clean, green, and cruelty-free products. Companies can focus on creating sustainable products that align with the clean label movement and cater to consumers seeking environmentally friendly alternatives. Additionally, advancements in green chemistry and fermentation technologies present new opportunities to develop aroma chemicals that are not only natural but also affordable and scalable for mass-market applications. By focusing on sustainability, companies can gain a competitive edge and differentiate themselves in a crowded market.
Challenge
Navigating the Volatile Regulatory Landscape and Its Impact on Aroma Chemicals Production
The volatile and evolving regulatory landscape presents a significant challenge for the aroma chemicals industry. Regulatory bodies continuously update safety standards, ingredient restrictions, and environmental guidelines, which can disrupt production processes and force manufacturers to reformulate their products. Compliance with various regional regulations, such as REACH in Europe or IFRA in the fragrance industry, requires constant vigilance and adaptation to ensure product formulations meet the latest safety requirements. Regulatory changes can also affect the availability of certain chemicals, which can result in supply shortages or the need to invest in alternative raw materials, further increasing production costs. Manufacturers must remain agile and invest in research and development to stay ahead of regulatory changes, ensuring compliance without compromising on product quality or profitability. This dynamic and unpredictable regulatory environment continues to challenge the industry, requiring manufacturers to invest in both legal expertise and product innovation.
By Source
In 2023, the synthetic segment dominated the Aroma Chemicals Market with a market share of 57.2%. This dominance can be attributed to the cost-effectiveness and scalability of synthetic aroma chemicals compared to their natural counterparts. Synthetic chemicals can be produced in large quantities at lower costs, making them the preferred choice for mass-market applications across various industries like personal care, food, and beverages. Organizations such as the International Fragrance Association (IFRA) and the American Chemical Society (ACS) continue to emphasize the importance of synthetic aroma chemicals, especially in regions where cost and availability of raw materials for natural alternatives are limitations. For instance, synthetic musks and benzenoids are widely used in the production of perfumes, and fragrance formulations for household products. The ability to replicate complex natural scents at a fraction of the cost positions synthetic aroma chemicals as the dominant source in the market.
By Product
The Terpenes/Terpenoids segment dominated the Aroma Chemicals Market in 2023, with a market share of 32.5%. Terpenes and terpenoids, primarily sourced from plants and flowers, are known for their versatile applications in fragrances, flavors, and personal care products. The demand for these natural aroma chemicals has been growing due to their safe, non-toxic properties and eco-friendly characteristics. Leading fragrance companies like Givaudan and Firmenich use terpenes for developing high-quality perfumes and aromatic products. Additionally, the growing consumer preference for natural ingredients in cosmetics and fragrances, spurred by organizations like the Global Sustainability Institute, supports the increasing market share of terpenes and terpenoids. The eco-conscious trend towards plant-based, sustainable ingredients continues to fuel the adoption of this segment, providing a competitive edge in the Aroma Chemicals Market.
By Application
Fine fragrances held the largest share of the Aroma Chemicals Market in 2023, with an estimated market share of 24.1%. The fine fragrances segment benefits from the growing demand for luxury and premium perfume products, which consistently use high-quality aroma chemicals. The rise in disposable income, particularly in emerging markets like Asia-Pacific, has led to an increased demand for branded perfumes, which significantly contributes to the growth of this segment. Renowned fragrance houses such as Chanel and Dior are known to incorporate premium aroma chemicals, including rare essential oils and synthetics, in their formulations. Associations such as the Fragrance Foundation play a pivotal role in promoting and advocating for high standards in the fine fragrances market, further boosting its dominance. Additionally, the fine fragrances sector has capitalized on consumer trends toward personalization and exclusivity, which continues to drive the segment's strong market performance.
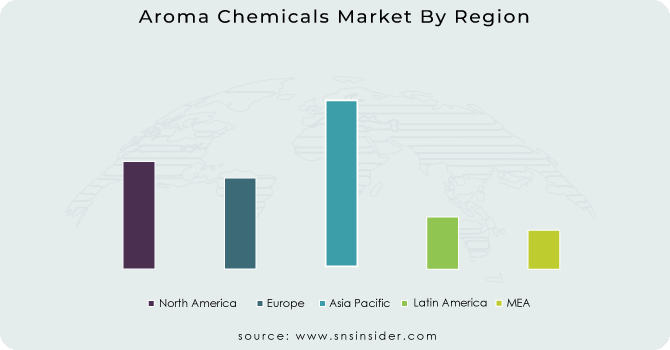
The Asia Pacific region dominated the Aroma Chemicals Market in 2023 with a market share of 35.9%. This dominance can be attributed to the region’s rapidly growing consumer base, particularly in countries like China, India, and Japan. China’s booming personal care industry, along with its strong manufacturing capabilities, supports the significant demand for both natural and synthetic aroma chemicals. India, with its growing middle class, has seen increased demand for fragrances in food, beverages, and cosmetics, propelling the need for aroma chemicals. Japan remains a strong player in the fragrance sector, leveraging its expertise in both high-quality natural and synthetic aroma chemicals. According to the International Trade Administration (ITA), China and India are expected to continue their robust growth, driving the demand for aroma chemicals, with China being one of the largest consumers globally. This market dominance is further fueled by the region’s large-scale manufacturing facilities, which are crucial for meeting global demand.
The North America region is the fastest-growing area in the Aroma Chemicals Market during the forecast period, with a significant growth rate. This growth is largely driven by the increasing demand for high-quality fragrance chemicals in the food, beverages, and personal care industries. The United States, in particular, is witnessing a surge in demand for eco-friendly and sustainable aroma chemicals, as consumers become more conscious of the ingredients used in their daily products. Companies like International Flavors & Fragrances Inc. (IFF) and Firmenich, both headquartered in the region, are spearheading the market growth with innovative product offerings, catering to the growing consumer demand for natural, organic, and sustainable fragrance solutions. Additionally, the ongoing expansion of fragrance production capabilities in Canada is expected to bolster regional market growth further. With advancements in research and development and growing consumer preference for premium fragrance products, North America is expected to witness rapid growth in the coming years.
Get Customized Report as per your Business Requirement - Request For Customized Report
A.C.S. International (Cinnamyl Alcohol, Phenyl Ethyl Alcohol)
BASF SE (Vanillin, Citral, Linalool)
Bedoukian Research, Inc. (Methyl Dihydrojasmonate, Ethyl Maltol, Hexyl Acetate)
Borregaard (Vanillin, Ethyl Vanillin, Guaiacol)
DSM (Canthaxanthin, Vanillin, Carotenoids)
Eternis Fine Chemicals Ltd. (Cashmeran, Iso E Super, Dihydromyrcenol)
Hindustan Mint & Agro Products Pvt. Ltd. (Menthol, Eugenol, Anethole)
Kalpsutra Chemicals Pvt. Ltd. (Anethole, Linalool, Citronellal)
Kao Corporation (Methyl Dihydrojasmonate, Hedione, Jasmine Lactone)
Lanxess AG (Dihydromyrcenol, Linalool, Terpineol)
Privi Organics India Limited (Dihydromyrcenol, Camphor, Acetophenone)
Robertet Group (Linalool, Geraniol, Beta-Ionone)
S H Kelkar and Company Limited (Keva) (Alpha-Ionone, Beta-Ionone, Gamma-Nonalactone)
Sensient Technologies Corporation (Methyl Anthranilate, Benzyl Acetate, Coumarin)
Silverline Chemicals (Linalool, Eugenol, Menthone)
Solvay (Vanillin, Eugenol, Guaiacol)
Symrise (Helional, Iso Bornyl Acetate, Acetophenone)
Takasago International Corporation (Galaxolide, Florhydral, Exaltone)
Treatt Plc (Lemon Oil Terpenes, Orange Oil Terpenes, Lime Oil Distillates)
Yingyang Aroma Chemical Group (Musk Xylene, Methyl Cedryl Ketone, Camphor)
May 2024: LANXESS presented its portfolio of sustainable aroma chemicals, including renewable-materials-based “Ultrapure Scopeblue” and Kalama benzyl benzoate, at SIMPPAR in France, targeting eco-conscious fragrance and cosmetics industries.
February 2023: International Flavors & Fragrances (IFF) announced the sale of its aroma chemicals business to a private equity firm for approximately $2 billion as part of a strategic restructuring to focus on its core fragrance and flavor operations.
| Report Attributes | Details |
|---|---|
| Market Size in 2023 | USD 5.59 Billion |
| Market Size by 2032 | USD 8.66 Billion |
| CAGR | CAGR of 4.99% From 2024 to 2032 |
| Base Year | 2023 |
| Forecast Period | 2024-2032 |
| Historical Data | 2020-2022 |
| Report Scope & Coverage | Market Size, Segments Analysis, Competitive Landscape, Regional Analysis, DROC & SWOT Analysis, Forecast Outlook |
| Key Segments | •By Source (Natural, Synthetic) •By Product (Benzenoids, Terpenes/Terpenoids, Musk Chemicals, Others) •By Application (Food & Beverages, Fine Fragrances, Cosmetics, Toiletries, Soaps & Detergents, Others) |
| Regional Analysis/Coverage | North America (US, Canada, Mexico), Europe (Eastern Europe [Poland, Romania, Hungary, Turkey, Rest of Eastern Europe] Western Europe] Germany, France, UK, Italy, Spain, Netherlands, Switzerland, Austria, Rest of Western Europe]), Asia Pacific (China, India, Japan, South Korea, Vietnam, Singapore, Australia, Rest of Asia Pacific), Middle East & Africa (Middle East [UAE, Egypt, Saudi Arabia, Qatar, Rest of Middle East], Africa [Nigeria, South Africa, Rest of Africa], Latin America (Brazil, Argentina, Colombia, Rest of Latin America) |
| Company Profiles | BASF SE, Solvay, Takasago International Corporation, Kao Corporation, Robertet Group, Privi Organics India Limited, S H Kelkar and Company Limited (Keva), DSM, Eternis Fine Chemicals Ltd., Kalpsutra Chemicals Pvt. Ltd. and other key players |
Ans: The Aroma Chemicals Market was valued at USD 5.59 billion in 2023.
Ans: The market is expected to grow at a CAGR of 4.99% over the forecast period.
Ans: Synthetic aroma chemicals held a 57.2% market share in 2023.
Ans: Navigating volatile regulatory changes is a significant challenge for the production of aroma chemicals.
Ans: Asia Pacific dominated the Aroma Chemicals Market with a 35.9% market share in 2023.
Table of Contents
1. Introduction
1.1 Market Definition
1.2 Scope (Inclusion and Exclusions)
1.3 Research Assumptions
2. Executive Summary
2.1 Market Overview
2.2 Regional Synopsis
2.3 Competitive Summary
3. Research Methodology
3.1 Top-Down Approach
3.2 Bottom-up Approach
3.3. Data Validation
3.4 Primary Interviews
4. Market Dynamics Impact Analysis
4.1 Market Driving Factors Analysis
4.1.1 Drivers
4.1.2 Restraints
4.1.3 Opportunities
4.1.4 Challenges
4.2 PESTLE Analysis
4.3 Porter’s Five Forces Model
5. Statistical Insights and Trends Reporting
5.1 Investment and Expansion Activities
5.2 Raw Material Price Trends
5.3 Price Trends of Aroma Chemicals
5.4 Sustainability & Eco-friendly Initiatives
5.5 Regulatory Compliance & Restrictions
6. Competitive Landscape
6.1 List of Major Companies, By Region
6.2 Market Share Analysis, By Region
6.3 Product Benchmarking
6.3.1 Product specifications and features
6.3.2 Pricing
6.4 Strategic Initiatives
6.4.1 Marketing and promotional activities
6.4.2 Distribution and supply chain strategies
6.4.3 Expansion plans and new product launches
6.4.4 Strategic partnerships and collaborations
6.5 Technological Advancements
6.6 Market Positioning and Branding
7. Aroma Chemicals Market Segmentation, by Source
7.1 Chapter Overview
7.2 Natural
7.2.1 Natural Market Trends Analysis (2020-2032)
7.2.2 Natural Market Size Estimates and Forecasts to 2032 (USD Billion)
7.3 Synthetic
7.3.1 Synthetic Market Trends Analysis (2020-2032)
7.3.2 Synthetic Market Size Estimates and Forecasts to 2032 (USD Billion)
8. Aroma Chemicals Market Segmentation, by Product
8.1 Chapter Overview
8.2 Benzenoids
8.2.1 Benzenoids Market Trends Analysis (2020-2032)
8.2.2 Benzenoids Market Size Estimates and Forecasts to 2032 (USD Billion)
8.3 Terpenes/Terpenoids
8.3.1 Terpenes/Terpenoids Market Trends Analysis (2020-2032)
8.3.2 Terpenes/Terpenoids Market Size Estimates and Forecasts to 2032 (USD Billion)
8.4 Musk Chemicals
8.4.1 Musk Chemicals Market Trends Analysis (2020-2032)
8.4.2 Musk Chemicals Market Size Estimates and Forecasts to 2032 (USD Billion)
8.5 Others
8.5.1 Others Market Trends Analysis (2020-2032)
8.5.2 Others Market Size Estimates and Forecasts to 2032 (USD Billion)
9. Aroma Chemicals Market Segmentation, by Application
9.1 Chapter Overview
9.2 Food & Beverages
9.2.1 Food & Beverages Market Trends Analysis (2020-2032)
9.2.2 Food & Beverages Market Size Estimates and Forecasts to 2032 (USD Billion)
9.3 Fine Fragrances
9.3.1 Fine Fragrances Market Trends Analysis (2020-2032)
9.3.2 Fine Fragrances Market Size Estimates and Forecasts to 2032 (USD Billion)
9.4 Cosmetics
9.4.1 Cosmetics Market Trends Analysis (2020-2032)
9.4.2 Cosmetics Market Size Estimates and Forecasts to 2032 (USD Billion)
9.5 Toiletries
9.5.1 Toiletries Market Trends Analysis (2020-2032)
9.5.2 Toiletries Market Size Estimates and Forecasts to 2032 (USD Billion)
9.6 Soaps & Detergents
9.6.1 Soaps & Detergents Market Trends Analysis (2020-2032)
9.6.2 Soaps & Detergents Market Size Estimates and Forecasts to 2032 (USD Billion)
9.7 Others
9.7.1 Others Market Trends Analysis (2020-2032)
9.7.2 Others Market Size Estimates and Forecasts to 2032 (USD Billion)
10. Regional Analysis
10.1 Chapter Overview
10.2 North America
10.2.1 Trends Analysis
10.2.2 North America Aroma Chemicals Market Estimates and Forecasts, by Country (2020-2032) (USD Billion)
10.2.3 North America Aroma Chemicals Market Estimates and Forecasts, by Source (2020-2032) (USD Billion)
10.2.4 North America Aroma Chemicals Market Estimates and Forecasts, by Product (2020-2032) (USD Billion)
10.2.5 North America Aroma Chemicals Market Estimates and Forecasts, by Application (2020-2032) (USD Billion)
10.2.6 USA
10.2.6.1 USA Aroma Chemicals Market Estimates and Forecasts, by Source (2020-2032) (USD Billion)
10.2.6.2 USA Aroma Chemicals Market Estimates and Forecasts, by Product (2020-2032) (USD Billion)
10.2.6.3 USA Aroma Chemicals Market Estimates and Forecasts, by Application (2020-2032) (USD Billion)
10.2.7 Canada
10.2.7.1 Canada Aroma Chemicals Market Estimates and Forecasts, by Source (2020-2032) (USD Billion)
10.2.7.2 Canada Aroma Chemicals Market Estimates and Forecasts, by Product (2020-2032) (USD Billion)
10.2.7.3 Canada Aroma Chemicals Market Estimates and Forecasts, by Application (2020-2032) (USD Billion)
10.2.8 Mexico
10.2.8.1 Mexico Aroma Chemicals Market Estimates and Forecasts, by Source (2020-2032) (USD Billion)
10.2.8.2 Mexico Aroma Chemicals Market Estimates and Forecasts, by Product (2020-2032) (USD Billion)
10.2.8.3 Mexico Aroma Chemicals Market Estimates and Forecasts, by Application (2020-2032) (USD Billion)
10.3 Europe
10.3.1 Eastern Europe
10.3.1.1 Trends Analysis
10.3.1.2 Eastern Europe Aroma Chemicals Market Estimates and Forecasts, by Country (2020-2032) (USD Billion)
10.3.1.3 Eastern Europe Aroma Chemicals Market Estimates and Forecasts, by Source (2020-2032) (USD Billion)
10.3.1.4 Eastern Europe Aroma Chemicals Market Estimates and Forecasts, by Product (2020-2032) (USD Billion)
10.3.1.5 Eastern Europe Aroma Chemicals Market Estimates and Forecasts, by Application (2020-2032) (USD Billion)
10.3.1.6 Poland
10.3.1.6.1 Poland Aroma Chemicals Market Estimates and Forecasts, by Source (2020-2032) (USD Billion)
10.3.1.6.2 Poland Aroma Chemicals Market Estimates and Forecasts, by Product (2020-2032) (USD Billion)
10.3.1.6.3 Poland Aroma Chemicals Market Estimates and Forecasts, by Application (2020-2032) (USD Billion)
10.3.1.7 Romania
10.3.1.7.1 Romania Aroma Chemicals Market Estimates and Forecasts, by Source (2020-2032) (USD Billion)
10.3.1.7.2 Romania Aroma Chemicals Market Estimates and Forecasts, by Product (2020-2032) (USD Billion)
10.3.1.7.3 Romania Aroma Chemicals Market Estimates and Forecasts, by Application (2020-2032) (USD Billion)
10.3.1.8 Hungary
10.3.1.8.1 Hungary Aroma Chemicals Market Estimates and Forecasts, by Source (2020-2032) (USD Billion)
10.3.1.8.2 Hungary Aroma Chemicals Market Estimates and Forecasts, by Product (2020-2032) (USD Billion)
10.3.1.8.3 Hungary Aroma Chemicals Market Estimates and Forecasts, by Application (2020-2032) (USD Billion)
10.3.1.9 Turkey
10.3.1.9.1 Turkey Aroma Chemicals Market Estimates and Forecasts, by Source (2020-2032) (USD Billion)
10.3.1.9.2 Turkey Aroma Chemicals Market Estimates and Forecasts, by Product (2020-2032) (USD Billion)
10.3.1.9.3 Turkey Aroma Chemicals Market Estimates and Forecasts, by Application (2020-2032) (USD Billion)
10.3.1.10 Rest of Eastern Europe
10.3.1.10.1 Rest of Eastern Europe Aroma Chemicals Market Estimates and Forecasts, by Source (2020-2032) (USD Billion)
10.3.1.10.2 Rest of Eastern Europe Aroma Chemicals Market Estimates and Forecasts, by Product (2020-2032) (USD Billion)
10.3.1.10.3 Rest of Eastern Europe Aroma Chemicals Market Estimates and Forecasts, by Application (2020-2032) (USD Billion)
10.3.2 Western Europe
10.3.2.1 Trends Analysis
10.3.2.2 Western Europe Aroma Chemicals Market Estimates and Forecasts, by Country (2020-2032) (USD Billion)
10.3.2.3 Western Europe Aroma Chemicals Market Estimates and Forecasts, by Source (2020-2032) (USD Billion)
10.3.2.4 Western Europe Aroma Chemicals Market Estimates and Forecasts, by Product (2020-2032) (USD Billion)
10.3.2.5 Western Europe Aroma Chemicals Market Estimates and Forecasts, by Application (2020-2032) (USD Billion)
10.3.2.6 Germany
10.3.2.6.1 Germany Aroma Chemicals Market Estimates and Forecasts, by Source (2020-2032) (USD Billion)
10.3.2.6.2 Germany Aroma Chemicals Market Estimates and Forecasts, by Product (2020-2032) (USD Billion)
10.3.2.6.3 Germany Aroma Chemicals Market Estimates and Forecasts, by Application (2020-2032) (USD Billion)
10.3.2.7 France
10.3.2.7.1 France Aroma Chemicals Market Estimates and Forecasts, by Source (2020-2032) (USD Billion)
10.3.2.7.2 France Aroma Chemicals Market Estimates and Forecasts, by Product (2020-2032) (USD Billion)
10.3.2.7.3 France Aroma Chemicals Market Estimates and Forecasts, by Application (2020-2032) (USD Billion)
10.3.2.8 UK
10.3.2.8.1 UK Aroma Chemicals Market Estimates and Forecasts, by Source (2020-2032) (USD Billion)
10.3.2.8.2 UK Aroma Chemicals Market Estimates and Forecasts, by Product (2020-2032) (USD Billion)
10.3.2.8.3 UK Aroma Chemicals Market Estimates and Forecasts, by Application (2020-2032) (USD Billion)
10.3.2.9 Italy
10.3.2.9.1 Italy Aroma Chemicals Market Estimates and Forecasts, by Source (2020-2032) (USD Billion)
10.3.2.9.2 Italy Aroma Chemicals Market Estimates and Forecasts, by Product (2020-2032) (USD Billion)
10.3.2.9.3 Italy Aroma Chemicals Market Estimates and Forecasts, by Application (2020-2032) (USD Billion)
10.3.2.10 Spain
10.3.2.10.1 Spain Aroma Chemicals Market Estimates and Forecasts, by Source (2020-2032) (USD Billion)
10.3.2.10.2 Spain Aroma Chemicals Market Estimates and Forecasts, by Product (2020-2032) (USD Billion)
10.3.2.10.3 Spain Aroma Chemicals Market Estimates and Forecasts, by Application (2020-2032) (USD Billion)
10.3.2.11 Netherlands
10.3.2.11.1 Netherlands Aroma Chemicals Market Estimates and Forecasts, by Source (2020-2032) (USD Billion)
10.3.2.11.2 Netherlands Aroma Chemicals Market Estimates and Forecasts, by Product (2020-2032) (USD Billion)
10.3.2.11.3 Netherlands Aroma Chemicals Market Estimates and Forecasts, by Application (2020-2032) (USD Billion)
10.3.2.12 Switzerland
10.3.2.12.1 Switzerland Aroma Chemicals Market Estimates and Forecasts, by Source (2020-2032) (USD Billion)
10.3.2.12.2 Switzerland Aroma Chemicals Market Estimates and Forecasts, by Product (2020-2032) (USD Billion)
10.3.2.12.3 Switzerland Aroma Chemicals Market Estimates and Forecasts, by Application (2020-2032) (USD Billion)
10.3.2.13 Austria
10.3.2.13.1 Austria Aroma Chemicals Market Estimates and Forecasts, by Source (2020-2032) (USD Billion)
10.3.2.13.2 Austria Aroma Chemicals Market Estimates and Forecasts, by Product (2020-2032) (USD Billion)
10.3.2.13.3 Austria Aroma Chemicals Market Estimates and Forecasts, by Application (2020-2032) (USD Billion)
10.3.2.14 Rest of Western Europe
10.3.2.14.1 Rest of Western Europe Aroma Chemicals Market Estimates and Forecasts, by Source (2020-2032) (USD Billion)
10.3.2.14.2 Rest of Western Europe Aroma Chemicals Market Estimates and Forecasts, by Product (2020-2032) (USD Billion)
10.3.2.14.3 Rest of Western Europe Aroma Chemicals Market Estimates and Forecasts, by Application (2020-2032) (USD Billion)
10.4 Asia Pacific
10.4.1 Trends Analysis
10.4.2 Asia Pacific Aroma Chemicals Market Estimates and Forecasts, by Country (2020-2032) (USD Billion)
10.4.3 Asia Pacific Aroma Chemicals Market Estimates and Forecasts, by Source (2020-2032) (USD Billion)
10.4.4 Asia Pacific Aroma Chemicals Market Estimates and Forecasts, by Product (2020-2032) (USD Billion)
10.4.5 Asia Pacific Aroma Chemicals Market Estimates and Forecasts, by Application (2020-2032) (USD Billion)
10.4.6 China
10.4.6.1 China Aroma Chemicals Market Estimates and Forecasts, by Source (2020-2032) (USD Billion)
10.4.6.2 China Aroma Chemicals Market Estimates and Forecasts, by Product (2020-2032) (USD Billion)
10.4.6.3 China Aroma Chemicals Market Estimates and Forecasts, by Application (2020-2032) (USD Billion)
10.4.7 India
10.4.7.1 India Aroma Chemicals Market Estimates and Forecasts, by Source (2020-2032) (USD Billion)
10.4.7.2 India Aroma Chemicals Market Estimates and Forecasts, by Product (2020-2032) (USD Billion)
10.4.7.3 India Aroma Chemicals Market Estimates and Forecasts, by Application (2020-2032) (USD Billion)
10.4.8 Japan
10.4.8.1 Japan Aroma Chemicals Market Estimates and Forecasts, by Source (2020-2032) (USD Billion)
10.4.8.2 Japan Aroma Chemicals Market Estimates and Forecasts, by Product (2020-2032) (USD Billion)
10.4.8.3 Japan Aroma Chemicals Market Estimates and Forecasts, by Application (2020-2032) (USD Billion)
10.4.9 South Korea
10.4.9.1 South Korea Aroma Chemicals Market Estimates and Forecasts, by Source (2020-2032) (USD Billion)
10.4.9.2 South Korea Aroma Chemicals Market Estimates and Forecasts, by Product (2020-2032) (USD Billion)
10.4.9.3 South Korea Aroma Chemicals Market Estimates and Forecasts, by Application (2020-2032) (USD Billion)
10.4.10 Vietnam
10.4.10.1 Vietnam Aroma Chemicals Market Estimates and Forecasts, by Source (2020-2032) (USD Billion)
10.4.10.2 Vietnam Aroma Chemicals Market Estimates and Forecasts, by Product (2020-2032) (USD Billion)
10.4.10.3 Vietnam Aroma Chemicals Market Estimates and Forecasts, by Application (2020-2032) (USD Billion)
10.4.11 Singapore
10.4.11.1 Singapore Aroma Chemicals Market Estimates and Forecasts, by Source (2020-2032) (USD Billion)
10.4.11.2 Singapore Aroma Chemicals Market Estimates and Forecasts, by Product (2020-2032) (USD Billion)
10.4.11.3 Singapore Aroma Chemicals Market Estimates and Forecasts, by Application (2020-2032) (USD Billion)
10.4.12 Australia
10.4.12.1 Australia Aroma Chemicals Market Estimates and Forecasts, by Source (2020-2032) (USD Billion)
10.4.12.2 Australia Aroma Chemicals Market Estimates and Forecasts, by Product (2020-2032) (USD Billion)
10.4.12.3 Australia Aroma Chemicals Market Estimates and Forecasts, by Application (2020-2032) (USD Billion)
10.4.13 Rest of Asia Pacific
10.4.13.1 Rest of Asia Pacific Aroma Chemicals Market Estimates and Forecasts, by Source (2020-2032) (USD Billion)
10.4.13.2 Rest of Asia Pacific Aroma Chemicals Market Estimates and Forecasts, by Product (2020-2032) (USD Billion)
10.4.13.3 Rest of Asia Pacific Aroma Chemicals Market Estimates and Forecasts, by Application (2020-2032) (USD Billion)
10.5 Middle East and Africa
10.5.1 Middle East
10.5.1.1 Trends Analysis
10.5.1.2 Middle East Aroma Chemicals Market Estimates and Forecasts, by Country (2020-2032) (USD Billion)
10.5.1.3 Middle East Aroma Chemicals Market Estimates and Forecasts, by Source (2020-2032) (USD Billion)
10.5.1.4 Middle East Aroma Chemicals Market Estimates and Forecasts, by Product (2020-2032) (USD Billion)
10.5.1.5 Middle East Aroma Chemicals Market Estimates and Forecasts, by Application (2020-2032) (USD Billion)
10.5.1.6 UAE
10.5.1.6.1 UAE Aroma Chemicals Market Estimates and Forecasts, by Source (2020-2032) (USD Billion)
10.5.1.6.2 UAE Aroma Chemicals Market Estimates and Forecasts, by Product (2020-2032) (USD Billion)
10.5.1.6.3 UAE Aroma Chemicals Market Estimates and Forecasts, by Application (2020-2032) (USD Billion)
10.5.1.7 Egypt
10.5.1.7.1 Egypt Aroma Chemicals Market Estimates and Forecasts, by Source (2020-2032) (USD Billion)
10.5.1.7.2 Egypt Aroma Chemicals Market Estimates and Forecasts, by Product (2020-2032) (USD Billion)
10.5.1.7.3 Egypt Aroma Chemicals Market Estimates and Forecasts, by Application (2020-2032) (USD Billion)
10.5.1.8 Saudi Arabia
10.5.1.8.1 Saudi Arabia Aroma Chemicals Market Estimates and Forecasts, by Source (2020-2032) (USD Billion)
10.5.1.8.2 Saudi Arabia Aroma Chemicals Market Estimates and Forecasts, by Product (2020-2032) (USD Billion)
10.5.1.8.3 Saudi Arabia Aroma Chemicals Market Estimates and Forecasts, by Application (2020-2032) (USD Billion)
10.5.1.9 Qatar
10.5.1.9.1 Qatar Aroma Chemicals Market Estimates and Forecasts, by Source (2020-2032) (USD Billion)
10.5.1.9.2 Qatar Aroma Chemicals Market Estimates and Forecasts, by Product (2020-2032) (USD Billion)
10.5.1.9.3 Qatar Aroma Chemicals Market Estimates and Forecasts, by Application (2020-2032) (USD Billion)
10.5.1.10 Rest of Middle East
10.5.1.10.1 Rest of Middle East Aroma Chemicals Market Estimates and Forecasts, by Source (2020-2032) (USD Billion)
10.5.1.10.2 Rest of Middle East Aroma Chemicals Market Estimates and Forecasts, by Product (2020-2032) (USD Billion)
10.5.1.10.3 Rest of Middle East Aroma Chemicals Market Estimates and Forecasts, by Application (2020-2032) (USD Billion)
10.5.2 Africa
10.5.2.1 Trends Analysis
10.5.2.2 Africa Aroma Chemicals Market Estimates and Forecasts, by Country (2020-2032) (USD Billion)
10.5.2.3 Africa Aroma Chemicals Market Estimates and Forecasts, by Source (2020-2032) (USD Billion)
10.5.2.4 Africa Aroma Chemicals Market Estimates and Forecasts, by Product (2020-2032) (USD Billion)
10.5.2.5 Africa Aroma Chemicals Market Estimates and Forecasts, by Application (2020-2032) (USD Billion)
10.5.2.6 South Africa
10.5.2.6.1 South Africa Aroma Chemicals Market Estimates and Forecasts, by Source (2020-2032) (USD Billion)
10.5.2.6.2 South Africa Aroma Chemicals Market Estimates and Forecasts, by Product (2020-2032) (USD Billion)
10.5.2.6.3 South Africa Aroma Chemicals Market Estimates and Forecasts, by Application (2020-2032) (USD Billion)
10.5.2.7 Nigeria
10.5.2.7.1 Nigeria Aroma Chemicals Market Estimates and Forecasts, by Source (2020-2032) (USD Billion)
10.5.2.7.2 Nigeria Aroma Chemicals Market Estimates and Forecasts, by Product (2020-2032) (USD Billion)
10.5.2.7.3 Nigeria Aroma Chemicals Market Estimates and Forecasts, by Application (2020-2032) (USD Billion)
10.5.2.8 Rest of Africa
10.5.2.8.1 Rest of Africa Aroma Chemicals Market Estimates and Forecasts, by Source (2020-2032) (USD Billion)
10.5.2.8.2 Rest of Africa Aroma Chemicals Market Estimates and Forecasts, by Product (2020-2032) (USD Billion)
10.5.2.8.3 Rest of Africa Aroma Chemicals Market Estimates and Forecasts, by Application (2020-2032) (USD Billion)
10.6 Latin America
10.6.1 Trends Analysis
10.6.2 Latin America Aroma Chemicals Market Estimates and Forecasts, by Country (2020-2032) (USD Billion)
10.6.3 Latin America Aroma Chemicals Market Estimates and Forecasts, by Source (2020-2032) (USD Billion)
10.6.4 Latin America Aroma Chemicals Market Estimates and Forecasts, by Product (2020-2032) (USD Billion)
10.6.5 Latin America Aroma Chemicals Market Estimates and Forecasts, by Application (2020-2032) (USD Billion)
10.6.6 Brazil
10.6.6.1 Brazil Aroma Chemicals Market Estimates and Forecasts, by Source (2020-2032) (USD Billion)
10.6.6.2 Brazil Aroma Chemicals Market Estimates and Forecasts, by Product (2020-2032) (USD Billion)
10.6.6.3 Brazil Aroma Chemicals Market Estimates and Forecasts, by Application (2020-2032) (USD Billion)
10.6.7 Argentina
10.6.7.1 Argentina Aroma Chemicals Market Estimates and Forecasts, by Source (2020-2032) (USD Billion)
10.6.7.2 Argentina Aroma Chemicals Market Estimates and Forecasts, by Product (2020-2032) (USD Billion)
10.6.7.3 Argentina Aroma Chemicals Market Estimates and Forecasts, by Application (2020-2032) (USD Billion)
10.6.8 Colombia
10.6.8.1 Colombia Aroma Chemicals Market Estimates and Forecasts, by Source (2020-2032) (USD Billion)
10.6.8.2 Colombia Aroma Chemicals Market Estimates and Forecasts, by Product (2020-2032) (USD Billion)
10.6.8.3 Colombia Aroma Chemicals Market Estimates and Forecasts, by Application (2020-2032) (USD Billion)
10.6.9 Rest of Latin America
10.6.9.1 Rest of Latin America Aroma Chemicals Market Estimates and Forecasts, by Source (2020-2032) (USD Billion)
10.6.9.2 Rest of Latin America Aroma Chemicals Market Estimates and Forecasts, by Product (2020-2032) (USD Billion)
10.6.9.3 Rest of Latin America Aroma Chemicals Market Estimates and Forecasts, by Application (2020-2032) (USD Billion)
11. Company Profiles
11.1 BASF SE
11.1.1 Company Overview
11.1.2 Financial
11.1.3 Products/ Services Offered
11.1.4 SWOT Analysis
11.2 Solvay
11.2.1 Company Overview
11.2.2 Financial
11.2.3 Products/ Services Offered
11.2.4 SWOT Analysis
11.3 Takasago International Corporation
11.3.1 Company Overview
11.3.2 Financial
11.3.3 Products/ Services Offered
11.3.4 SWOT Analysis
11.4 Kao Corporation
11.4.1 Company Overview
11.4.2 Financial
11.4.3 Products/ Services Offered
11.4.4 SWOT Analysis
11.5 Robertet Group
11.5.1 Company Overview
11.5.2 Financial
11.5.3 Products/ Services Offered
11.5.4 SWOT Analysis
11.6 Privi Organics India Limited
11.6.1 Company Overview
11.6.2 Financial
11.6.3 Products/ Services Offered
11.6.4 SWOT Analysis
11.7 S H Kelkar and Company Limited (Keva)
11.7.1 Company Overview
11.7.2 Financial
11.7.3 Products/ Services Offered
11.7.4 SWOT Analysis
11.8 DSM
11.8.1 Company Overview
11.8.2 Financial
11.8.3 Products/ Services Offered
11.8.4 SWOT Analysis
11.9 Eternis Fine Chemicals Ltd.
11.9.1 Company Overview
11.9.2 Financial
11.9.3 Products/ Services Offered
11.9.4 SWOT Analysis
11.10 Kalpsutra Chemicals Pvt. Ltd.
11.10.1 Company Overview
11.10.2 Financial
11.10.3 Products/ Services Offered
11.10.4 SWOT Analysis
12. Use Cases and Best Practices
13. Conclusion
An accurate research report requires proper strategizing as well as implementation. There are multiple factors involved in the completion of good and accurate research report and selecting the best methodology to compete the research is the toughest part. Since the research reports we provide play a crucial role in any company’s decision-making process, therefore we at SNS Insider always believe that we should choose the best method which gives us results closer to reality. This allows us to reach at a stage wherein we can provide our clients best and accurate investment to output ratio.
Each report that we prepare takes a timeframe of 350-400 business hours for production. Starting from the selection of titles through a couple of in-depth brain storming session to the final QC process before uploading our titles on our website we dedicate around 350 working hours. The titles are selected based on their current market cap and the foreseen CAGR and growth.
The 5 steps process:
Step 1: Secondary Research:
Secondary Research or Desk Research is as the name suggests is a research process wherein, we collect data through the readily available information. In this process we use various paid and unpaid databases which our team has access to and gather data through the same. This includes examining of listed companies’ annual reports, Journals, SEC filling etc. Apart from this our team has access to various associations across the globe across different industries. Lastly, we have exchange relationships with various university as well as individual libraries.

Step 2: Primary Research
When we talk about primary research, it is a type of study in which the researchers collect relevant data samples directly, rather than relying on previously collected data. This type of research is focused on gaining content specific facts that can be sued to solve specific problems. Since the collected data is fresh and first hand therefore it makes the study more accurate and genuine.
We at SNS Insider have divided Primary Research into 2 parts.
Part 1 wherein we interview the KOLs of major players as well as the upcoming ones across various geographic regions. This allows us to have their view over the market scenario and acts as an important tool to come closer to the accurate market numbers. As many as 45 paid and unpaid primary interviews are taken from both the demand and supply side of the industry to make sure we land at an accurate judgement and analysis of the market.
This step involves the triangulation of data wherein our team analyses the interview transcripts, online survey responses and observation of on filed participants. The below mentioned chart should give a better understanding of the part 1 of the primary interview.

Part 2: In this part of primary research the data collected via secondary research and the part 1 of the primary research is validated with the interviews from individual consultants and subject matter experts.
Consultants are those set of people who have at least 12 years of experience and expertise within the industry whereas Subject Matter Experts are those with at least 15 years of experience behind their back within the same space. The data with the help of two main processes i.e., FGDs (Focused Group Discussions) and IDs (Individual Discussions). This gives us a 3rd party nonbiased primary view of the market scenario making it a more dependable one while collation of the data pointers.
Step 3: Data Bank Validation
Once all the information is collected via primary and secondary sources, we run that information for data validation. At our intelligence centre our research heads track a lot of information related to the market which includes the quarterly reports, the daily stock prices, and other relevant information. Our data bank server gets updated every fortnight and that is how the information which we collected using our primary and secondary information is revalidated in real time.

Step 4: QA/QC Process
After all the data collection and validation our team does a final level of quality check and quality assurance to get rid of any unwanted or undesired mistakes. This might include but not limited to getting rid of the any typos, duplication of numbers or missing of any important information. The people involved in this process include technical content writers, research heads and graphics people. Once this process is completed the title gets uploader on our platform for our clients to read it.
Step 5: Final QC/QA Process:
This is the last process and comes when the client has ordered the study. In this process a final QA/QC is done before the study is emailed to the client. Since we believe in giving our clients a good experience of our research studies, therefore, to make sure that we do not lack at our end in any way humanly possible we do a final round of quality check and then dispatch the study to the client.
Key Segments:
By Source
Natural
Synthetic
By Product
Benzenoids
Terpenes/Terpenoids
Musk Chemicals
Others
By Application
Food & Beverages
Fine Fragrances
Cosmetics
Toiletries
Soaps & Detergents
Others
Request for Segment Customization as per your Business Requirement: Segment Customization Request
Regional Coverage:
North America
US
Canada
Mexico
Europe
Eastern Europe
Poland
Romania
Hungary
Turkey
Rest of Eastern Europe
Western Europe
Germany
France
UK
Italy
Spain
Netherlands
Switzerland
Austria
Rest of Western Europe
Asia Pacific
China
India
Japan
South Korea
Vietnam
Singapore
Australia
Rest of Asia Pacific
Middle East & Africa
Middle East
UAE
Egypt
Saudi Arabia
Qatar
Rest of Middle East
Africa
Nigeria
South Africa
Rest of Africa
Latin America
Brazil
Argentina
Colombia
Rest of Latin America
Request for Country Level Research Report: Country Level Customization Request
Available Customization
With the given market data, SNS Insider offers customization as per the company’s specific needs. The following customization options are available for the report:
Detailed Volume Analysis
Criss-Cross segment analysis (e.g. Product X Application)
Competitive Product Benchmarking
Geographic Analysis
Additional countries in any of the regions
Customized Data Representation
Detailed analysis and profiling of additional market players
The Industrial Wastewater Treatment Chemicals Market Size was valued at USD 15.28 billion in 2023, and is expected to reach USD 23.58 billion by 2032, and grow at a CAGR of 5.66% over the forecast period 2024-2032.
The Thermal Interface Materials Market size was valued at USD 3.71 billion in 2023 and is expected to reach USD 9.49 billion by 2032, with a growing at CAGR of 11.02% over the forecast period 2024-2032.
The Cryogenic Fuels Market Size was valued at USD 112.57 billion in 2023 and is expected to reach USD 195.08 billion by 2032 and grow at a CAGR of 6.30% over the forecast period 2024-2032.
Structural Adhesive Tapes Market was valued at USD 10.71 Bn in 2023 and is expected to reach USD 16.32 Bn by 2032, growing at a CAGR of 4.80% from 2024-2032.
The Guaiacol Market size was valued at USD 321.05 million in 2023 and is expected to reach USD 367.08 million by 2032 and grow at a CAGR of 1.50% over the forecast period of 2024-2032.
The Acid Dyes Market Size was valued at USD 1.5 billion in 2023 and is expected to reach USD 2.5 billion by 2032 and grow at a CAGR of 5.7% from 2024 to 2032.

Hi! Click one of our member below to chat on Phone
© 2025 All Rights Reserved by SNS Insider Pvt Ltd


