To get more information on Armored Vehicle Fire Suppression Systems Market - Request Sample Report
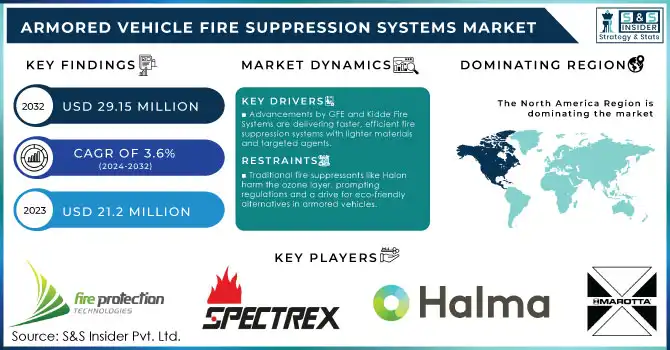
The Armored Vehicle Fire Suppression Systems Market size was valued at USD 21.2 million in 2023 and is expected to reach USD 29.15 million by 2032, growing at a CAGR of 3.6% over the forecast period of 2024-2032.
The armored vehicle fire suppression systems market is poised for steady growth driven by the paramount need for crew safety, rising defense budgets, and advancements in eco-friendly technologies. Crew safety remains paramount for militaries worldwide. Fire suppression systems are a frontline defense against fires caused by accidents, enemy attacks, or malfunctions. A 2023 study by the Stockholm International Peace Research Institute (SIPRI) revealed a concerning rise in military personnel casualties due to vehicle fires during conflicts. This has intensified the focus on implementing robust fire suppression systems, propelling market growth. also, Geopolitical tensions and ongoing conflicts are leading to a significant rise in global defense spending. A 2024 report forecasts a 12% increase in North American defense spending alone, with a portion allocated to armored vehicle upgrades, including fire suppression systems. This surge in defense budgets translates to increased investment in crew safety technologies, creating significant opportunities for fire suppression system manufacturers.
Furthermore, The market is witnessing exciting advancements in fire suppression technology. Companies like Marotta Controls and Oshkosh Corporation are developing more efficient and faster-reacting systems using lighter materials and targeted suppression agents. Additionally, environmental concerns surrounding traditional fire suppression agents like Halon are pushing the industry towards eco-friendly alternatives. For instance, Chemguard Inc. offers a fluorine-free fire suppression agent specifically designed for military applications. This focus on eco-friendly solutions is expected to be a major growth driver in the coming years.
KEY DRIVERS:
Heightened Focus on Crew Safety
Technological Advancements like GFE and Kidde Fire Systems are developing more efficient and faster-reacting fire suppression systems, using lighter materials and more targeted suppression agents.
The Rising Defense Expenditure drive the market growth.
Increased geopolitical tensions and ongoing conflicts are leading to a rise in global defense spending. This leads to increased budgets for military vehicle modernization, including fire suppression systems. For instance, the United States requested a record-breaking $813.3 billion for its 2024 defense budget, with a portion allocated to armored vehicle upgrades.
RESTRAINTS:
Traditional fire suppressants like Halon harm the ozone layer, prompting regulations and a drive for eco-friendly alternatives in armored vehicles.
High Integration Costs
Integrating advanced fire suppression systems into existing armored vehicles can be a complex and expensive process. This can be a hurdle for some militaries with limited budgets.
OPPORTUNITIES:
Focus on Regional Production, creates an opportunity for local fire suppression system manufacturers to partner with defense contractors.
The Growing Demand for Modernized Fleets
Many countries are looking to modernize their aging armored vehicle fleets. This presents an opportunity for manufacturers to supply new vehicles equipped with advanced fire suppression systems.
CHALLENGES:
The battlefield landscape is constantly evolving, with new threats emerging like improvised explosive devices (IEDs).
The Integration of Stringent Testing and Certification
Military fire suppression systems undergo rigorous testing and certification procedures to ensure their effectiveness and reliability in harsh environments. This can be a lengthy and costly process for manufacturers.
The war highlighted the critical role of armored vehicles in modern warfare. But this could led to the depletion of stocks of these vehicles in some countries supporting Ukraine. This creates an urgent need for new armor, many of which require the integration of advanced fire suppression systems. A report by the Center for Strategic and International Studies (CSIS) estimates that Ukraine and its allies have lost or disabled more than 8,000 armored vehicles since the start of the war, creating a significant need for replacement vehicles. This increase in demand is expected to drive market growth. The war also disrupted the global supply chains and affected the availability of raw materials and components for firefighting systems. This may cause production delays and possible price fluctuations for these systems. For example, a recent report by McKinsey and Company indicates that raw material costs for defense equipment could rise by 20% due to the impact of the war on global supply chains. Manufacturers must adapt their supply strategies and localize production where possible to mitigate these disruptions. The war triggered a reassessment of the defense capabilities of several countries, especially in Europe. In the long term, this may lead to an increase in defense spending, part of which will be directed to the modernization and purchase of armor. This long-term market expansion will benefit fire suppression system manufacturers who can provide reliable and customization solutions.
A economic slowdown could lead to tightened government budgets, potentially impacting defense spending. This could result in cuts to military vehicle procurement programs, including those for armored vehicles. Reduced demand for new armored vehicles would leads to a decrease in the demand for integrated fire suppression systems. An economic slowdown may lead to militaries extending the lifespan of their existing armored vehicles. This would create a larger market for spare parts and maintenance of fire suppression systems, presenting an opportunity for companies specializing in the aftermarket. also, During economic downturns, a focus on cost-efficiency becomes paramount. Fire suppression system manufacturers who can offer reliable and effective systems at competitive prices are likely to see increased demand. This could lead to a rise in competition and potentially drive innovation in cost-effective fire suppression technologies.
By Vehicle Type
Combat Vehicles
Troop Transport Vehicles
Others Vehicles Type
Based on Vehicle Type, Combat vehicles dominate the armored vehicle fire suppression systems market with approx more than 70 % market share in the forecasted period, due to the critical need for crew safety in high-risk environments. Combat vehicles, including main battle tanks, infantry fighting vehicles, and armored personnel carriers, form the backbone of modern ground forces. These vehicles operate in high-risk environments where fire hazards are prevalent due to enemy attacks, accidents, or malfunctions. However, the Other Vehicle Types segment is expected to witness the fastest growth driven by the expanding use of specialized armored vehicles and a growing emphasis on crew safety across all armored platforms.
REGIONAL ANALYSES
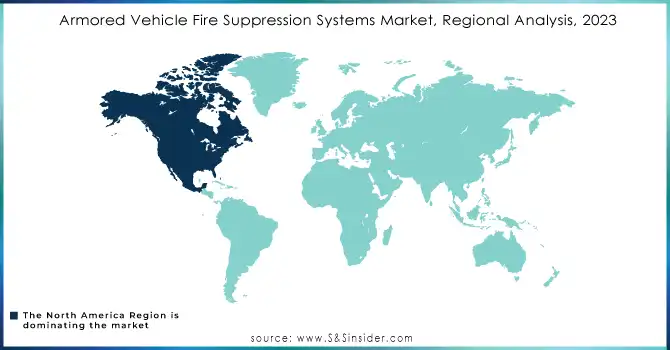
North America has traditionally been the dominant region in the armored vehicle fire suppression systems market due to High defense spending by the United States, a major global military power. and the Focus on advanced technology and crew safety in US armored vehicles. for eg, The US Army awarded a $25 million contract to General Dynamics Ordnance and Tactical Systems for the development and supply of next-generation fire suppression systems for its new AbramsX main battle tank program. This signifies the US military's continued commitment to cutting-edge technology in crew safety. While North America remains a leader, the market might face a period of maturation due to A large existing fleet of armored vehicles, potentially leading to a saturation in demand for new systems for these platforms. Stringent regulations and focus on aftermarket solutions could create opportunities despite slower growth in new vehicle procurement.
In the Asia-Pacific region, the market for armored fire fighting systems has seen significant growth due to the rapid military modernization program implemented in countries such as China and India. and an increasing focus on regional security and potential geopolitical tensions. Also, expanding the production capacity of domestic fire extinguishing system manufacturers. For example, in May 2024, China introduced its newest main battle tank, the ZTQ-17, Defense Expo. This advanced tank is expected to be equipped with advanced fire suppression systems, reflecting the modernization of China's armored vehicle fleet.
To Get Customized Report as per your Business Requirement - Request For Customized Report
REGIONAL COVERAGE:
North America
US
Canada
Mexico
Europe
Eastern Europe
Poland
Romania
Hungary
Turkey
Rest of Eastern Europe
Western Europe
Germany
France
UK
Italy
Spain
Netherlands
Switzerland
Austria
Rest of Western Europe
Asia Pacific
China
India
Japan
South Korea
Vietnam
Singapore
Australia
Rest of Asia Pacific
Middle East & Africa
Middle East
UAE
Egypt
Saudi Arabia
Qatar
Rest of the Middle East
Africa
Nigeria
South Africa
Rest of Africa
Latin America
Brazil
Argentina
Colombia
Rest of Latin America
The major key players are Fire Protection Technologies Pty Ltd., Spectrex Inc., Halma plc, N2 Towers Inc., Marotta Controls Inc., Nero Industries, ExploSpot Systems Pty Ltd, Mikro-Pulssi Oy, Bulldog Direct Protective Systems, Kidde-Deugra Brandschutzsysteme GmbH, and other key players.
In May 19, 2024, Oshkosh Corporation unveils its new ATLAS Next Generation Combat Vehicle (NGCV) at a military expo. This advanced combat vehicle features an integrated fire suppression system designed for superior performance and crew protection. Oshkosh emphasizes the system's lightweight design and faster response time compared to traditional fire suppression systems.
In May 10, 2024, BAE Systems successfully completes live-fire testing of its new fire suppression system for armored personnel carriers (APCs). This test demonstrates the system's effectiveness in extinguishing fires caused by enemy attacks or internal malfunctions, showcasing advancements in real-world performance of fire suppression technology.
Report Attributes | Details |
---|---|
Market Size in 2023 | US$ 21.2 Million |
Market Size by 2031 | US$ 28.1 Million |
CAGR | CAGR of 3.6% From 2024 to 2031 |
Base Year | 2023 |
Forecast Period | 2024-2031 |
Historical Data | 2020-2022 |
Report Scope & Coverage | Market Size, Segments Analysis, Competitive Landscape, Regional Analysis, DROC & SWOT Analysis, Forecast Outlook |
Key Segments | • By Vehicle Type (Combat Vehicles, Troop Transport Vehicles, Other Vehicle Types) |
Regional Analysis/Coverage | North America (US, Canada, Mexico), Europe (Eastern Europe [Poland, Romania, Hungary, Turkey, Rest of Eastern Europe] Western Europe] Germany, France, UK, Italy, Spain, Netherlands, Switzerland, Austria, Rest of Western Europe]), Asia Pacific (China, India, Japan, South Korea, Vietnam, Singapore, Australia, Rest of Asia Pacific), Middle East & Africa (Middle East [UAE, Egypt, Saudi Arabia, Qatar, Rest of Middle East], Africa [Nigeria, South Africa, Rest of Africa], Latin America (Brazil, Argentina, Colombia, Rest of Latin America) |
Company Profiles | Fire Protection Technologies Pty Ltd., Spectrex Inc., Halma plc, N2 Towers Inc., Marotta Controls Inc., Nero Industries, ExploSpot Systems Pty Ltd, Mikro-Pulssi Oy, Bulldog Direct Protective Systems, Kidde-Deugra Brandschutzsysteme GmbH |
Key Drivers | • Heightened Focus on Crew Safety • Technological Advancements like GFE and Kidde Fire Systems are developing more efficient and faster-reacting fire suppression systems, using lighter materials and more targeted suppression agents. • The Rising Defense Expenditure drive the market growth. |
Restraints | • Traditional fire suppressants like Halon harm the ozone layer, prompting regulations and a drive for eco-friendly alternatives in armored vehicles. • High Integration Costs |
Ans. The market size of the Armored Vehicle Fire Suppression Systems Market was valued at USD 21.2 million in 2023.
Ans. The key players of the Armored Vehicle Fire Suppression Systems Market are Fire Protection Technologies Pty Ltd., Spectrex Inc., Halma plc, N2 Towers Inc., Marotta Controls Inc., Nero Industries, ExploSpot Systems Pty Ltd, Mikro-Pulssi Oy, Bulldog Direct Protective Systems, and Kidde-Deugra Brandschutzsysteme GmbH.
Ans. The growth rate of the Armored Vehicle Fire Suppression Systems Market is 3.6% over the forecast period 2024-2031.
Ans. North America region dominated the Armored Vehicle Fire Suppression Systems Market.
Ans. The Armored Vehicle Fire Suppression Systems Market is segmented based on By Vehicle Type.
TABLE OF CONTENTS
1. Introduction
1.1 Market Definition
1.2 Scope
1.3 Research Assumptions
2. Industry Flowchart
3. Research Methodology
4. Market Dynamics
4.1 Drivers
4.2 Restraints
4.3 Opportunities
4.4 Challenges
5. Impact Analysis
5.1 Impact of Russia-Ukraine Crisis
5.2 Impact of Economic Slowdown on Major Countries
5.2.1 Introduction
5.2.2 United States
5.2.3 Canada
5.2.4 Germany
5.2.5 France
5.2.6 UK
5.2.7 China
5.2.8 Japan
5.2.9 South Korea
5.2.10 India
6. Value Chain Analysis
7. Porter’s 5 Forces Model
8. Pest Analysis
9. Average Selling Price
9.1 North America
9.2 Europe
9.3 Asia Pacific
9.4 Latin America
9.5 Middle East & Africa
10.Armored Vehicle Fire Suppression Systems Market, By Vehicle Type
10.1 Introduction
10.2 Trend Analysis
10.3 Combat Vehicles
10.4 Troop Transport Vehicles
10.5 Others Vehicles Type
11. Regional Analysis
11.1 Introduction
11.2 North America
11.2.1 Trend Analysis
11.2.2 North America Armored Vehicle Fire Suppression Systems Market by Country
11.2.3 North America Armored Vehicle Fire Suppression Systems Market By Vehicle Type
11.2.4 USA
11.2.4.1 USA Armored Vehicle Fire Suppression Systems Market By Vehicle Type
11.2.5 Canada
11.2.5.1 Canada Armored Vehicle Fire Suppression Systems Market By Vehicle Type
11.2.6 Mexico
11.2.6.1 Mexico Armored Vehicle Fire Suppression Systems Market By Vehicle Type
11.3 Europe
11.3.1 Trend Analysis
11.3.2 Eastern Europe
11.3.2.1 Eastern Europe Armored Vehicle Fire Suppression Systems Market by Country
11.3.2.2 Eastern Europe Armored Vehicle Fire Suppression Systems Market By Vehicle Type
11.3.2.3 Poland
11.3.2.3.1 Poland Armored Vehicle Fire Suppression Systems Market By Vehicle Type
11.3.2.4 Romania
11.3.2.4.1 Romania Armored Vehicle Fire Suppression Systems Market By Vehicle Type
11.3.2.5 Hungary
11.3.2.5.1 Hungary Armored Vehicle Fire Suppression Systems Market By Vehicle Type
11.3.2.6 Turkey
11.3.2.6.1 Turkey Armored Vehicle Fire Suppression Systems Market By Vehicle Type
11.3.2.7 Rest of Eastern Europe
11.3.2.7.1 Rest of Eastern EuropeArmored Vehicle Fire Suppression Systems Market By Vehicle Type
11.3.3 Western Europe
11.3.3.1 Western EuropeArmored Vehicle Fire Suppression Systems Market by Country
11.3.3.2 Western EuropeArmored Vehicle Fire Suppression Systems Market By Vehicle Type
11.3.3.3 Germany
11.3.3.3.1 Germany Armored Vehicle Fire Suppression Systems Market By Vehicle Type
11.3.3.4 France
11.3.3.4.1 France Armored Vehicle Fire Suppression Systems Market By Vehicle Type
11.3.3.5 UK
11.3.3.5.1 UK Armored Vehicle Fire Suppression Systems Market By Vehicle Type
11.3.3.6 Italy
11.3.3.6.1 Italy Armored Vehicle Fire Suppression Systems Market By Vehicle Type
11.3.3.7 Spain
11.3.3.7.1 Spain Armored Vehicle Fire Suppression Systems Market By Vehicle Type
11.3.3.8 Netherlands
11.3.3.8.1 Netherlands Armored Vehicle Fire Suppression Systems Market By Vehicle Type
11.3.3.9 Switzerland
11.3.3.9.1 Switzerland Armored Vehicle Fire Suppression Systems Market By Vehicle Type
11.3.3.10 Austria
11.3.3.10.1 Austria Armored Vehicle Fire Suppression Systems Market By Vehicle Type
11.3.3.11 Rest of Western Europe
11.3.3.11.1 Rest of Western Europe Armored Vehicle Fire Suppression Systems Market By Vehicle Type11.4 Asia-Pacific
11.4.1 Trend Analysis
11.4.2 Asia-Pacific Armored Vehicle Fire Suppression Systems Market by Country
11.4.3 Asia-Pacific Armored Vehicle Fire Suppression Systems Market By Vehicle Type
11.4.5 China
11.4.5.1 China Armored Vehicle Fire Suppression Systems Market By Vehicle Type
11.4.6 India
11.4.6.1 India Armored Vehicle Fire Suppression Systems Market By Vehicle Type
11.4.7 Japan
11.4.7.1 Japan Armored Vehicle Fire Suppression Systems Market By Vehicle Type
11.4.8 South Korea
11.4.8.1 South Korea Armored Vehicle Fire Suppression Systems Market By Vehicle Type
11.4.9 Vietnam
11.4.9.1 Vietnam Armored Vehicle Fire Suppression Systems Market By Vehicle Type
11.4.10 Singapore
11.4.10.1 Singapore Armored Vehicle Fire Suppression Systems Market By Vehicle Type11.4.10 Australia
11.4.10.1 Australia Armored Vehicle Fire Suppression Systems Market By Vehicle Type
11.4.11 Rest of Asia-Pacific
11.4.11.1 Rest of Asia-Pacific Armored Vehicle Fire Suppression Systems Market By Vehicle Type
11.5 Middle East & Africa
11.5.1 Trend Analysis
11.5.2 Middle East
11.5.2.1 Middle East Armored Vehicle Fire Suppression Systems Market by Country
11.5.2.2 Middle East Armored Vehicle Fire Suppression Systems Market By Vehicle Type
11.5.2.3 UAE
11.5.2.3.1 UAE Armored Vehicle Fire Suppression Systems Market By Vehicle Type
11.5.2.4 Egypt
11.5.2.4.1 Egypt Armored Vehicle Fire Suppression Systems Market By Vehicle Type
11.5.2.5 Saudi Arabia
11.5.2.5.1 Saudi Arabia Armored Vehicle Fire Suppression Systems Market By Vehicle Type
11.5.2.6 Qatar
11.5.2.6.1 Qatar Armored Vehicle Fire Suppression Systems Market By Vehicle Type
11.5.2.7 Rest of Middle East
11.5.2.7.1 Rest of Middle East Armored Vehicle Fire Suppression Systems Market By Vehicle Type
11.5.3 Africa
11.5.3.1 Africa Armored Vehicle Fire Suppression Systems Market by Country
11.5.3.2 Africa Armored Vehicle Fire Suppression Systems Market By Vehicle Type
11.5.3.3 Nigeria
11.5.3.3.1 Nigeria Armored Vehicle Fire Suppression Systems Market By Vehicle Type
11.5.3.4 South Africa
11.5.3.4.1 South Africa Armored Vehicle Fire Suppression Systems Market By Vehicle Type
11.5.3.5 Rest of Africa
11.5.3.5.1 Rest of Africa Armored Vehicle Fire Suppression Systems Market By Vehicle Type
11.6 Latin America
11.6.1 Trend Analysis
11.6.2 Latin America Armored Vehicle Fire Suppression Systems Market by country
11.6.3 Latin America Armored Vehicle Fire Suppression Systems Market By Vehicle Type
11.6.4 Brazil
11.6.4.1 Brazil Armored Vehicle Fire Suppression Systems Market By Vehicle Type
11.6.5 Argentina
11.6.5.1 Argentina Armored Vehicle Fire Suppression Systems Market By Vehicle Type
11.6.6 Colombia
11.6.6.1 Colombia Armored Vehicle Fire Suppression Systems Market By Vehicle Type
11.6.7 Rest of Latin America
11.6.7.1 Rest of Latin America Armored Vehicle Fire Suppression Systems Market By Vehicle Type
12. Company Profiles
12.1 Fire Protection Technologies Pty Ltd.
12.1.1 Company Overview
12.1.2 Financial
12.1.3 Products/ Services Offered
12.1.4 SWOT Analysis
12.1.5 The SNS View
12.2 Spectrex Inc.
12.2.1 Company Overview
12.2.2 Financial
12.2.3 Products/ Services Offered
12.2.4 SWOT Analysis
12.2.5 The SNS View
12.3Halma plc
12.3.1 Company Overview
12.3.2 Financial
12.3.3 Products/ Services Offered
12.3.4 SWOT Analysis
12.3.5 The SNS View
12.4 N2 Towers Inc.
12.4.1 Company Overview
12.4.2 Financial
12.4.3 Products/ Services Offered
12.4.4 SWOT Analysis
12.4.5 The SNS View
12.5 Marotta Controls Inc.
12.5.1 Company Overview
12.5.2 Financial
12.5.3 Products/ Services Offered
12.5.4 SWOT Analysis
12.5.5 The SNS View
12.6 Nero Industries
12.6.1 Company Overview
12.6.2 Financial
12.6.3 Products/ Services Offered
12.6.4 SWOT Analysis
12.6.5 The SNS View
12.7 ExploSpot Systems Pty Ltd
12.7.1 Company Overview
12.7.2 Financial
12.7.3 Products/ Services Offered
12.7.4 SWOT Analysis
12.7.5 The SNS View
12.8Mikro-Pulssi Oy
12.8.1 Company Overview
12.8.2 Financial
12.8.3 Products/ Services Offered
12.8.4 SWOT Analysis
12.8.5 The SNS View
12.9 Bulldog Direct Protective Systems
12.9.1 Company Overview
12.9.2 Financial
12.9.3 Products/ Services Offered
12.9.4 SWOT Analysis
12.9.5 The SNS View
12.10 Kidde-Deugra Brandschutzsysteme GmbH
12.10.1 Company Overview
12.10.2 Financial
12.10.3 Products/ Services Offered
12.10.4 SWOT Analysis
12.10.5 The SNS View
13. Competitive Landscape
13.1 Competitive Benchmarking
13.2 Market Share Analysis
13.3 Recent Developments
13.3.1 Industry News
13.3.2 Company News
13.3.3 Mergers & Acquisitions
14. Use Case and Best Practices
15. Conclusion
An accurate research report requires proper strategizing as well as implementation. There are multiple factors involved in the completion of good and accurate research report and selecting the best methodology to compete the research is the toughest part. Since the research reports we provide play a crucial role in any company’s decision-making process, therefore we at SNS Insider always believe that we should choose the best method which gives us results closer to reality. This allows us to reach at a stage wherein we can provide our clients best and accurate investment to output ratio.
Each report that we prepare takes a timeframe of 350-400 business hours for production. Starting from the selection of titles through a couple of in-depth brain storming session to the final QC process before uploading our titles on our website we dedicate around 350 working hours. The titles are selected based on their current market cap and the foreseen CAGR and growth.
The 5 steps process:
Step 1: Secondary Research:
Secondary Research or Desk Research is as the name suggests is a research process wherein, we collect data through the readily available information. In this process we use various paid and unpaid databases which our team has access to and gather data through the same. This includes examining of listed companies’ annual reports, Journals, SEC filling etc. Apart from this our team has access to various associations across the globe across different industries. Lastly, we have exchange relationships with various university as well as individual libraries.
Step 2: Primary Research
When we talk about primary research, it is a type of study in which the researchers collect relevant data samples directly, rather than relying on previously collected data. This type of research is focused on gaining content specific facts that can be sued to solve specific problems. Since the collected data is fresh and first hand therefore it makes the study more accurate and genuine.
We at SNS Insider have divided Primary Research into 2 parts.
Part 1 wherein we interview the KOLs of major players as well as the upcoming ones across various geographic regions. This allows us to have their view over the market scenario and acts as an important tool to come closer to the accurate market numbers. As many as 45 paid and unpaid primary interviews are taken from both the demand and supply side of the industry to make sure we land at an accurate judgement and analysis of the market.
This step involves the triangulation of data wherein our team analyses the interview transcripts, online survey responses and observation of on filed participants. The below mentioned chart should give a better understanding of the part 1 of the primary interview.
Part 2: In this part of primary research the data collected via secondary research and the part 1 of the primary research is validated with the interviews from individual consultants and subject matter experts.
Consultants are those set of people who have at least 12 years of experience and expertise within the industry whereas Subject Matter Experts are those with at least 15 years of experience behind their back within the same space. The data with the help of two main processes i.e., FGDs (Focused Group Discussions) and IDs (Individual Discussions). This gives us a 3rd party nonbiased primary view of the market scenario making it a more dependable one while collation of the data pointers.
Step 3: Data Bank Validation
Once all the information is collected via primary and secondary sources, we run that information for data validation. At our intelligence centre our research heads track a lot of information related to the market which includes the quarterly reports, the daily stock prices, and other relevant information. Our data bank server gets updated every fortnight and that is how the information which we collected using our primary and secondary information is revalidated in real time.
Step 4: QA/QC Process
After all the data collection and validation our team does a final level of quality check and quality assurance to get rid of any unwanted or undesired mistakes. This might include but not limited to getting rid of the any typos, duplication of numbers or missing of any important information. The people involved in this process include technical content writers, research heads and graphics people. Once this process is completed the title gets uploader on our platform for our clients to read it.
Step 5: Final QC/QA Process:
This is the last process and comes when the client has ordered the study. In this process a final QA/QC is done before the study is emailed to the client. Since we believe in giving our clients a good experience of our research studies, therefore, to make sure that we do not lack at our end in any way humanly possible we do a final round of quality check and then dispatch the study to the client.
The Aerospace Robotics Market size was valued at USD 3.28 billion in 2023 and is expected to reach USD 9.12 billion by 2032 and grow at a CAGR of 12.03% over the forecast period of 2024-2032.
The Military Wearable Market Size was valued at USD 5.32 billion in 2022 and is expected to reach USD 9.41 billion by 2030 with a growing CAGR of 7.4% over the forecast period 2023-2030.
The Electronic Warfare Market Size was valued at US$ 10.7 billion in 2023, is expected to reach USD 27.70 billion by 2031 and grow at a CAGR of 12.6% over the forecast period 2024-2031.
The Marine Electric Vehicle Market Size was valued at USD 10.0 billion in 2023 and is expected to reach USD 32.3 billion by 2032 and grow at a CAGR of 13.9% over the forecast period 2024-2032.
The 3D Radar Market Size was valued at USD 2245.5 million in 2023 expected to reach USD 12832.7 million by 2032 with a growing CAGR of 21.37% over the forecast period 2024-2032.
The Satellite Communication Equipment Market Size was valued at USD 32.6 billion in 2023 and is expected to reach USD 140.3 billion by 2031 and grow at a CAGR of 20.0% over the forecast period 2024-2031.
Hi! Click one of our member below to chat on Phone