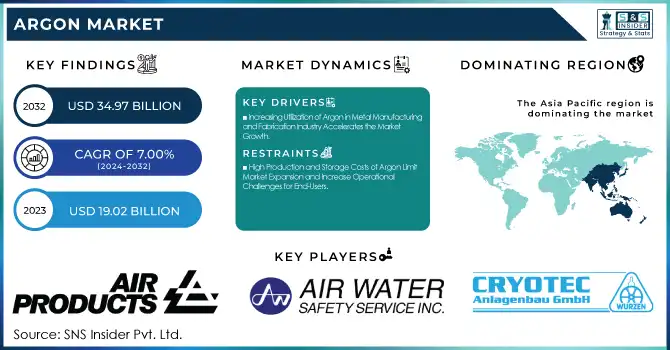
The Argon Market Size was valued at USD 19.02 Billion in 2023 and is expected to reach USD 34.97 Billion by 2032, growing at a CAGR of 7.00% over the forecast period of 2024-2032.
The Argon Market is expanding, driven by its critical role in metal manufacturing, healthcare, and electronics. Production capacity analysis highlights supply-demand trends and capacity expansions by key manufacturers. The investment and funding landscape showcases financial commitments toward infrastructure and technological advancements. Stringent environmental regulations are shaping production methods, pushing companies toward sustainable extraction. R&D expenditure by major players focuses on enhancing purity and discovering new applications. Capital expenditure (CAPEX) trends reveal investments in cryogenic storage, on-site generation, and advanced distribution networks to ensure supply resilience. Our report provides exclusive insights into these aspects, backed by data-driven analysis and expert perspectives, offering a comprehensive understanding of the evolving market
Drivers
Increasing Utilization of Argon in Metal Manufacturing and Fabrication Industry Accelerates the Market Growth
The widespread use of argon in the metal manufacturing and fabrication industry is a major driver of the argon market. Argon is extensively utilized as an inert shielding gas in welding processes, particularly in applications requiring precision and high-quality finishes, such as aerospace, automotive, and structural steel manufacturing. The metal fabrication industry relies heavily on argon to prevent oxidation and contamination, ensuring superior weld strength and durability. Additionally, the growing adoption of additive manufacturing (3D printing) in industrial production has increased the demand for argon in metal powder-based printing processes. The rise in global infrastructure development, coupled with the expansion of the automotive and construction sectors, has further boosted the need for argon in metal processing and fabrication. Countries with strong industrial bases, such as Germany, the United States, China, and Japan, are witnessing increased demand for argon as steel and aluminum production continues to grow. The push for sustainable and lightweight materials in automotive manufacturing, particularly in the production of electric vehicles, has also driven the need for precision welding and metal processing using argon. Furthermore, advancements in welding technologies, such as laser welding and plasma arc welding, have reinforced the importance of argon as an essential shielding gas. The increasing focus on improving production efficiency and reducing material wastage in metal fabrication processes is expected to sustain the demand for argon, making it a crucial component in modern manufacturing industries.
Restraints
High Production and Storage Costs of Argon Limit Market Expansion and Increase Operational Challenges for End-Users
The high production and storage costs of argon pose a significant restraint on market expansion, affecting its affordability and accessibility for end-users. Argon is primarily obtained as a byproduct of oxygen and nitrogen separation during air liquefaction in cryogenic distillation plants. The extraction process requires advanced separation technologies, high energy consumption, and significant capital investments, making argon production expensive. Additionally, the transportation and storage of argon, especially in its liquid form, demand specialized cryogenic tanks and infrastructure, further adding to the overall operational costs. Industries that rely on bulk argon supply, such as metal fabrication and electronics manufacturing, often face cost fluctuations due to energy price volatility and supply chain disruptions. Small and medium-sized enterprises (SMEs) with limited budgets may find it challenging to invest in the necessary storage and handling infrastructure for argon, leading to constrained adoption. The economic burden associated with maintaining a stable and cost-effective supply chain for argon remains a key challenge, impacting market growth.
Opportunities
Expansion of On-Site Argon Generation Technologies Enhances Supply Efficiency and Reduces Dependency on Bulk Storage and Transportation
The expansion of on-site argon generation technologies presents a significant opportunity for improving supply efficiency and reducing dependency on bulk storage and transportation. Many industries, particularly those requiring a continuous supply of argon, are adopting on-site generation systems to mitigate the risks associated with supply chain disruptions and fluctuating argon prices. On-site generation eliminates the need for bulk transportation and reduces storage costs, making it a cost-effective solution for end-users. Advancements in pressure swing adsorption (PSA) and membrane-based separation technologies have further enhanced the feasibility of on-site argon production. The growing preference for localized gas generation is expected to drive innovation and investment in decentralized argon supply solutions.
Challenge
Supply Chain Disruptions and Regional Dependence on Limited Production Facilities Affect Market Stability
The argon market faces challenges related to supply chain disruptions and production facility concentration. Since argon is primarily produced as a byproduct of oxygen and nitrogen manufacturing, any fluctuations in these industries directly impact argon availability. Additionally, some regions rely on a limited number of large-scale production plants, making them vulnerable to supply shortages during plant shutdowns, maintenance, or geopolitical disruptions. Logistics constraints, including high transportation costs and storage limitations, further complicate supply chain management. To address these challenges, manufacturers are exploring decentralized production models and regional expansion strategies to ensure a stable supply.
By Grade
The industrial-grade segment dominated the argon market in 2023, holding a 65.2% share due to its extensive use in welding, metal fabrication, and industrial processing. Argon’s inert properties make it essential for gas metal arc welding (GMAW) and tungsten inert gas (TIG) welding, particularly in the automotive and construction sectors. The International Institute of Welding (IIW) has highlighted the increasing adoption of industrial argon in advanced welding techniques. Furthermore, government infrastructure projects, such as the U.S. Bipartisan Infrastructure Law, which allocates significant funds for bridge and highway construction, have fueled demand for industrial-grade argon. Additionally, key manufacturers, including Linde and Air Liquide, have expanded production to meet the growing demand, reinforcing industrial-grade argon’s dominant position.
By Storage & Distribution
The cylinders segment dominated the argon market in 2023, capturing 45.1% of the share due to its convenience, cost-effectiveness, and widespread industrial use. Cylinder-based storage is preferred for welding, healthcare, and laboratory applications, where controlled supply is essential. The American Welding Society (AWS) has emphasized the increased use of portable gas cylinders for on-site welding operations, particularly in small-scale metal fabrication. Additionally, government-backed industrialization initiatives in emerging economies, such as India’s ‘Make in India’ campaign, have led to a surge in cylinder-based argon adoption in manufacturing units. Leading players like Air Products and Messer Group have expanded their cylinder-based distribution networks, further strengthening this segment’s market dominance.
By Form
Liquid form dominated the argon market in 2023 with a 55.6% share, primarily due to its extensive industrial applications, particularly in cryogenic processes and large-scale metal fabrication. The U.S. Department of Energy (DOE) has acknowledged liquid argon’s critical role in particle physics research, including projects like the Deep Underground Neutrino Experiment (DUNE). Additionally, steel manufacturers such as ArcelorMittal and Nippon Steel utilize liquid argon for refining processes to prevent oxidation, further driving demand. The expansion of air separation plants by companies like Linde and Air Liquide has increased the availability of liquid argon, making it the preferred choice for bulk consumers in metal production and research institutions.
By End-Use Industry
Metal manufacturing and fabrication dominated the argon market in 2023, accounting for 35.8% of the total share, driven by the gas’s indispensable role in welding and metal refining. The World Steel Association (WSA) has reported increasing steel production, with countries like China, India, and the United States heavily relying on argon for arc welding and degassing. Government initiatives such as China’s Belt and Road Initiative (BRI) and the European Green Deal, which emphasize infrastructure expansion and sustainable construction, have boosted metal fabrication activities. Moreover, prominent metal manufacturers like Tata Steel and POSCO have integrated argon-based refining techniques to enhance product quality, reinforcing this segment’s dominance in the global argon market.
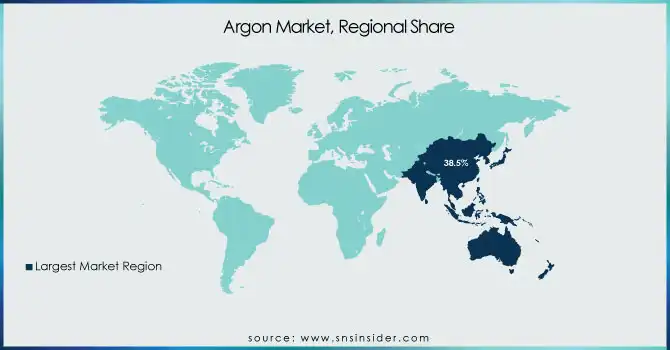
Asia Pacific dominated the argon market in 2023 and accounted for a 38.5% market share, primarily due to the rapid expansion of the metal manufacturing, electronics, and automotive industries. China led the region, driven by its status as the world’s largest steel producer, with the World Steel Association reporting that the country produced over 1 billion metric tons of steel in 2023, significantly boosting argon demand for metal fabrication and welding. Japan, a leader in semiconductor production, also contributed to the market dominance, with the Japan Electronics and Information Technology Industries Association (JEITA) highlighting increasing semiconductor sales exceeding USD 50 billion in 2023. India’s growing industrialization, supported by initiatives like ‘Make in India,’ has further fueled argon adoption in metal processing and energy sectors. Additionally, the expansion of air separation plants by key players such as Linde, Air Liquide, and Nippon Sanso Holdings has strengthened regional supply chains, reinforcing Asia Pacific’s dominance.
On the other hand, North America emerged as the fastest-growing region in the argon market, with a significant CAGR during the forecast period. The dominance is driven by rising demand from the healthcare, aerospace, and energy sectors. The United States leads this growth, with the U.S. Department of Energy investing in clean energy projects that require argon for plasma arc cutting and insulation. Additionally, NASA’s increasing use of argon in spacecraft applications and the semiconductor industry's growth, supported by the CHIPS Act, are boosting demand. Canada’s expanding metal fabrication industry, particularly in automotive manufacturing, has also contributed to market growth, with the Canadian Steel Producers Association (CSPA) reporting increased steel production in 2023. Mexico’s growing electronics sector, driven by investments from global chip manufacturers, further supports the rising demand for high-purity argon. The presence of major players like Air Products and Messer Group expanding production facilities solidifies North America’s position as the fastest-growing region.
Air Products and Chemicals Inc. (Liquid Argon, High-Purity Argon Gas, Argon Gas Mixtures)
Air Water Inc. (Industrial Argon Gas, Bulk Argon Supply, Argon Cylinders)
Buzwair Industrial Gases Factories (Argon for Welding, High-Purity Argon, Liquid Argon Supply)
Cryotec Anlagenbau GmbH (Argon Purification Systems, Cryogenic Argon Plants, Air Separation Units for Argon)
Dubai Industrial Gases (High-Purity Argon, Argon Gas Cylinders, Liquid Argon)
Gulf Cryo Holding K.S.C.C. (Industrial Argon Gas, Argon Mixtures, Liquid Argon for Metal Fabrication)
Hangzhou Hangyang Company Limited (Air Separation Units for Argon, Liquid Argon Storage Tanks, Bulk Argon Supply Systems)
Iwatani Corporation (High-Purity Argon Gas, Argon Cylinders, Liquid Argon Supply)
J.V.C. Industrial Corporation (Industrial Argon Gas, Argon Mixtures, Argon Cylinders)
Kanto Kagaku Co. Ltd. (Ultra-High Purity Argon, Semiconductor-Grade Argon, Argon Cylinders)
L'Air Liquide S.A. (High-Purity Argon, Argon Mixtures, Bulk & Cylinder Argon Supply)
Linde plc (Liquid Argon, Industrial Argon Gas, Argon Gas Mixtures)
Messer Group GmbH (Industrial Argon, Argon Mixtures for Welding, Liquid Argon Supply)
National Industrial Gas Plants (High-Purity Argon Gas, Argon Cylinders, Bulk Argon Delivery)
Nippon Sanso Holdings Corporation (Taiyo Nippon Sanso Corporation) (High-Purity Argon, Argon Gas Mixtures, Liquid Argon)
SIAD S.p.A. (High-Purity Argon, Industrial Argon, Liquid Argon Supply)
SOL S.p.A. (Liquid Argon, High-Purity Argon Gas, Argon Mixtures)
Southern Industrial Gas Berhad (Industrial Argon Gas, Argon Gas Cylinders, Liquid Argon Supply)
Universal Industrial Gases Inc. (Bulk Argon Supply, Liquid Argon Storage, Argon Purification Systems)
Wesfarmers Company (Industrial Argon Gas, Argon Cylinders, Liquid Argon Supply)
October 2024: Syntax Systems acquired Argon Supply Chain Solutions to enhance its cloud-based supply chain management offerings. The acquisition aimed to strengthen Syntax’s digital transformation capabilities, providing advanced logistics and inventory solutions. This move aligned with Syntax’s strategy to expand its enterprise resource planning (ERP) and cloud solutions portfolio.
Report Attributes | Details |
---|---|
Market Size in 2023 | USD 19.02 Billion |
Market Size by 2032 | USD 34.97 Billion |
CAGR | CAGR of 7.00% From 2024 to 2032 |
Base Year | 2023 |
Forecast Period | 2024-2032 |
Historical Data | 2020-2022 |
Report Scope & Coverage | Market Size, Segments Analysis, Competitive Landscape, Regional Analysis, DROC & SWOT Analysis, Forecast Outlook |
Key Segments | •By Grade (Industrial, High Purity, Ultra-High Purity) •By Storage & Distribution (Cylinders, Bulk & Microbulk, On-Site Generation) •By Form (Liquid Argon, Gaseous Argon) •By End-Use Industry (Metal Manufacturing & Fabrication, Chemicals, Energy, Healthcare, Electronics & Semiconductors, Aerospace & Automotive, Others) |
Regional Analysis/Coverage | North America (US, Canada, Mexico), Europe (Eastern Europe [Poland, Romania, Hungary, Turkey, Rest of Eastern Europe] Western Europe] Germany, France, UK, Italy, Spain, Netherlands, Switzerland, Austria, Rest of Western Europe]), Asia Pacific (China, India, Japan, South Korea, Vietnam, Singapore, Australia, Rest of Asia Pacific), Middle East & Africa (Middle East [UAE, Egypt, Saudi Arabia, Qatar, Rest of Middle East], Africa [Nigeria, South Africa, Rest of Africa], Latin America (Brazil, Argentina, Colombia, Rest of Latin America) |
Company Profiles | Linde plc, Air Products and Chemicals Inc., L'Air Liquide S.A., Nippon Sanso Holdings Corporation (Taiyo Nippon Sanso Corporation), Messer Group GmbH, Iwatani Corporation, Air Water Inc., Gulf Cryo Holding K.S.C.C., SIAD S.p.A., SOL S.p.A. and other key players |
Ans: The Argon Market was valued at USD 19.02 billion in 2023.
Ans: The Argon Market is projected to grow at a CAGR of 7.00% from 2024 to 2032.
Ans: Increasing use in metal manufacturing, healthcare, and electronics is fueling the Argon Market.
Ans: Strict environmental policies are driving sustainable production in the Argon Market.
Ans: Asia Pacific held a 38.5% share of the Argon Market, driven by industrial expansion.
Table of Contents
1. Introduction
1.1 Market Definition
1.2 Scope (Inclusion and Exclusions)
1.3 Research Assumptions
2. Executive Summary
2.1 Market Overview
2.2 Regional Synopsis
2.3 Competitive Summary
3. Research Methodology
3.1 Top-Down Approach
3.2 Bottom-up Approach
3.3. Data Validation
3.4 Primary Interviews
4. Market Dynamics Impact Analysis
4.1 Market Driving Factors Analysis
4.1.1 Drivers
4.1.2 Restraints
4.1.3 Opportunities
4.1.4 Challenges
4.2 PESTLE Analysis
4.3 Porter’s Five Forces Model
5. Statistical Insights and Trends Reporting
5.1 Production Capacity Analysis
5.2 Investment & Funding Landscape
5.3 Impact of Environmental Regulations on Argon Supply
5.4 R&D Expenditure by Major Players
5.5 Capital Expenditure (CAPEX) Trends
6. Competitive Landscape
6.1 List of Major Companies, By Region
6.2 Market Share Analysis, By Region
6.3 Product Benchmarking
6.3.1 Product specifications and features
6.3.2 Pricing
6.4 Strategic Initiatives
6.4.1 Marketing and promotional activities
6.4.2 Distribution and supply chain strategies
6.4.3 Expansion plans and new product launches
6.4.4 Strategic partnerships and collaborations
6.5 Technological Advancements
6.6 Market Positioning and Branding
7. Argon Market Segmentation, by Grade
7.1 Chapter Overview
7.2 Industrial
7.2.1 Industrial Market Trends Analysis (2020-2032)
7.2.2 Industrial Market Size Estimates and Forecasts to 2032 (USD Billion)
7.3 High Purity
7.3.1 High Purity Market Trends Analysis (2020-2032)
7.3.2 High Purity Market Size Estimates and Forecasts to 2032 (USD Billion)
7.4 Ultra-High Purity
7.4.1 Ultra-High Purity Market Trends Analysis (2020-2032)
7.4.2 Ultra-High Purity Market Size Estimates and Forecasts to 2032 (USD Billion)
8. Argon Market Segmentation, by Storage & Distribution
8.1 Chapter Overview
8.2 Cylinders
8.2.1 Cylinders Market Trends Analysis (2020-2032)
8.2.2 Cylinders Market Size Estimates and Forecasts to 2032 (USD Billion)
8.3 Bulk & Microbulk
8.3.1 Bulk & Microbulk Market Trends Analysis (2020-2032)
8.3.2 Bulk & Microbulk Market Size Estimates and Forecasts to 2032 (USD Billion)
8.4 On-Site Generation
8.4.1 On-Site Generation Market Trends Analysis (2020-2032)
8.4.2 On-Site Generation Market Size Estimates and Forecasts to 2032 (USD Billion)
9. Argon Market Segmentation, by Form
9.1 Chapter Overview
9.2 Liquid Argon
9.2.1 Liquid Argon Market Trends Analysis (2020-2032)
9.2.2 Liquid Argon Market Size Estimates and Forecasts to 2032 (USD Billion)
9.3 Gaseous Argon
9.3.1 Gaseous Argon Market Trends Analysis (2020-2032)
9.3.2 Gaseous Argon Market Size Estimates and Forecasts to 2032 (USD Billion)
10. Argon Market Segmentation, by End-Use Industry
10.1 Chapter Overview
10.2 Metal Manufacturing & Fabrication
10.2.1 Metal Manufacturing & Fabrication Market Trends Analysis (2020-2032)
10.2.2 Metal Manufacturing & Fabrication Market Size Estimates and Forecasts to 2032 (USD Billion)
10.3 Chemicals
10.3.1 Chemicals Market Trends Analysis (2020-2032)
10.3.2 Chemicals Market Size Estimates and Forecasts to 2032 (USD Billion)
10.4 Energy
10.4.1 Energy Market Trends Analysis (2020-2032)
10.4.2 Energy Market Size Estimates and Forecasts to 2032 (USD Billion)
10.5 Healthcare
10.5.1 Healthcare Market Trends Analysis (2020-2032)
10.5.2 Healthcare Market Size Estimates and Forecasts to 2032 (USD Billion)
10.6 Electronics & Semiconductors
10.6.1 Electronics & Semiconductors Market Trends Analysis (2020-2032)
10.6.2 Electronics & Semiconductors Market Size Estimates and Forecasts to 2032 (USD Billion)
10.7 Aerospace & Automotive
10.7.1 Aerospace & Automotive Market Trends Analysis (2020-2032)
10.7.2 Aerospace & Automotive Market Size Estimates and Forecasts to 2032 (USD Billion)
10.8 Others
10.8.1 Others Market Trends Analysis (2020-2032)
10.8.2 Others Market Size Estimates and Forecasts to 2032 (USD Billion)
11. Regional Analysis
11.1 Chapter Overview
11.2 North America
11.2.1 Trends Analysis
11.2.2 North America Argon Market Estimates and Forecasts, by Country (2020-2032) (USD Billion)
11.2.3 North America Argon Market Estimates and Forecasts, by Grade (2020-2032) (USD Billion)
11.2.4 North America Argon Market Estimates and Forecasts, by Storage & Distribution (2020-2032) (USD Billion)
11.2.5 North America Argon Market Estimates and Forecasts, by Form (2020-2032) (USD Billion)
11.2.6 North America Argon Market Estimates and Forecasts, by End-Use Industry (2020-2032) (USD Billion)
11.2.7 USA
11.2.7.1 USA Argon Market Estimates and Forecasts, by Grade (2020-2032) (USD Billion)
11.2.7.2 USA Argon Market Estimates and Forecasts, by Storage & Distribution (2020-2032) (USD Billion)
11.2.7.3 USA Argon Market Estimates and Forecasts, by Form (2020-2032) (USD Billion)
11.2.7.4 USA Argon Market Estimates and Forecasts, by End-Use Industry (2020-2032) (USD Billion)
11.2.8 Canada
11.2.8.1 Canada Argon Market Estimates and Forecasts, by Grade (2020-2032) (USD Billion)
11.2.8.2 Canada Argon Market Estimates and Forecasts, by Storage & Distribution (2020-2032) (USD Billion)
11.2.8.3 Canada Argon Market Estimates and Forecasts, by Form (2020-2032) (USD Billion)
11.2.8.4 Canada Argon Market Estimates and Forecasts, by End-Use Industry (2020-2032) (USD Billion)
11.2.9 Mexico
11.2.9.1 Mexico Argon Market Estimates and Forecasts, by Grade (2020-2032) (USD Billion)
11.2.9.2 Mexico Argon Market Estimates and Forecasts, by Storage & Distribution (2020-2032) (USD Billion)
11.2.9.3 Mexico Argon Market Estimates and Forecasts, by Form (2020-2032) (USD Billion)
11.2.9.4 Mexico Argon Market Estimates and Forecasts, by End-Use Industry (2020-2032) (USD Billion)
11.3 Europe
11.3.1 Eastern Europe
11.3.1.1 Trends Analysis
11.3.1.2 Eastern Europe Argon Market Estimates and Forecasts, by Country (2020-2032) (USD Billion)
11.3.1.3 Eastern Europe Argon Market Estimates and Forecasts, by Grade (2020-2032) (USD Billion)
11.3.1.4 Eastern Europe Argon Market Estimates and Forecasts, by Storage & Distribution (2020-2032) (USD Billion)
11.3.1.5 Eastern Europe Argon Market Estimates and Forecasts, by Form (2020-2032) (USD Billion)
11.3.1.6 Eastern Europe Argon Market Estimates and Forecasts, by End-Use Industry (2020-2032) (USD Billion)
11.3.1.7 Poland
11.3.1.7.1 Poland Argon Market Estimates and Forecasts, by Grade (2020-2032) (USD Billion)
11.3.1.7.2 Poland Argon Market Estimates and Forecasts, by Storage & Distribution (2020-2032) (USD Billion)
11.3.1.7.3 Poland Argon Market Estimates and Forecasts, by Form (2020-2032) (USD Billion)
11.3.1.7.4 Poland Argon Market Estimates and Forecasts, by End-Use Industry (2020-2032) (USD Billion)
11.3.1.8 Romania
11.3.1.8.1 Romania Argon Market Estimates and Forecasts, by Grade (2020-2032) (USD Billion)
11.3.1.8.2 Romania Argon Market Estimates and Forecasts, by Storage & Distribution (2020-2032) (USD Billion)
11.3.1.8.3 Romania Argon Market Estimates and Forecasts, by Form (2020-2032) (USD Billion)
11.3.1.8.4 Romania Argon Market Estimates and Forecasts, by End-Use Industry (2020-2032) (USD Billion)
11.3.1.9 Hungary
11.3.1.9.1 Hungary Argon Market Estimates and Forecasts, by Grade (2020-2032) (USD Billion)
11.3.1.9.2 Hungary Argon Market Estimates and Forecasts, by Storage & Distribution (2020-2032) (USD Billion)
11.3.1.9.3 Hungary Argon Market Estimates and Forecasts, by Form (2020-2032) (USD Billion)
11.3.1.9.4 Hungary Argon Market Estimates and Forecasts, by End-Use Industry (2020-2032) (USD Billion)
11.3.1.10 Turkey
11.3.1.10.1 Turkey Argon Market Estimates and Forecasts, by Grade (2020-2032) (USD Billion)
11.3.1.10.2 Turkey Argon Market Estimates and Forecasts, by Storage & Distribution (2020-2032) (USD Billion)
11.3.1.10.3 Turkey Argon Market Estimates and Forecasts, by Form (2020-2032) (USD Billion)
11.3.1.10.4 Turkey Argon Market Estimates and Forecasts, by End-Use Industry (2020-2032) (USD Billion)
11.3.1.11 Rest of Eastern Europe
11.3.1.11.1 Rest of Eastern Europe Argon Market Estimates and Forecasts, by Grade (2020-2032) (USD Billion)
11.3.1.11.2 Rest of Eastern Europe Argon Market Estimates and Forecasts, by Storage & Distribution (2020-2032) (USD Billion)
11.3.1.11.3 Rest of Eastern Europe Argon Market Estimates and Forecasts, by Form (2020-2032) (USD Billion)
11.3.1.11.4 Rest of Eastern Europe Argon Market Estimates and Forecasts, by End-Use Industry (2020-2032) (USD Billion)
11.3.2 Western Europe
11.3.2.1 Trends Analysis
11.3.2.2 Western Europe Argon Market Estimates and Forecasts, by Country (2020-2032) (USD Billion)
11.3.2.3 Western Europe Argon Market Estimates and Forecasts, by Grade (2020-2032) (USD Billion)
11.3.2.4 Western Europe Argon Market Estimates and Forecasts, by Storage & Distribution (2020-2032) (USD Billion)
11.3.2.5 Western Europe Argon Market Estimates and Forecasts, by Form (2020-2032) (USD Billion)
11.3.2.6 Western Europe Argon Market Estimates and Forecasts, by End-Use Industry (2020-2032) (USD Billion)
11.3.2.7 Germany
11.3.2.7.1 Germany Argon Market Estimates and Forecasts, by Grade (2020-2032) (USD Billion)
11.3.2.7.2 Germany Argon Market Estimates and Forecasts, by Storage & Distribution (2020-2032) (USD Billion)
11.3.2.7.3 Germany Argon Market Estimates and Forecasts, by Form (2020-2032) (USD Billion)
11.3.2.7.4 Germany Argon Market Estimates and Forecasts, by End-Use Industry (2020-2032) (USD Billion)
11.3.2.8 France
11.3.2.8.1 France Argon Market Estimates and Forecasts, by Grade (2020-2032) (USD Billion)
11.3.2.8.2 France Argon Market Estimates and Forecasts, by Storage & Distribution (2020-2032) (USD Billion)
11.3.2.8.3 France Argon Market Estimates and Forecasts, by Form (2020-2032) (USD Billion)
11.3.2.8.4 France Argon Market Estimates and Forecasts, by End-Use Industry (2020-2032) (USD Billion)
11.3.2.9 UK
11.3.2.9.1 UK Argon Market Estimates and Forecasts, by Grade (2020-2032) (USD Billion)
11.3.2.9.2 UK Argon Market Estimates and Forecasts, by Storage & Distribution (2020-2032) (USD Billion)
11.3.2.9.3 UK Argon Market Estimates and Forecasts, by Form (2020-2032) (USD Billion)
11.3.2.9.4 UK Argon Market Estimates and Forecasts, by End-Use Industry (2020-2032) (USD Billion)
11.3.2.10 Italy
11.3.2.10.1 Italy Argon Market Estimates and Forecasts, by Grade (2020-2032) (USD Billion)
11.3.2.10.2 Italy Argon Market Estimates and Forecasts, by Storage & Distribution (2020-2032) (USD Billion)
11.3.2.10.3 Italy Argon Market Estimates and Forecasts, by Form (2020-2032) (USD Billion)
11.3.2.10.4 Italy Argon Market Estimates and Forecasts, by End-Use Industry (2020-2032) (USD Billion)
11.3.2.11 Spain
11.3.2.11.1 Spain Argon Market Estimates and Forecasts, by Grade (2020-2032) (USD Billion)
11.3.2.11.2 Spain Argon Market Estimates and Forecasts, by Storage & Distribution (2020-2032) (USD Billion)
11.3.2.11.3 Spain Argon Market Estimates and Forecasts, by Form (2020-2032) (USD Billion)
11.3.2.11.4 Spain Argon Market Estimates and Forecasts, by End-Use Industry (2020-2032) (USD Billion)
11.3.2.12 Netherlands
11.3.2.12.1 Netherlands Argon Market Estimates and Forecasts, by Grade (2020-2032) (USD Billion)
11.3.2.12.2 Netherlands Argon Market Estimates and Forecasts, by Storage & Distribution (2020-2032) (USD Billion)
11.3.2.12.3 Netherlands Argon Market Estimates and Forecasts, by Form (2020-2032) (USD Billion)
11.3.2.12.4 Netherlands Argon Market Estimates and Forecasts, by End-Use Industry (2020-2032) (USD Billion)
11.3.2.13 Switzerland
11.3.2.13.1 Switzerland Argon Market Estimates and Forecasts, by Grade (2020-2032) (USD Billion)
11.3.2.13.2 Switzerland Argon Market Estimates and Forecasts, by Storage & Distribution (2020-2032) (USD Billion)
11.3.2.13.3 Switzerland Argon Market Estimates and Forecasts, by Form (2020-2032) (USD Billion)
11.3.2.13.4 Switzerland Argon Market Estimates and Forecasts, by End-Use Industry (2020-2032) (USD Billion)
11.3.2.14 Austria
11.3.2.14.1 Austria Argon Market Estimates and Forecasts, by Grade (2020-2032) (USD Billion)
11.3.2.14.2 Austria Argon Market Estimates and Forecasts, by Storage & Distribution (2020-2032) (USD Billion)
11.3.2.14.3 Austria Argon Market Estimates and Forecasts, by Form (2020-2032) (USD Billion)
11.3.2.14.4 Austria Argon Market Estimates and Forecasts, by End-Use Industry (2020-2032) (USD Billion)
11.3.2.15 Rest of Western Europe
11.3.2.15.1 Rest of Western Europe Argon Market Estimates and Forecasts, by Grade (2020-2032) (USD Billion)
11.3.2.15.2 Rest of Western Europe Argon Market Estimates and Forecasts, by Storage & Distribution (2020-2032) (USD Billion)
11.3.2.15.3 Rest of Western Europe Argon Market Estimates and Forecasts, by Form (2020-2032) (USD Billion)
11.3.2.15.4 Rest of Western Europe Argon Market Estimates and Forecasts, by End-Use Industry (2020-2032) (USD Billion)
11.4 Asia Pacific
11.4.1 Trends Analysis
11.4.2 Asia Pacific Argon Market Estimates and Forecasts, by Country (2020-2032) (USD Billion)
11.4.3 Asia Pacific Argon Market Estimates and Forecasts, by Grade (2020-2032) (USD Billion)
11.4.4 Asia Pacific Argon Market Estimates and Forecasts, by Storage & Distribution (2020-2032) (USD Billion)
11.4.5 Asia Pacific Argon Market Estimates and Forecasts, by Form (2020-2032) (USD Billion)
11.4.6 Asia Pacific Argon Market Estimates and Forecasts, by End-Use Industry (2020-2032) (USD Billion)
11.4.7 China
11.4.7.1 China Argon Market Estimates and Forecasts, by Grade (2020-2032) (USD Billion)
11.4.7.2 China Argon Market Estimates and Forecasts, by Storage & Distribution (2020-2032) (USD Billion)
11.4.7.3 China Argon Market Estimates and Forecasts, by Form (2020-2032) (USD Billion)
11.4.7.4 China Argon Market Estimates and Forecasts, by End-Use Industry (2020-2032) (USD Billion)
11.4.8 India
11.4.8.1 India Argon Market Estimates and Forecasts, by Grade (2020-2032) (USD Billion)
11.4.8.2 India Argon Market Estimates and Forecasts, by Storage & Distribution (2020-2032) (USD Billion)
11.4.8.3 India Argon Market Estimates and Forecasts, by Form (2020-2032) (USD Billion)
11.4.8.4 India Argon Market Estimates and Forecasts, by End-Use Industry (2020-2032) (USD Billion)
11.4.9 Japan
11.4.9.1 Japan Argon Market Estimates and Forecasts, by Grade (2020-2032) (USD Billion)
11.4.9.2 Japan Argon Market Estimates and Forecasts, by Storage & Distribution (2020-2032) (USD Billion)
11.4.9.3 Japan Argon Market Estimates and Forecasts, by Form (2020-2032) (USD Billion)
11.4.9.4 Japan Argon Market Estimates and Forecasts, by End-Use Industry (2020-2032) (USD Billion)
11.4.10 South Korea
11.4.10.1 South Korea Argon Market Estimates and Forecasts, by Grade (2020-2032) (USD Billion)
11.4.10.2 South Korea Argon Market Estimates and Forecasts, by Storage & Distribution (2020-2032) (USD Billion)
11.4.10.3 South Korea Argon Market Estimates and Forecasts, by Form (2020-2032) (USD Billion)
11.4.10.4 South Korea Argon Market Estimates and Forecasts, by End-Use Industry (2020-2032) (USD Billion)
11.4.11 Vietnam
11.4.11.1 Vietnam Argon Market Estimates and Forecasts, by Grade (2020-2032) (USD Billion)
11.4.11.2 Vietnam Argon Market Estimates and Forecasts, by Storage & Distribution (2020-2032) (USD Billion)
11.4.11.3 Vietnam Argon Market Estimates and Forecasts, by Form (2020-2032) (USD Billion)
11.4.11.4 Vietnam Argon Market Estimates and Forecasts, by End-Use Industry (2020-2032) (USD Billion)
11.4.12 Singapore
11.4.12.1 Singapore Argon Market Estimates and Forecasts, by Grade (2020-2032) (USD Billion)
11.4.12.2 Singapore Argon Market Estimates and Forecasts, by Storage & Distribution (2020-2032) (USD Billion)
11.4.12.3 Singapore Argon Market Estimates and Forecasts, by Form (2020-2032) (USD Billion)
11.4.12.4 Singapore Argon Market Estimates and Forecasts, by End-Use Industry (2020-2032) (USD Billion)
11.4.13 Australia
11.4.13.1 Australia Argon Market Estimates and Forecasts, by Grade (2020-2032) (USD Billion)
11.4.13.2 Australia Argon Market Estimates and Forecasts, by Storage & Distribution (2020-2032) (USD Billion)
11.4.13.3 Australia Argon Market Estimates and Forecasts, by Form (2020-2032) (USD Billion)
11.4.13.4 Australia Argon Market Estimates and Forecasts, by End-Use Industry (2020-2032) (USD Billion)
11.4.14 Rest of Asia Pacific
11.4.14.1 Rest of Asia Pacific Argon Market Estimates and Forecasts, by Grade (2020-2032) (USD Billion)
11.4.14.2 Rest of Asia Pacific Argon Market Estimates and Forecasts, by Storage & Distribution (2020-2032) (USD Billion)
11.4.14.3 Rest of Asia Pacific Argon Market Estimates and Forecasts, by Form (2020-2032) (USD Billion)
11.4.14.4 Rest of Asia Pacific Argon Market Estimates and Forecasts, by End-Use Industry (2020-2032) (USD Billion)
11.5 Middle East and Africa
11.5.1 Middle East
11.5.1.1 Trends Analysis
11.5.1.2 Middle East Argon Market Estimates and Forecasts, by Country (2020-2032) (USD Billion)
11.5.1.3 Middle East Argon Market Estimates and Forecasts, by Grade (2020-2032) (USD Billion)
11.5.1.4 Middle East Argon Market Estimates and Forecasts, by Storage & Distribution (2020-2032) (USD Billion)
11.5.1.5 Middle East Argon Market Estimates and Forecasts, by Form (2020-2032) (USD Billion)
11.5.1.6 Middle East Argon Market Estimates and Forecasts, by End-Use Industry (2020-2032) (USD Billion)
11.5.1.7 UAE
11.5.1.7.1 UAE Argon Market Estimates and Forecasts, by Grade (2020-2032) (USD Billion)
11.5.1.7.2 UAE Argon Market Estimates and Forecasts, by Storage & Distribution (2020-2032) (USD Billion)
11.5.1.7.3 UAE Argon Market Estimates and Forecasts, by Form (2020-2032) (USD Billion)
11.5.1.7.4 UAE Argon Market Estimates and Forecasts, by End-Use Industry (2020-2032) (USD Billion)
11.5.1.8 Egypt
11.5.1.8.1 Egypt Argon Market Estimates and Forecasts, by Grade (2020-2032) (USD Billion)
11.5.1.8.2 Egypt Argon Market Estimates and Forecasts, by Storage & Distribution (2020-2032) (USD Billion)
11.5.1.8.3 Egypt Argon Market Estimates and Forecasts, by Form (2020-2032) (USD Billion)
11.5.1.8.4 Egypt Argon Market Estimates and Forecasts, by End-Use Industry (2020-2032) (USD Billion)
11.5.1.9 Saudi Arabia
11.5.1.9.1 Saudi Arabia Argon Market Estimates and Forecasts, by Grade (2020-2032) (USD Billion)
11.5.1.9.2 Saudi Arabia Argon Market Estimates and Forecasts, by Storage & Distribution (2020-2032) (USD Billion)
11.5.1.9.3 Saudi Arabia Argon Market Estimates and Forecasts, by Form (2020-2032) (USD Billion)
11.5.1.9.4 Saudi Arabia Argon Market Estimates and Forecasts, by End-Use Industry (2020-2032) (USD Billion)
11.5.1.10 Qatar
11.5.1.10.1 Qatar Argon Market Estimates and Forecasts, by Grade (2020-2032) (USD Billion)
11.5.1.10.2 Qatar Argon Market Estimates and Forecasts, by Storage & Distribution (2020-2032) (USD Billion)
11.5.1.10.3 Qatar Argon Market Estimates and Forecasts, by Form (2020-2032) (USD Billion)
11.5.1.10.4 Qatar Argon Market Estimates and Forecasts, by End-Use Industry (2020-2032) (USD Billion)
11.5.1.11 Rest of Middle East
11.5.1.11.1 Rest of Middle East Argon Market Estimates and Forecasts, by Grade (2020-2032) (USD Billion)
11.5.1.11.2 Rest of Middle East Argon Market Estimates and Forecasts, by Storage & Distribution (2020-2032) (USD Billion)
11.5.1.11.3 Rest of Middle East Argon Market Estimates and Forecasts, by Form (2020-2032) (USD Billion)
11.5.1.11.4 Rest of Middle East Argon Market Estimates and Forecasts, by End-Use Industry (2020-2032) (USD Billion)
11.5.2 Africa
11.5.2.1 Trends Analysis
11.5.2.2 Africa Argon Market Estimates and Forecasts, by Country (2020-2032) (USD Billion)
11.5.2.3 Africa Argon Market Estimates and Forecasts, by Grade (2020-2032) (USD Billion)
11.5.2.4 Africa Argon Market Estimates and Forecasts, by Storage & Distribution (2020-2032) (USD Billion)
11.5.2.5 Africa Argon Market Estimates and Forecasts, by Form (2020-2032) (USD Billion)
11.5.2.6 Africa Argon Market Estimates and Forecasts, by End-Use Industry (2020-2032) (USD Billion)
11.5.2.7 South Africa
11.5.2.7.1 South Africa Argon Market Estimates and Forecasts, by Grade (2020-2032) (USD Billion)
11.5.2.7.2 South Africa Argon Market Estimates and Forecasts, by Storage & Distribution (2020-2032) (USD Billion)
11.5.2.7.3 South Africa Argon Market Estimates and Forecasts, by Form (2020-2032) (USD Billion)
11.5.2.7.4 South Africa Argon Market Estimates and Forecasts, by End-Use Industry (2020-2032) (USD Billion)
11.5.2.8 Nigeria
11.5.2.8.1 Nigeria Argon Market Estimates and Forecasts, by Grade (2020-2032) (USD Billion)
11.5.2.8.2 Nigeria Argon Market Estimates and Forecasts, by Storage & Distribution (2020-2032) (USD Billion)
11.5.2.8.3 Nigeria Argon Market Estimates and Forecasts, by Form (2020-2032) (USD Billion)
11.5.2.8.4 Nigeria Argon Market Estimates and Forecasts, by End-Use Industry (2020-2032) (USD Billion)
11.5.2.9 Rest of Africa
11.5.2.9.1 Rest of Africa Argon Market Estimates and Forecasts, by Grade (2020-2032) (USD Billion)
11.5.2.9.2 Rest of Africa Argon Market Estimates and Forecasts, by Storage & Distribution (2020-2032) (USD Billion)
11.5.2.9.3 Rest of Africa Argon Market Estimates and Forecasts, by Form (2020-2032) (USD Billion)
11.5.2.9.4 Rest of Africa Argon Market Estimates and Forecasts, by End-Use Industry (2020-2032) (USD Billion)
11.6 Latin America
11.6.1 Trends Analysis
11.6.2 Latin America Argon Market Estimates and Forecasts, by Country (2020-2032) (USD Billion)
11.6.3 Latin America Argon Market Estimates and Forecasts, by Grade (2020-2032) (USD Billion)
11.6.4 Latin America Argon Market Estimates and Forecasts, by Storage & Distribution (2020-2032) (USD Billion)
11.6.5 Latin America Argon Market Estimates and Forecasts, by Form (2020-2032) (USD Billion)
11.6.6 Latin America Argon Market Estimates and Forecasts, by End-Use Industry (2020-2032) (USD Billion)
11.6.7 Brazil
11.6.7.1 Brazil Argon Market Estimates and Forecasts, by Grade (2020-2032) (USD Billion)
11.6.7.2 Brazil Argon Market Estimates and Forecasts, by Storage & Distribution (2020-2032) (USD Billion)
11.6.7.3 Brazil Argon Market Estimates and Forecasts, by Form (2020-2032) (USD Billion)
11.6.7.4 Brazil Argon Market Estimates and Forecasts, by End-Use Industry (2020-2032) (USD Billion)
11.6.8 Argentina
11.6.8.1 Argentina Argon Market Estimates and Forecasts, by Grade (2020-2032) (USD Billion)
11.6.8.2 Argentina Argon Market Estimates and Forecasts, by Storage & Distribution (2020-2032) (USD Billion)
11.6.8.3 Argentina Argon Market Estimates and Forecasts, by Form (2020-2032) (USD Billion)
11.6.8.4 Argentina Argon Market Estimates and Forecasts, by End-Use Industry (2020-2032) (USD Billion)
11.6.9 Colombia
11.6.9.1 Colombia Argon Market Estimates and Forecasts, by Grade (2020-2032) (USD Billion)
11.6.9.2 Colombia Argon Market Estimates and Forecasts, by Storage & Distribution (2020-2032) (USD Billion)
11.6.9.3 Colombia Argon Market Estimates and Forecasts, by Form (2020-2032) (USD Billion)
11.6.9.4 Colombia Argon Market Estimates and Forecasts, by End-Use Industry (2020-2032) (USD Billion)
11.6.10 Rest of Latin America
11.6.10.1 Rest of Latin America Argon Market Estimates and Forecasts, by Grade (2020-2032) (USD Billion)
11.6.10.2 Rest of Latin America Argon Market Estimates and Forecasts, by Storage & Distribution (2020-2032) (USD Billion)
11.6.10.3 Rest of Latin America Argon Market Estimates and Forecasts, by Form (2020-2032) (USD Billion)
11.6.10.4 Rest of Latin America Argon Market Estimates and Forecasts, by End-Use Industry (2020-2032) (USD Billion)
12. Company Profiles
12.1 Linde plc
12.1.1 Company Overview
12.1.2 Financial
12.1.3 Products/ Services Offered
12.1.4 SWOT Analysis
12.2 Air Products and Chemicals Inc.
12.2.1 Company Overview
12.2.2 Financial
12.2.3 Products/ Services Offered
12.2.4 SWOT Analysis
12.3 L'Air Liquide S.A.
12.3.1 Company Overview
12.3.2 Financial
12.3.3 Products/ Services Offered
12.3.4 SWOT Analysis
12.4 Nippon Sanso Holdings Corporation (Taiyo Nippon Sanso Corporation)
12.4.1 Company Overview
12.4.2 Financial
12.4.3 Products/ Services Offered
12.4.4 SWOT Analysis
12.5 Messer Group GmbH
12.5.1 Company Overview
12.5.2 Financial
12.5.3 Products/ Services Offered
12.5.4 SWOT Analysis
12.6 Iwatani Corporation
12.6.1 Company Overview
12.6.2 Financial
12.6.3 Products/ Services Offered
12.6.4 SWOT Analysis
12.7 Air Water Inc.
12.7.1 Company Overview
12.7.2 Financial
12.7.3 Products/ Services Offered
12.7.4 SWOT Analysis
12.8 Gulf Cryo Holding K.S.C.C.
12.8.1 Company Overview
12.8.2 Financial
12.8.3 Products/ Services Offered
12.8.4 SWOT Analysis
12.9 SIAD S.p.A.
12.9.1 Company Overview
12.9.2 Financial
12.9.3 Products/ Services Offered
12.9.4 SWOT Analysis
12.10 SOL S.p.A.
12.10.1 Company Overview
12.10.2 Financial
12.10.3 Products/ Services Offered
12.10.4 SWOT Analysis
13. Use Cases and Best Practices
14. Conclusion
An accurate research report requires proper strategizing as well as implementation. There are multiple factors involved in the completion of good and accurate research report and selecting the best methodology to compete the research is the toughest part. Since the research reports we provide play a crucial role in any company’s decision-making process, therefore we at SNS Insider always believe that we should choose the best method which gives us results closer to reality. This allows us to reach at a stage wherein we can provide our clients best and accurate investment to output ratio.
Each report that we prepare takes a timeframe of 350-400 business hours for production. Starting from the selection of titles through a couple of in-depth brain storming session to the final QC process before uploading our titles on our website we dedicate around 350 working hours. The titles are selected based on their current market cap and the foreseen CAGR and growth.
The 5 steps process:
Step 1: Secondary Research:
Secondary Research or Desk Research is as the name suggests is a research process wherein, we collect data through the readily available information. In this process we use various paid and unpaid databases which our team has access to and gather data through the same. This includes examining of listed companies’ annual reports, Journals, SEC filling etc. Apart from this our team has access to various associations across the globe across different industries. Lastly, we have exchange relationships with various university as well as individual libraries.
Step 2: Primary Research
When we talk about primary research, it is a type of study in which the researchers collect relevant data samples directly, rather than relying on previously collected data. This type of research is focused on gaining content specific facts that can be sued to solve specific problems. Since the collected data is fresh and first hand therefore it makes the study more accurate and genuine.
We at SNS Insider have divided Primary Research into 2 parts.
Part 1 wherein we interview the KOLs of major players as well as the upcoming ones across various geographic regions. This allows us to have their view over the market scenario and acts as an important tool to come closer to the accurate market numbers. As many as 45 paid and unpaid primary interviews are taken from both the demand and supply side of the industry to make sure we land at an accurate judgement and analysis of the market.
This step involves the triangulation of data wherein our team analyses the interview transcripts, online survey responses and observation of on filed participants. The below mentioned chart should give a better understanding of the part 1 of the primary interview.
Part 2: In this part of primary research the data collected via secondary research and the part 1 of the primary research is validated with the interviews from individual consultants and subject matter experts.
Consultants are those set of people who have at least 12 years of experience and expertise within the industry whereas Subject Matter Experts are those with at least 15 years of experience behind their back within the same space. The data with the help of two main processes i.e., FGDs (Focused Group Discussions) and IDs (Individual Discussions). This gives us a 3rd party nonbiased primary view of the market scenario making it a more dependable one while collation of the data pointers.
Step 3: Data Bank Validation
Once all the information is collected via primary and secondary sources, we run that information for data validation. At our intelligence centre our research heads track a lot of information related to the market which includes the quarterly reports, the daily stock prices, and other relevant information. Our data bank server gets updated every fortnight and that is how the information which we collected using our primary and secondary information is revalidated in real time.
Step 4: QA/QC Process
After all the data collection and validation our team does a final level of quality check and quality assurance to get rid of any unwanted or undesired mistakes. This might include but not limited to getting rid of the any typos, duplication of numbers or missing of any important information. The people involved in this process include technical content writers, research heads and graphics people. Once this process is completed the title gets uploader on our platform for our clients to read it.
Step 5: Final QC/QA Process:
This is the last process and comes when the client has ordered the study. In this process a final QA/QC is done before the study is emailed to the client. Since we believe in giving our clients a good experience of our research studies, therefore, to make sure that we do not lack at our end in any way humanly possible we do a final round of quality check and then dispatch the study to the client.
Key Segments:
By Grade
Industrial
High Purity
Ultra-High Purity
By Storage & Distribution
Cylinders
Bulk & Microbulk
On-Site Generation
By Form
Liquid Argon
Gaseous Argon
By End-Use Industry
Metal Manufacturing & Fabrication
Chemicals
Energy
Healthcare
Electronics & Semiconductors
Aerospace & Automotive
Others
Request for Segment Customization as per your Business Requirement: Segment Customization Request
Regional Coverage:
North America
US
Canada
Mexico
Europe
Eastern Europe
Poland
Romania
Hungary
Turkey
Rest of Eastern Europe
Western Europe
Germany
France
UK
Italy
Spain
Netherlands
Switzerland
Austria
Rest of Western Europe
Asia Pacific
China
India
Japan
South Korea
Vietnam
Singapore
Australia
Rest of Asia Pacific
Middle East & Africa
Middle East
UAE
Egypt
Saudi Arabia
Qatar
Rest of Middle East
Africa
Nigeria
South Africa
Rest of Africa
Latin America
Brazil
Argentina
Colombia
Rest of Latin America
Request for Country Level Research Report: Country Level Customization Request
Available Customization
With the given market data, SNS Insider offers customization as per the company’s specific needs. The following customization options are available for the report:
Detailed Volume Analysis
Criss-Cross segment analysis (e.g. Product X Application)
Competitive Product Benchmarking
Geographic Analysis
Additional countries in any of the regions
Customized Data Representation
Detailed analysis and profiling of additional market players
Calcined Bauxite Market size was USD 1.7 billion in 2023 and is expected to reach USD 2.5 billion by 2032, growing at a CAGR of 4.1% from 2024 to 2032.
The Sheet Metal Market Size was valued at USD 334.86 billion in 2023 and is expected to reach USD 510.92 billion by 2032 and grow at a CAGR of 5.51% over the forecast period 2024-2032.
The Green Fertilizer Market Size was valued at USD 2.15 billion in 2023, and is expected to reach USD 3.53 billion by 2032, and grow at a CAGR of 5.65% over the forecast period 2024-2032.
The Marine Lubricants Market Size was valued at USD 6.5 Billion in 2023 and is expected to reach USD 7.8 Billion by 2032 and grow at a CAGR of 2.07% over the forecast period 2024-2032.
Ammonia Market size was USD 79.1 billion in 2023 and is expected to reach USD 121.5 billion by 2032 and grow at a CAGR of 4.9% from 2024 to 2032.
The Battery Coating Market Size was valued at USD 325 million in 2023 and is expected to reach USD 1130 million by 2032 and grow at a CAGR of 14.8% over the forecast period 2024-2032.
Hi! Click one of our member below to chat on Phone