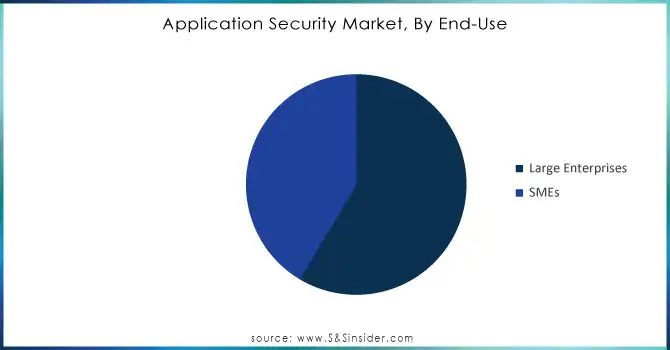
Get more information on Application Security Market - Request Sample Report
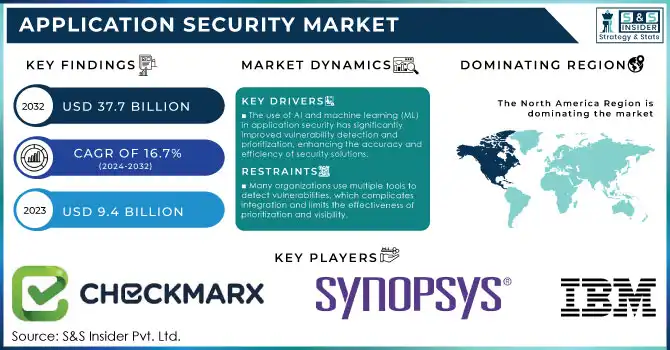
Application Security Market Size was valued at USD 9.4 Billion in 2023 and is expected to reach USD 37.7 Billion by 2032, growing at a CAGR of 16.7% over the forecast period 2024-2032.
The application security market has become a cornerstone of cybersecurity strategies worldwide, driven by rising cyber threats, compliance needs, and the rapid adoption of digital technologies. In 2023, the global market reached a valuation of $31 billion, underscoring its critical role in protecting sensitive applications across sectors. Governments have been instrumental in shaping the market. For instance, the U.S. government introduced the Cybersecurity Maturity Model Certification (CMMC) to the security posture of defense contractors, emphasizing secure application practices. Similarly, the European Union’s General Data Protection Regulation (GDPR) continues to enforce stringent rules to protect personal data, with fines for non-compliance reaching as high as €20 million or 4% of global turnover, whichever is greater.
The rise in cyberattacks further amplifies the demand for application security solutions. A report by the European Union Agency for Cybersecurity (ENISA) highlighted a 300% increase in cyberattacks since 2020, with web and mobile applications frequently targeted due to their ubiquity and vulnerability. Governments in regions like Asia-Pacific have also implemented protective frameworks, such as India’s Personal Data Protection Bill, which mandates robust security for applications managing personal and financial data. These regulatory efforts, combined with the growing digitization of industries and increased adoption of cloud services, have established application security as an essential investment for enterprises.
Organizations are increasingly integrating intelligent solutions into their application security systems for enhanced threat detection and prevention. These technologies help businesses identify and address potential security risks in real-time, reducing the likelihood of data breaches and other incidents. By analyzing patterns and detecting anomalies, these systems can proactively spot emerging threats. Additionally, they enable a rapid response to security incidents, minimizing potential damage. In October 2023, Digital.ai Software Inc. introduced Denali, a DevSecOps platform for web applications, designed to automate software delivery and manage security using intelligent solutions. This platform empowers organizations to govern and orchestrate code with AI-assisted development, streamlining their security processes and improving efficiency.
Market Dynamics
Drivers
The use of AI and machine learning (ML) in application security has significantly improved vulnerability detection and prioritization, enhancing the accuracy and efficiency of security solutions.
The rising adoption of APIs has expanded attack surfaces, making API security a critical focus for enterprises. Application security solutions now emphasize attack surface management to ensure continuous monitoring and risk prioritization for APIs.
Organizations are adopting continuous security testing during all stages of the software development lifecycle (SDLC) to identify vulnerabilities proactively.
The integration of artificial intelligence (AI) and machine learning (ML) into application security is revolutionizing threat detection and mitigation. AI-powered tools can analyze vast amounts of code and system data to identify vulnerabilities with precision. For instance, in 2023, organizations using AI-enhanced application security reported detecting 40% more vulnerabilities compared to traditional methods. AI's capabilities in predictive analytics have enabled early identification of potential threats. For example, companies implementing AI-based anomaly detection systems have reduced false positive rates by over 30%, allowing security teams to focus on critical risks. A notable case is Google's implementation of ML algorithms for its application security, which helped automate code vulnerability assessments across its global infrastructure. Additionally, AI and ML streamline remediation. Automated tools can prioritize threats based on severity and provide actionable insights. GitHub Copilot, an AI assistant for developers, has incorporated security checks to assist programmers in writing secure code during development and addressing vulnerabilities before deployment.
The rapid evolution of generative AI has also enhanced attack simulation techniques. Organizations now simulate complex attacks on applications to fortify defenses. With AI's growing adoption, it is estimated that by 2025, automated security tools will handle 75% of application vulnerability management tasks, significantly reducing response times. These advancements underscore AI's transformative role in the application security domain, making it indispensable for modern enterprises.
Restraints:
Relying on disparate security tools to identify and prioritize application vulnerabilities poses huge complications for organizations. These tools often lack seamless integration, resulting in fragmented workflows and inconsistent data interpretations. It also makes it difficult to obtain complete visibility into application vulnerabilities and effectively prioritize threats. A common complaint from organizations is that being able to correlate disparate data has proven challenging, wasting time and resources while hindering effective remediation. The overlapping features of these tools introduce redundancies that force already resource-challenged security teams to expend operational overhead. Moreover, as organizations do not have unified platforms or centralized management to tackle vulnerabilities their real-time addressability becomes difficult which increases the risk of real-time exploitation.
By Deployment
In 2023, the on-premises enterprise video segment held the largest revenue share of 62%, as the on-premises solution is popular among industries paying high attention to data security and control. Such deployment is favored especially in regulated industries organizations like healthcare, BFSI, and Government services, requiring adherence to strict data protection laws. The California Consumer Privacy Act (CCPA), for example, has forced organizations to keep more stringent control of consumer data, which on-premises solutions help facilitate.
Another factor that drives organizations with legacy IT infrastructures to on-premises deployments; systems can easily be integrated with existing systems and it avoids the cumbersome task of migrating sensitive data to the cloud. Additionally, on-premise solutions enable organizations to customize all security protocols to match the environment within which they work, providing maximum protection. This segment is also bolstered by the government's focus on local data storage and compliance. For instance, India, in its current data protection bill, aims for data localization, which compels firms to move towards on-premises systems for compliance.
By Type
The web application security segment led the market in 2023 with the largest market share owing to the high volume and growing sophistication of web-based attacks. As per the official statement from ENISA, credential theft and phishing scams are the most common cyber threats having the most direct impact on web app security requirements. Especially in BFSI and retail spaces, where applications manage sensitive financial information and high transaction volumes.
This segment has been largely driven by government mandates. For example, the US Cybersecurity and Infrastructure Security Agency (CISA) recommended organizations to protect web applications from commonly exploited vulnerabilities such as SQL injection and Cross-site scripting (XSS), etc. Likewise, GDPR in Europe lays heavy emphasis on securing consumer data on digital platforms, making web app security protocols imperative. The "new normal" created by COVID-19 and the subsequent shift towards e-commerce and online platforms to keep the business afloat has now made it increasingly apparent why there is a growing need to invest in advanced security technology.
By End-Use
In 2023, the Application Security market was led by the BFSI sector, which commanded more than 19% of the overall revenue across the globe as it holds an unprecedented amount of exposure against cyber-attacks. The financial services sector is under attack nearly 300 times more than any other service sector due to the value that financial data and transactions hold. To address such risk factors, governments and regulatory bodies have established stringent guidelines. The Reserve Bank of India (RBI) made multi-factor authentication on online banking apps mandatory, while Europe is now focused on strong customer authentication (SCA) of payment apps under the revised Payment Services Directive (PSD2).
Also, the increased pace of the digital banking transition has been important. The COVID-19 pandemic accelerated the adoption of digital financial services, with mobile banking transactions surging by over 50% globally. But this transition has also resulted in a larger attack surface, and as such, it has forced financial institutions to make substantial investments in application security. Real-time monitoring, Encryption, and AI-Driven Threat Detection are some of the unique and innovative solutions that are being integrated into BFSI applications to ensure customer trust and the integrity of the data being exchanged.
Need any customization research on Application Security Market - Enquiry Now
Regional Analysis
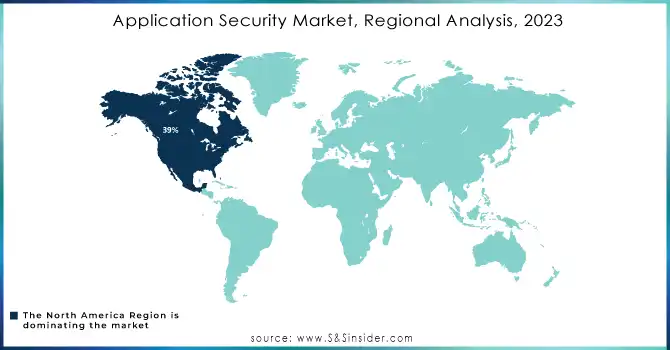
In 2023, North America held the largest share of the application security market 39% globally, which is attributed to the technological advancements in application security solutions & services, and strict compliance regulatory frameworks like the California Consumer Privacy Act (CCPA) & the Health Insurance Portability and Accountability Act (HIPAA). North America is expected to maintain its dominance throughout the forecast period, owing to the early implementation of cloud services and an increase in the number of data breaches affecting enterprises in this region U.S. firms lose an average of $9.48 million per data breach, claims IBM's Cost of a Data Breach Report.
Europe held a significant share of the market in terms of revenue owing to an increasing need for GDPR compliance and a tremendous jump in cyberattacks. ENISA says attacks aimed at European businesses have increased threefold, calling for better security solutions. Meanwhile, the fastest growth rate will be seen by the application security market in the Asia-Pacific region where the digitalization boom, smartphone proliferation, and increase in cyber market spending are privy to the only reasons for this expected growth of the region. The strong CAGR of the region in 2023 is attributed to the US Government initiatives like Digital India by India, and Internet Plus by China, leading to the application wealth. With increasing cyber threats and more regulations such as the India Personal Data Protection Bill, advanced security solutions are a necessity. Furthermore, the growing trend of elastically using cloud resources by SMEs across various countries, including Singapore and Australia, broadened the market as Asia-Pacific becomes a faster-growing market for application security investments.
Key Players
Service Providers / Manufacturers:
IBM Corporation (IBM AppScan, IBM Security Verify)
Synopsys, Inc. (Coverity, Black Duck)
Checkmarx (Checkmarx SAST, Checkmarx IAST)
Imperva (Imperva Data Security Platform, Imperva Web Application Firewall)
Veracode (Veracode Static Analysis, Veracode Dynamic Analysis)
Fortinet, Inc. (FortiWeb, FortiWeb Cloud WAF-as-a-Service)
Palo Alto Networks, Inc. (Prisma Cloud, App-ID)
Micro Focus (OpenText) (Fortify Static Code Analyzer, Fortify on Demand)
Trend Micro (Trend Micro Cloud One, Trend Micro Deep Security)
Qualys, Inc. (Qualys Web Application Scanning, Qualys Web Application Firewall)
Users of Application Security Solutions
JPMorgan Chase & Co.
Amazon Web Services (AWS)
Walmart, Inc.
Meta Platforms, Inc.
Microsoft Corporation
UnitedHealth Group
Tencent Holdings
PayPal Holdings, Inc.
Samsung Electronics
Bank of America
Recent Developments
The Imperva Data Security Platform was integrated through a partnership with Help AG in December 2023 to provide additional visibility into data sources. This partnership will also allow Help AG to provide Imperva Application Security solutions customized for the developers.
In August 2023, Synopsys, Inc. partnered with NowSecure and Secure Code Warrior to make its application security testing solutions better. This partnership brought with it Synopsys Developer Security Training and Synopsys Mobile Application Security Testing.
Report Attributes | Details |
Market Size in 2023 |
USD 9.4 Billion |
Market Size by 2031 |
USD 37.7 Billion |
CAGR | CAGR 16.7% From 2024 to 2032 |
Base Year | 2023 |
Forecast Period | 2024-2032 |
Historical Data | 2020-2022 |
Report Scope & Coverage | Market Size, Segments Analysis, Competitive Landscape, Regional Analysis, DROC & SWOT Analysis, Forecast Outlook |
Key Segments |
• by Component (Solution and Services) • by types ( Web Application Security, Mobile Application Security) • by Deployment (Cloud, On-premise) |
Regional Analysis/Coverage | North America (US, Canada, Mexico), Europe (Eastern Europe [Poland, Romania, Hungary, Turkey, Rest of Eastern Europe] Western Europe] Germany, France, UK, Italy, Spain, Netherlands, Switzerland, Austria, Rest of Western Europe]), Asia Pacific (China, India, Japan, South Korea, Vietnam, Singapore, Australia, Rest of Asia Pacific), Middle East & Africa (Middle East [UAE, Egypt, Saudi Arabia, Qatar, Rest of Middle East], Africa [Nigeria, South Africa, Rest of Africa], Latin America (Brazil, Argentina, Colombia, Rest of Latin America) |
Company Profiles | IBM Corporation, Synopsys, Inc., Checkmarx, Imperva, Veracode, Fortinet, Inc., Palo Alto Networks, Inc., Micro Focus (OpenText), Trend Micro, Qualys, Inc. |
Key Drivers |
• The use of AI and machine learning (ML) in application security has significantly improved vulnerability detection and prioritization, enhancing the accuracy and efficiency of security solutions. • The rising adoption of APIs has expanded attack surfaces, making API security a critical focus for enterprises. Application security solutions now emphasize attack surface management to ensure continuous monitoring and risk prioritization for APIs • Organizations are adopting continuous security testing during all stages of the software development lifecycle (SDLC) to identify vulnerabilities proactively. |
Market Restraints |
• Many organizations use multiple tools to detect vulnerabilities, which complicates integration and limits the effectiveness of prioritization and visibility • Conducting comprehensive security reviews for code changes is time-consuming and expensive. Many organizations fail to review many code changes, leaving potential vulnerabilities unaddressed |
Ans: The on-premises enterprise video segment dominated the market with largest revenue share of 62% in 2023.
Ans:
Ans. The CAGR of the Application Security Market is 16.7% During the forecast period of 2024-2032.
Ans: The North American region dominated the Application Security Market in 2023.
Ans. The projected market size for the Application Security Market is USD 37.7 billion by 2032.
Table of Contents:
1. Introduction
1.1 Market Definition
1.2 Scope (Inclusion and Exclusions)
1.3 Research Assumptions
2. Executive Summary
2.1 Market Overview
2.2 Regional Synopsis
2.3 Competitive Summary
3. Research Methodology
3.1 Top-Down Approach
3.2 Bottom-up Approach
3.3. Data Validation
3.4 Primary Interviews
4. Market Dynamics Impact Analysis
4.1 Market Driving Factors Analysis
4.1.1 Drivers
4.1.2 Restraints
4.1.3 Opportunities
4.1.4 Challenges
4.2 PESTLE Analysis
4.3 Porter’s Five Forces Model
5. Statistical Insights and Trends Reporting
5.1 Feature Analysis, 2023
5.2 User Demographics, 2023
5.3 Integration Capabilities, by Software, 2023
5.4 Impact on Decision-making
6. Competitive Landscape
6.1 List of Major Companies, By Region
6.2 Market Share Analysis, By Region
6.3 Product Benchmarking
6.3.1 Product specifications and features
6.3.2 Pricing
6.4 Strategic Initiatives
6.4.1 Marketing and promotional activities
6.4.2 Distribution and supply chain strategies
6.4.3 Expansion plans and new product launches
6.4.4 Strategic partnerships and collaborations
6.5 Technological Advancements
6.6 Market Positioning and Branding
7. Application Security Market Segmentation, By Type
7.1 Chapter Overview
7.2 Web Application Security
7.2.1 Web Application Security Market Trends Analysis (2020-2032)
7.2.2 Web Application Security Market Size Estimates And Forecasts To 2032 (USD Billion)
7.3 Mobile Application Security
7.3.1 Mobile Application Security Market Trends Analysis (2020-2032)
7.3.2 Mobile Application Security Deposition Market Size Estimates And Forecasts To 2032 (USD Billion)
8. Application Security Market Segmentation, By Deployment Mode
8.1 Chapter Overview
8.2 Cloud
8.2.1 Cloud Market Trends Analysis (2020-2032)
8.2.2 Cloud Market Size Estimates And Forecasts To 2032 (USD Billion)
8.3 On-Premises
8.3.1 On-Premises Market Trends Analysis (2020-2032)
8.3.2 On-Premises Market Size Estimates And Forecasts To 2032 (USD Billion)
9. Application Security Market Segmentation, By Component
9.1 Chapter Overview
9.2 Solutions
9.2.1 Solutions Market Trends Analysis (2020-2032)
9.2.2 Solutions Market Size Estimates And Forecasts To 2032 (USD Billion)
9.2.3 Security Testing Tools
9.2.3.1 Security Testing Tools Market Trends Analysis (2020-2032)
9.2.3.2 Security Testing Tools Deposition Market Size Estimates And Forecasts To 2032 (USD Billion)
9.2.3.1 Static Application Security Testing (SAST)
9.2.3.1.1 Static Application Security Testing (SAST) Market Trends Analysis (2020-2032)
9.2.3.1.2 Static Application Security Testing (SAST) Market Size Estimates And Forecasts To 2032 (USD Billion)
9.2.3.2 Dynamic Application Security Testing (DAST)
9.2.3.2.1 Dynamic Application Security Testing (DAST) Market Trends Analysis (2020-2032)
9.2.3.2.2 Dynamic Application Security Testing (DAST) Deposition Market Size Estimates And Forecasts To 2032 (USD Billion)
9.2.3.3 Interactive Application Security Testing (IAST)
9.2.3.3.1 Interactive Application Security Testing (IAST) Market Trends Analysis (2020-2032)
9.2.3.3.2 Interactive Application Security Testing (IAST) Market Size Estimates And Forecasts To 2032 (USD Billion)
9.2.3.4 Runtime Application Self-Protection
9.2.3.4.1 Runtime Application Self-Protection Market Trends Analysis (2020-2032)
9.2.3.4.2 Runtime Application Self-Protection Deposition Market Size Estimates And Forecasts To 2032 (USD Billion)
9.2.4 Container Security
9.2.4.1 Container Security Market Trends Analysis (2020-2032)
9.2.4.2 Container Security Market Size Estimates And Forecasts To 2032 (USD Billion)
9.2.5 API Security
9.2.5.1 API Security Market Trends Analysis (2020-2032)
9.2.5.2 API Security Market Size Estimates And Forecasts To 2032 (USD Billion)
9.2.6 Others
9.2.6.1 Others Market Trends Analysis (2020-2032)
9.2.6.2 Others Market Size Estimates And Forecasts To 2032 (USD Billion)
9.3 Services
9.3.1 Services Market Trends Analysis (2020-2032)
9.3.2 Services Market Size Estimates And Forecasts To 2032 (USD Billion)
9.3.3 Professional Services
9.3.3.1 Professional Services Market Trends Analysis (2020-2032)
9.3.3.2 Professional Services Market Size Estimates And Forecasts To 2032 (USD Billion)
9.3.4 Managed Services
9.3.4.1 Managed Services Market Trends Analysis (2020-2032)
9.3.4.2 Managed Services Deposition Market Size Estimates And Forecasts To 2032 (USD Billion)
10. Application Security Market Segmentation, By Organization Size
10.1 Chapter Overview
10.2 Large Enterprises
10.2.1 Large Enterprises Market Trends Analysis (2020-2032)
10.2.2 Large Enterprises Market Size Estimates And Forecasts To 2032 (USD Billion)
10.3 SMEs
10.3.1 SMEs Market Trends Analysis (2020-2032)
10.3.2 SMEs Market Size Estimates And Forecasts To 2032 (USD Billion)
11. Application Security Market Segmentation, By Vertical
11.1 Chapter Overview
11.2 Banking, Financial Services, & Insurance (BFSI)
11.2.1 Banking, Financial Services, & Insurance (BFSI) Market Trends Analysis (2020-2032)
11.2.2 Banking, Financial Services, & Insurance (BFSI) Market Size Estimates And Forecasts To 2032 (USD Billion)
11.3 Government And Public Sector
11.3.1 Government And Public Sector Market Trends Analysis (2020-2032)
11.3.2 Government And Public Sector Market Size Estimates And Forecasts To 2032 (USD Billion)
11.4 Healthcare
11.4.1 Healthcare Market Trends Analysis (2020-2032)
11.4.2 Healthcare Market Size Estimates And Forecasts To 2032 (USD Billion)
11.5 Telecommunications
11.5.1 Telecommunications Market Trends Analysis (2020-2032)
11.5.2 Telecommunications Market Size Estimates And Forecasts To 2032 (USD Billion)
11.6 Retail And E-Commerce
11.6.1 Retail And E-Commerce Market Trends Analysis (2020-2032)
11.6.2 Retail And E-Commerce Market Size Estimates And Forecasts To 2032 (USD Billion)
11.7 IT & ITES
11.7.1 IT & ITES Market Trends Analysis (2020-2032)
11.7.2 IT & ITES Market Size Estimates And Forecasts To 2032 (USD Billion)
11.8 Education
11.8.1 Education Market Trends Analysis (2020-2032)
11.8.2 Education Market Size Estimates And Forecasts To 2032 (USD Billion)
11.9 Others
11.9.1 Others Market Trends Analysis (2020-2032)
11.9.2 Others Market Size Estimates And Forecasts To 2032 (USD Billion)
12. Regional Analysis
12.1 Chapter Overview
12.2 North America
12.2.1 Trends Analysis
12.2.2 North America Application Security Market Estimates And Forecasts, By Country (2020-2032) (USD Billion)
12.2.3 North America Application Security Market Estimates And Forecasts, By Type (2020-2032) (USD Billion)
12.2.4 North America Application Security Market Estimates And Forecasts, By Deployment Mode (2020-2032) (USD Billion)
12.2.5 North America Application Security Market Estimates And Forecasts, By Component (2020-2032) (USD Billion)
12.2.6 North America Application Security Market Estimates And Forecasts, By Organization Size (2020-2032) (USD Billion)
12.2.7 North America Application Security Market Estimates And Forecasts, By Vertical (2020-2032) (USD Billion)
12.2.8 USA
12.2.8.1 USA Application Security Market Estimates And Forecasts, By Type (2020-2032) (USD Billion)
12.2.8.2 USA Application Security Market Estimates And Forecasts, By Deployment Mode (2020-2032) (USD Billion)
12.2.8.3 USA Application Security Market Estimates And Forecasts, By Component (2020-2032) (USD Billion)
12.2.8.4 USA Application Security Market Estimates And Forecasts, By Organization Size (2020-2032) (USD Billion)
12.2.8.5 USA Application Security Market Estimates And Forecasts, By Vertical (2020-2032) (USD Billion)
12.2.9 Canada
12.2.9.1 Canada Application Security Market Estimates And Forecasts, By Type (2020-2032) (USD Billion)
12.2.9.2 Canada Application Security Market Estimates And Forecasts, By Deployment Mode (2020-2032) (USD Billion)
12.2.9.3 Canada Application Security Market Estimates And Forecasts, By Component (2020-2032) (USD Billion)
12.2.9.4 Canada Application Security Market Estimates And Forecasts, By Organization Size (2020-2032) (USD Billion)
12.2.9.5 Canada Application Security Market Estimates And Forecasts, By Vertical (2020-2032) (USD Billion)
12.2.10 Mexico
12.2.10.1 Mexico Application Security Market Estimates And Forecasts, By Type (2020-2032) (USD Billion)
12.2.10.2 Mexico Application Security Market Estimates And Forecasts, By Deployment Mode (2020-2032) (USD Billion)
12.2.10.3 Mexico Application Security Market Estimates And Forecasts, By Component (2020-2032) (USD Billion)
12.2.10.4 Mexico Application Security Market Estimates And Forecasts, By Organization Size (2020-2032) (USD Billion)
12.2.10.5 Mexico Application Security Market Estimates And Forecasts, By Vertical (2020-2032) (USD Billion)
12.3 Europe
12.3.1 Eastern Europe
12.3.1.1 Trends Analysis
12.3.1.2 Eastern Europe Application Security Market Estimates And Forecasts, By Country (2020-2032) (USD Billion)
12.3.1.3 Eastern Europe Application Security Market Estimates And Forecasts, By Type (2020-2032) (USD Billion)
12.3.1.4 Eastern Europe Application Security Market Estimates And Forecasts, By Deployment Mode (2020-2032) (USD Billion)
12.3.1.5 Eastern Europe Application Security Market Estimates And Forecasts, By Component (2020-2032) (USD Billion)
12.3.1.6 Eastern Europe Application Security Market Estimates And Forecasts, By Organization Size (2020-2032) (USD Billion)
12.3.1.7 Eastern Europe Application Security Market Estimates And Forecasts, By Vertical (2020-2032) (USD Billion)
12.3.1.8 Poland
12.3.1.8.1 Poland Application Security Market Estimates And Forecasts, By Type (2020-2032) (USD Billion)
12.3.1.8.2 Poland Application Security Market Estimates And Forecasts, By Deployment Mode (2020-2032) (USD Billion)
12.3.1.8.3 Poland Application Security Market Estimates And Forecasts, By Component (2020-2032) (USD Billion)
12.3.1.8.4 Poland Application Security Market Estimates And Forecasts, By Organization Size (2020-2032) (USD Billion)
12.3.1.8.5 Poland Application Security Market Estimates And Forecasts, By Vertical (2020-2032) (USD Billion)
12.3.1.9 Romania
12.3.1.9.1 Romania Application Security Market Estimates And Forecasts, By Type (2020-2032) (USD Billion)
12.3.1.9.2 Romania Application Security Market Estimates And Forecasts, By Deployment Mode (2020-2032) (USD Billion)
12.3.1.9.3 Romania Application Security Market Estimates And Forecasts, By Component (2020-2032) (USD Billion)
12.3.1.9.4 Romania Application Security Market Estimates And Forecasts, By Organization Size (2020-2032) (USD Billion)
12.3.1.9.5 Romania Application Security Market Estimates And Forecasts, By Vertical (2020-2032) (USD Billion)
12.3.1.10 Hungary
12.3.1.10.1 Hungary Application Security Market Estimates And Forecasts, By Type (2020-2032) (USD Billion)
12.3.1.10.2 Hungary Application Security Market Estimates And Forecasts, By Deployment Mode (2020-2032) (USD Billion)
12.3.1.10.3 Hungary Application Security Market Estimates And Forecasts, By Component (2020-2032) (USD Billion)
12.3.1.10.4 Hungary Application Security Market Estimates And Forecasts, By Organization Size (2020-2032) (USD Billion)
12.3.1.10.5 Hungary Application Security Market Estimates And Forecasts, By Vertical (2020-2032) (USD Billion)
12.3.1.11 Turkey
12.3.1.11.1 Turkey Application Security Market Estimates And Forecasts, By Type (2020-2032) (USD Billion)
12.3.1.11.2 Turkey Application Security Market Estimates And Forecasts, By Deployment Mode (2020-2032) (USD Billion)
12.3.1.11.3 Turkey Application Security Market Estimates And Forecasts, By Component (2020-2032) (USD Billion)
12.3.1.11.4 Turkey Application Security Market Estimates And Forecasts, By Organization Size (2020-2032) (USD Billion)
12.3.1.11.5 Turkey Application Security Market Estimates And Forecasts, By Vertical (2020-2032) (USD Billion)
12.3.1.12 Rest Of Eastern Europe
12.3.1.12.1 Rest Of Eastern Europe Application Security Market Estimates And Forecasts, By Type (2020-2032) (USD Billion)
12.3.1.12.2 Rest Of Eastern Europe Application Security Market Estimates And Forecasts, By Deployment Mode (2020-2032) (USD Billion)
12.3.1.12.3 Rest Of Eastern Europe Application Security Market Estimates And Forecasts, By Component (2020-2032) (USD Billion)
12.3.1.12.4 Rest Of Eastern Europe Application Security Market Estimates And Forecasts, By Organization Size (2020-2032) (USD Billion)
12.3.1.12.5 Rest Of Eastern Europe Application Security Market Estimates And Forecasts, By Vertical (2020-2032) (USD Billion)
12.3.2 Western Europe
12.3.2.1 Trends Analysis
12.3.2.2 Western Europe Application Security Market Estimates And Forecasts, By Country (2020-2032) (USD Billion)
12.3.2.3 Western Europe Application Security Market Estimates And Forecasts, By Type (2020-2032) (USD Billion)
12.3.2.4 Western Europe Application Security Market Estimates And Forecasts, By Deployment Mode (2020-2032) (USD Billion)
12.3.2.5 Western Europe Application Security Market Estimates And Forecasts, By Component (2020-2032) (USD Billion)
12.3.2.6 Western Europe Application Security Market Estimates And Forecasts, By Organization Size (2020-2032) (USD Billion)
12.3.2.7 Western Europe Application Security Market Estimates And Forecasts, By Vertical (2020-2032) (USD Billion)
12.3.2.8 Germany
12.3.2.8.1 Germany Application Security Market Estimates And Forecasts, By Type (2020-2032) (USD Billion)
12.3.2.8.2 Germany Application Security Market Estimates And Forecasts, By Deployment Mode (2020-2032) (USD Billion)
12.3.2.8.3 Germany Application Security Market Estimates And Forecasts, By Component (2020-2032) (USD Billion)
12.3.2.8.4 Germany Application Security Market Estimates And Forecasts, By Organization Size (2020-2032) (USD Billion)
12.3.2.8.5 Germany Application Security Market Estimates And Forecasts, By Vertical (2020-2032) (USD Billion)
12.3.2.9 France
12.3.2.9.1 France Application Security Market Estimates And Forecasts, By Type (2020-2032) (USD Billion)
12.3.2.9.2 France Application Security Market Estimates And Forecasts, By Deployment Mode (2020-2032) (USD Billion)
12.3.2.9.3 France Application Security Market Estimates And Forecasts, By Component (2020-2032) (USD Billion)
12.3.2.9.4 France Application Security Market Estimates And Forecasts, By Organization Size (2020-2032) (USD Billion)
12.3.2.9.5 France Application Security Market Estimates And Forecasts, By Vertical (2020-2032) (USD Billion)
12.3.2.10 UK
12.3.2.10.1 UK Application Security Market Estimates And Forecasts, By Type (2020-2032) (USD Billion)
12.3.2.10.2 UK Application Security Market Estimates And Forecasts, By Deployment Mode (2020-2032) (USD Billion)
12.3.2.10.3 UK Application Security Market Estimates And Forecasts, By Component (2020-2032) (USD Billion)
12.3.2.10.4 UK Application Security Market Estimates And Forecasts, By Organization Size (2020-2032) (USD Billion)
12.3.2.10.5 UK Application Security Market Estimates And Forecasts, By Vertical (2020-2032) (USD Billion)
12.3.2.11 Italy
12.3.2.11.1 Italy Application Security Market Estimates And Forecasts, By Type (2020-2032) (USD Billion)
12.3.2.11.2 Italy Application Security Market Estimates And Forecasts, By Deployment Mode (2020-2032) (USD Billion)
12.3.2.11.3 Italy Application Security Market Estimates And Forecasts, By Component (2020-2032) (USD Billion)
12.3.2.11.4 Italy Application Security Market Estimates And Forecasts, By Organization Size (2020-2032) (USD Billion)
12.3.2.11.5 Italy Application Security Market Estimates And Forecasts, By Vertical (2020-2032) (USD Billion)
12.3.2.12 Spain
12.3.2.12.1 Spain Application Security Market Estimates And Forecasts, By Type (2020-2032) (USD Billion)
12.3.2.12.2 Spain Application Security Market Estimates And Forecasts, By Deployment Mode (2020-2032) (USD Billion)
12.3.2.12.3 Spain Application Security Market Estimates And Forecasts, By Component (2020-2032) (USD Billion)
12.3.2.12.4 Spain Application Security Market Estimates And Forecasts, By Organization Size (2020-2032) (USD Billion)
12.3.2.12.5 Spain Application Security Market Estimates And Forecasts, By Vertical (2020-2032) (USD Billion)
12.3.2.13 Netherlands
12.3.2.13.1 Netherlands Application Security Market Estimates And Forecasts, By Type (2020-2032) (USD Billion)
12.3.2.13.2 Netherlands Application Security Market Estimates And Forecasts, By Deployment Mode (2020-2032) (USD Billion)
12.3.2.13.3 Netherlands Application Security Market Estimates And Forecasts, By Component (2020-2032) (USD Billion)
12.3.2.13.4 Netherlands Application Security Market Estimates And Forecasts, By Organization Size (2020-2032) (USD Billion)
12.3.2.13.5 Netherlands Application Security Market Estimates And Forecasts, By Vertical (2020-2032) (USD Billion)
12.3.2.14 Switzerland
12.3.2.14.1 Switzerland Application Security Market Estimates And Forecasts, By Type (2020-2032) (USD Billion)
12.3.2.14.2 Switzerland Application Security Market Estimates And Forecasts, By Deployment Mode (2020-2032) (USD Billion)
12.3.2.14.3 Switzerland Application Security Market Estimates And Forecasts, By Component (2020-2032) (USD Billion)
12.3.2.14.4 Switzerland Application Security Market Estimates And Forecasts, By Organization Size (2020-2032) (USD Billion)
12.3.2.12.5 Switzerland Application Security Market Estimates And Forecasts, By Vertical (2020-2032) (USD Billion)
12.3.2.15 Austria
12.3.2.15.1 Austria Application Security Market Estimates And Forecasts, By Type (2020-2032) (USD Billion)
12.3.2.15.2 Austria Application Security Market Estimates And Forecasts, By Deployment Mode (2020-2032) (USD Billion)
12.3.2.15.3 Austria Application Security Market Estimates And Forecasts, By Component (2020-2032) (USD Billion)
12.3.2.15.4 Austria Application Security Market Estimates And Forecasts, By Organization Size (2020-2032) (USD Billion)
12.3.2.15.5 Austria Application Security Market Estimates And Forecasts, By Vertical (2020-2032) (USD Billion)
12.3.2.16 Rest Of Western Europe
12.3.2.16.1 Rest Of Western Europe Application Security Market Estimates And Forecasts, By Type (2020-2032) (USD Billion)
12.3.2.16.2 Rest Of Western Europe Application Security Market Estimates And Forecasts, By Deployment Mode (2020-2032) (USD Billion)
12.3.2.16.3 Rest Of Western Europe Application Security Market Estimates And Forecasts, By Component (2020-2032) (USD Billion)
12.3.2.16.4 Rest Of Western Europe Application Security Market Estimates And Forecasts, By Organization Size (2020-2032) (USD Billion)
12.3.2.16.5 Rest Of Western Europe Application Security Market Estimates And Forecasts, By Vertical (2020-2032) (USD Billion)
12.4 Asia Pacific
12.4.1 Trends Analysis
12.4.2 Asia Pacific Application Security Market Estimates And Forecasts, By Country (2020-2032) (USD Billion)
12.4.3 Asia Pacific Application Security Market Estimates And Forecasts, By Type (2020-2032) (USD Billion)
12.4.4 Asia Pacific Application Security Market Estimates And Forecasts, By Deployment Mode (2020-2032) (USD Billion)
12.4.5 Asia Pacific Application Security Market Estimates And Forecasts, By Component (2020-2032) (USD Billion)
12.4.6 Asia Pacific Application Security Market Estimates And Forecasts, By Organization Size (2020-2032) (USD Billion)
12.4.7 Asia Pacific Application Security Market Estimates And Forecasts, By Vertical (2020-2032) (USD Billion)
12.4.8 China
12.4.8.1 China Application Security Market Estimates And Forecasts, By Type (2020-2032) (USD Billion)
12.4.8.2 China Application Security Market Estimates And Forecasts, By Deployment Mode (2020-2032) (USD Billion)
12.4.8.3 China Application Security Market Estimates And Forecasts, By Component (2020-2032) (USD Billion)
12.4.8.4 China Application Security Market Estimates And Forecasts, By Organization Size (2020-2032) (USD Billion)
12.4.8.5 China Application Security Market Estimates And Forecasts, By Vertical (2020-2032) (USD Billion)
12.4.9 India
12.4.9.1 India Application Security Market Estimates And Forecasts, By Type (2020-2032) (USD Billion)
12.4.9.2 India Application Security Market Estimates And Forecasts, By Deployment Mode (2020-2032) (USD Billion)
12.4.9.3 India Application Security Market Estimates And Forecasts, By Component (2020-2032) (USD Billion)
12.4.9.4 India Application Security Market Estimates And Forecasts, By Organization Size (2020-2032) (USD Billion)
12.4.9.5 India Application Security Market Estimates And Forecasts, By Vertical (2020-2032) (USD Billion)
12.4.10 Japan
12.4.10.1 Japan Application Security Market Estimates And Forecasts, By Type (2020-2032) (USD Billion)
12.4.10.2 Japan Application Security Market Estimates And Forecasts, By Deployment Mode (2020-2032) (USD Billion)
12.4.10.3 Japan Application Security Market Estimates And Forecasts, By Component (2020-2032) (USD Billion)
12.4.10.4 Japan Application Security Market Estimates And Forecasts, By Organization Size (2020-2032) (USD Billion)
12.4.10.5 Japan Application Security Market Estimates And Forecasts, By Vertical (2020-2032) (USD Billion)
12.4.11 South Korea
12.4.11.1 South Korea Application Security Market Estimates And Forecasts, By Type (2020-2032) (USD Billion)
12.4.11.2 South Korea Application Security Market Estimates And Forecasts, By Deployment Mode (2020-2032) (USD Billion)
12.4.11.3 South Korea Application Security Market Estimates And Forecasts, By Component (2020-2032) (USD Billion)
12.4.11.4 South Korea Application Security Market Estimates And Forecasts, By Organization Size (2020-2032) (USD Billion)
12.4.11.5 South Korea Application Security Market Estimates And Forecasts, By Vertical (2020-2032) (USD Billion)
12.4.12 Vietnam
12.4.12.1 Vietnam Application Security Market Estimates And Forecasts, By Type (2020-2032) (USD Billion)
12.4.12.2 Vietnam Application Security Market Estimates And Forecasts, By Deployment Mode (2020-2032) (USD Billion)
12.4.12.3 Vietnam Application Security Market Estimates And Forecasts, By Component (2020-2032) (USD Billion)
12.4.12.4 Vietnam Application Security Market Estimates And Forecasts, By Organization Size (2020-2032) (USD Billion)
12.4.12.5 Vietnam Application Security Market Estimates And Forecasts, By Vertical (2020-2032) (USD Billion)
12.4.13 Singapore
12.4.13.1 Singapore Application Security Market Estimates And Forecasts, By Type (2020-2032) (USD Billion)
12.4.13.2 Singapore Application Security Market Estimates And Forecasts, By Deployment Mode (2020-2032) (USD Billion)
12.4.13.3 Singapore Application Security Market Estimates And Forecasts, By Component (2020-2032) (USD Billion)
12.4.13.4 Singapore Application Security Market Estimates And Forecasts, By Organization Size (2020-2032) (USD Billion)
12.4.13.5 Singapore Application Security Market Estimates And Forecasts, By Vertical (2020-2032) (USD Billion)
12.4.14 Australia
12.4.14.1 Australia Application Security Market Estimates And Forecasts, By Type (2020-2032) (USD Billion)
12.4.14.2 Australia Application Security Market Estimates And Forecasts, By Deployment Mode (2020-2032) (USD Billion)
12.4.14.3 Australia Application Security Market Estimates And Forecasts, By Component (2020-2032) (USD Billion)
12.4.14.4 Australia Application Security Market Estimates And Forecasts, By Organization Size (2020-2032) (USD Billion)
12.4.14.5 Australia Application Security Market Estimates And Forecasts, By Vertical (2020-2032) (USD Billion)
12.4.15 Rest Of Asia Pacific
12.4.15.1 Rest Of Asia Pacific Application Security Market Estimates And Forecasts, By Type (2020-2032) (USD Billion)
12.4.15.2 Rest Of Asia Pacific Application Security Market Estimates And Forecasts, By Deployment Mode (2020-2032) (USD Billion)
12.4.15.3 Rest Of Asia Pacific Application Security Market Estimates And Forecasts, By Component (2020-2032) (USD Billion)
12.4.15.4 Rest Of Asia Pacific Application Security Market Estimates And Forecasts, By Organization Size (2020-2032) (USD Billion)
12.4.15.5 Rest Of Asia Pacific Application Security Market Estimates And Forecasts, By Vertical (2020-2032) (USD Billion)
12.5 Middle East And Africa
12.5.1 Middle East
12.5.1.1 Trends Analysis
12.5.1.2 Middle East Application Security Market Estimates And Forecasts, By Country (2020-2032) (USD Billion)
12.5.1.3 Middle East Application Security Market Estimates And Forecasts, By Type (2020-2032) (USD Billion)
12.5.1.4 Middle East Application Security Market Estimates And Forecasts, By Deployment Mode (2020-2032) (USD Billion)
12.5.1.5 Middle East Application Security Market Estimates And Forecasts, By Component (2020-2032) (USD Billion)
12.5.1.6 Middle East Application Security Market Estimates And Forecasts, By Organization Size (2020-2032) (USD Billion)
12.5.1.7 Middle East Application Security Market Estimates And Forecasts, By Vertical (2020-2032) (USD Billion)
12.5.1.8 UAE
12.5.1.8.1 UAE Application Security Market Estimates And Forecasts, By Type (2020-2032) (USD Billion)
12.5.1.8.2 UAE Application Security Market Estimates And Forecasts, By Deployment Mode (2020-2032) (USD Billion)
12.5.1.8.3 UAE Application Security Market Estimates And Forecasts, By Component (2020-2032) (USD Billion)
12.5.1.8.4 UAE Application Security Market Estimates And Forecasts, By Organization Size (2020-2032) (USD Billion)
12.5.1.8.5 UAE Application Security Market Estimates And Forecasts, By Vertical (2020-2032) (USD Billion)
12.5.1.9 Egypt
12.5.1.9.1 Egypt Application Security Market Estimates And Forecasts, By Type (2020-2032) (USD Billion)
12.5.1.9.2 Egypt Application Security Market Estimates And Forecasts, By Deployment Mode (2020-2032) (USD Billion)
12.5.1.9.3 Egypt Application Security Market Estimates And Forecasts, By Component (2020-2032) (USD Billion)
12.5.1.9.4 Egypt Application Security Market Estimates And Forecasts, By Organization Size (2020-2032) (USD Billion)
12.5.1.9.5 Egypt Application Security Market Estimates And Forecasts, By Vertical (2020-2032) (USD Billion)
12.5.1.10 Saudi Arabia
12.5.1.10.1 Saudi Arabia Application Security Market Estimates And Forecasts, By Type (2020-2032) (USD Billion)
12.5.1.10.2 Saudi Arabia Application Security Market Estimates And Forecasts, By Deployment Mode (2020-2032) (USD Billion)
12.5.1.10.3 Saudi Arabia Application Security Market Estimates And Forecasts, By Component (2020-2032) (USD Billion)
12.5.1.10.4 Saudi Arabia Application Security Market Estimates And Forecasts, By Organization Size (2020-2032) (USD Billion)
12.5.1.10.5 Saudi Arabia Application Security Market Estimates And Forecasts, By Vertical (2020-2032) (USD Billion)
12.5.1.11 Qatar
12.5.1.11.1 Qatar Application Security Market Estimates And Forecasts, By Type (2020-2032) (USD Billion)
12.5.1.11.2 Qatar Application Security Market Estimates And Forecasts, By Deployment Mode (2020-2032) (USD Billion)
12.5.1.11.3 Qatar Application Security Market Estimates And Forecasts, By Component (2020-2032) (USD Billion)
12.5.1.11.4 Qatar Application Security Market Estimates And Forecasts, By Organization Size (2020-2032) (USD Billion)
12.5.1.11.5 Qatar Application Security Market Estimates And Forecasts, By Vertical (2020-2032) (USD Billion)
12.5.1.12 Rest Of Middle East
12.5.1.12.1 Rest Of Middle East Application Security Market Estimates And Forecasts, By Type (2020-2032) (USD Billion)
12.5.1.12.2 Rest Of Middle East Application Security Market Estimates And Forecasts, By Deployment Mode (2020-2032) (USD Billion)
12.5.1.12.3 Rest Of Middle East Application Security Market Estimates And Forecasts, By Component (2020-2032) (USD Billion)
12.5.1.12.4 Rest Of Middle East Application Security Market Estimates And Forecasts, By Organization Size (2020-2032) (USD Billion)
12.5.1.12.5 Rest Of Middle East Application Security Market Estimates And Forecasts, By Vertical (2020-2032) (USD Billion)
12.5.2 Africa
12.5.2.1 Trends Analysis
12.5.2.2 Africa Application Security Market Estimates And Forecasts, By Country (2020-2032) (USD Billion)
12.5.2.3 Africa Application Security Market Estimates And Forecasts, By Type (2020-2032) (USD Billion)
12.5.2.4 Africa Application Security Market Estimates And Forecasts, By Deployment Mode (2020-2032) (USD Billion)
12.5.2.5 Africa Application Security Market Estimates And Forecasts, By Component (2020-2032) (USD Billion)
12.5.2.6 Africa Application Security Market Estimates And Forecasts, By Organization Size (2020-2032) (USD Billion)
12.5.2.7 Africa Application Security Market Estimates And Forecasts, By Vertical (2020-2032) (USD Billion)
12.5.2.8 South Africa
12.5.2.8.1 South Africa Application Security Market Estimates And Forecasts, By Type (2020-2032) (USD Billion)
12.5.2.8.2 South Africa Application Security Market Estimates And Forecasts, By Deployment Mode (2020-2032) (USD Billion)
12.5.2.8.3 South Africa Application Security Market Estimates And Forecasts, By Component (2020-2032) (USD Billion)
12.5.2.8.4 South Africa Application Security Market Estimates And Forecasts, By Organization Size (2020-2032) (USD Billion)
12.5.2.8.5 South Africa Application Security Market Estimates And Forecasts, By Vertical (2020-2032) (USD Billion)
12.5.2.9 Nigeria
12.5.2.9.1 Nigeria Application Security Market Estimates And Forecasts, By Type (2020-2032) (USD Billion)
12.5.2.9.2 Nigeria Application Security Market Estimates And Forecasts, By Deployment Mode (2020-2032) (USD Billion)
12.5.2.9.3 Nigeria Application Security Market Estimates And Forecasts, By Component (2020-2032) (USD Billion)
12.5.2.9.4 Nigeria Application Security Market Estimates And Forecasts, By Organization Size (2020-2032) (USD Billion)
12.5.2.9.5 Nigeria Application Security Market Estimates And Forecasts, By Vertical (2020-2032) (USD Billion)
12.5.2.10 Rest Of Africa
12.5.2.10.1 Rest Of Africa Application Security Market Estimates And Forecasts, By Type (2020-2032) (USD Billion)
12.5.2.10.2 Rest Of Africa Application Security Market Estimates And Forecasts, By Deployment Mode (2020-2032) (USD Billion)
12.5.2.10.3 Rest Of Africa Application Security Market Estimates And Forecasts, By Component (2020-2032) (USD Billion)
12.5.2.10.4 Rest Of Africa Application Security Market Estimates And Forecasts, By Organization Size (2020-2032) (USD Billion)
12.5.2.10.5 Rest Of Africa Application Security Market Estimates And Forecasts, By Vertical (2020-2032) (USD Billion)
12.6 Latin America
12.6.1 Trends Analysis
12.6.2 Latin America Application Security Market Estimates And Forecasts, By Country (2020-2032) (USD Billion)
12.6.3 Latin America Application Security Market Estimates And Forecasts, By Type (2020-2032) (USD Billion)
12.6.4 Latin America Application Security Market Estimates And Forecasts, By Deployment Mode (2020-2032) (USD Billion)
12.6.5 Latin America Application Security Market Estimates And Forecasts, By Component (2020-2032) (USD Billion)
12.6.6 Latin America Application Security Market Estimates And Forecasts, By Organization Size (2020-2032) (USD Billion)
12.6.7 Latin America Application Security Market Estimates And Forecasts, By Vertical (2020-2032) (USD Billion)
12.6.8 Brazil
12.6.8.1 Brazil Application Security Market Estimates And Forecasts, By Type (2020-2032) (USD Billion)
12.6.8.2 Brazil Application Security Market Estimates And Forecasts, By Deployment Mode (2020-2032) (USD Billion)
12.6.8.3 Brazil Application Security Market Estimates And Forecasts, By Component (2020-2032) (USD Billion)
12.6.8.4 Brazil Application Security Market Estimates And Forecasts, By Organization Size (2020-2032) (USD Billion)
12.6.8.5 Brazil Application Security Market Estimates And Forecasts, By Vertical (2020-2032) (USD Billion)
12.6.9 Argentina
12.6.9.1 Argentina Application Security Market Estimates And Forecasts, By Type (2020-2032) (USD Billion)
12.6.9.2 Argentina Application Security Market Estimates And Forecasts, By Deployment Mode (2020-2032) (USD Billion)
12.6.9.3 Argentina Application Security Market Estimates And Forecasts, By Component (2020-2032) (USD Billion)
12.6.9.4 Argentina Application Security Market Estimates And Forecasts, By Organization Size (2020-2032) (USD Billion)
12.6.9.5 Argentina Application Security Market Estimates And Forecasts, By Vertical (2020-2032) (USD Billion)
12.6.10 Colombia
12.6.10.1 Colombia Application Security Market Estimates And Forecasts, By Type (2020-2032) (USD Billion)
12.6.10.2 Colombia Application Security Market Estimates And Forecasts, By Deployment Mode (2020-2032) (USD Billion)
12.6.10.3 Colombia Application Security Market Estimates And Forecasts, By Component (2020-2032) (USD Billion)
12.6.10.4 Colombia Application Security Market Estimates And Forecasts, By Organization Size (2020-2032) (USD Billion)
12.6.10.5 Colombia Application Security Market Estimates And Forecasts, By Vertical (2020-2032) (USD Billion)
12.6.11 Rest Of Latin America
12.6.11.1 Rest Of Latin America Application Security Market Estimates And Forecasts, By Type (2020-2032) (USD Billion)
12.6.11.2 Rest Of Latin America Application Security Market Estimates And Forecasts, By Deployment Mode (2020-2032) (USD Billion)
12.6.11.3 Rest Of Latin America Application Security Market Estimates And Forecasts, By Component (2020-2032) (USD Billion)
12.6.11.4 Rest Of Latin America Application Security Market Estimates And Forecasts, By Organization Size (2020-2032) (USD Billion)
12.6.11.5 Rest Of Latin America Application Security Market Estimates And Forecasts, By Vertical (2020-2032) (USD Billion)
13. Company Profiles
13.1 IBM Corporation
13.1.1 Company Overview
13.1.2 Financial
13.1.3 Products/ LiDAR Offered
13.1.4 SWOT Analysis
13.2 Synopsys, Inc.
13.2.1 Company Overview
13.2.2 Financial
13.2.3 Products/ LiDAR Offered
13.2.4 SWOT Analysis
13.3 Checkmarx
13.3.1 Company Overview
13.3.2 Financial
13.3.3 Products/ LiDAR Offered
13.3.4 SWOT Analysis
13.4 Imperva
13.4.1 Company Overview
13.4.2 Financial
13.4.3 Products/ LiDAR Offered
13.4.4 SWOT Analysis
13.5 Veracode
13.5.1 Company Overview
13.5.2 Financial
13.5.3 Products/ LiDAR Offered
13.5.4 SWOT Analysis
13.6 Fortinet, Inc.
13.6.1 Company Overview
13.6.2 Financial
13.6.3 Products/ LiDAR Offered
13.6.4 SWOT Analysis
13.7 Palo Alto Networks, Inc.
13.7.1 Company Overview
13.7.2 Financial
13.7.3 Products/ LiDAR Offered
13.7.4 SWOT Analysis
13.8 Micro Focus (OpenText)
13.8.1 Company Overview
13.8.2 Financial
13.8.3 Products/ LiDAR Offered
13.8.4 SWOT Analysis
13.9 Trend Micro
13.9.1 Company Overview
13.9.2 Financial
13.9.3 Products/ LiDAR Offered
13.9.4 SWOT Analysis
13.10 Qualys, Inc.
13.12.1 Company Overview
13.12.2 Financial
13.12.3 Products/ LiDAR Offered
13.12.4 SWOT Analysis
14. Use Cases and Best Practices
15. Conclusion
An accurate research report requires proper strategizing as well as implementation. There are multiple factors involved in the completion of good and accurate research report and selecting the best methodology to compete the research is the toughest part. Since the research reports we provide play a crucial role in any company’s decision-making process, therefore we at SNS Insider always believe that we should choose the best method which gives us results closer to reality. This allows us to reach at a stage wherein we can provide our clients best and accurate investment to output ratio.
Each report that we prepare takes a timeframe of 350-400 business hours for production. Starting from the selection of titles through a couple of in-depth brain storming session to the final QC process before uploading our titles on our website we dedicate around 350 working hours. The titles are selected based on their current market cap and the foreseen CAGR and growth.
The 5 steps process:
Step 1: Secondary Research:
Secondary Research or Desk Research is as the name suggests is a research process wherein, we collect data through the readily available information. In this process we use various paid and unpaid databases which our team has access to and gather data through the same. This includes examining of listed companies’ annual reports, Journals, SEC filling etc. Apart from this our team has access to various associations across the globe across different industries. Lastly, we have exchange relationships with various university as well as individual libraries.
Step 2: Primary Research
When we talk about primary research, it is a type of study in which the researchers collect relevant data samples directly, rather than relying on previously collected data. This type of research is focused on gaining content specific facts that can be sued to solve specific problems. Since the collected data is fresh and first hand therefore it makes the study more accurate and genuine.
We at SNS Insider have divided Primary Research into 2 parts.
Part 1 wherein we interview the KOLs of major players as well as the upcoming ones across various geographic regions. This allows us to have their view over the market scenario and acts as an important tool to come closer to the accurate market numbers. As many as 45 paid and unpaid primary interviews are taken from both the demand and supply side of the industry to make sure we land at an accurate judgement and analysis of the market.
This step involves the triangulation of data wherein our team analyses the interview transcripts, online survey responses and observation of on filed participants. The below mentioned chart should give a better understanding of the part 1 of the primary interview.
Part 2: In this part of primary research the data collected via secondary research and the part 1 of the primary research is validated with the interviews from individual consultants and subject matter experts.
Consultants are those set of people who have at least 12 years of experience and expertise within the industry whereas Subject Matter Experts are those with at least 15 years of experience behind their back within the same space. The data with the help of two main processes i.e., FGDs (Focused Group Discussions) and IDs (Individual Discussions). This gives us a 3rd party nonbiased primary view of the market scenario making it a more dependable one while collation of the data pointers.
Step 3: Data Bank Validation
Once all the information is collected via primary and secondary sources, we run that information for data validation. At our intelligence centre our research heads track a lot of information related to the market which includes the quarterly reports, the daily stock prices, and other relevant information. Our data bank server gets updated every fortnight and that is how the information which we collected using our primary and secondary information is revalidated in real time.
Step 4: QA/QC Process
After all the data collection and validation our team does a final level of quality check and quality assurance to get rid of any unwanted or undesired mistakes. This might include but not limited to getting rid of the any typos, duplication of numbers or missing of any important information. The people involved in this process include technical content writers, research heads and graphics people. Once this process is completed the title gets uploader on our platform for our clients to read it.
Step 5: Final QC/QA Process:
This is the last process and comes when the client has ordered the study. In this process a final QA/QC is done before the study is emailed to the client. Since we believe in giving our clients a good experience of our research studies, therefore, to make sure that we do not lack at our end in any way humanly possible we do a final round of quality check and then dispatch the study to the client.
Key Segments:
By Type
Web Application Security
Mobile Application Security
By Deployment Mode
Cloud
On-Premises
By Component
Solutions
Security Testing Tools
Static Application Security Testing (SAST)
Dynamic Application Security Testing (DAST)
Interactive Application Security Testing (IAST)
Runtime Application Self-Protection
Container Security
API Security
Others
Services
Professional Services
Managed Services
By Organization Size
Large Enterprises
SMEs
By Vertical
Banking, Financial Services, & Insurance (BFSI)
Government And Public Sector
Healthcare
Telecommunications
Retail And E-Commerce
IT & ITES
Education
Others
Request for Segment Customization as per your Business Requirement: Segment Customization Request
REGIONAL COVERAGE:
North America
US
Canada
Mexico
Europe
Eastern Europe
Poland
Romania
Hungary
Turkey
Rest of Eastern Europe
Western Europe
Germany
France
UK
Italy
Spain
Netherlands
Switzerland
Austria
Rest of Western Europe
Asia Pacific
China
India
Japan
South Korea
Vietnam
Singapore
Australia
Rest of Asia Pacific
Middle East & Africa
Middle East
UAE
Egypt
Saudi Arabia
Qatar
Rest of the Middle East
Africa
Nigeria
South Africa
Rest of Africa
Latin America
Brazil
Argentina
Colombia
Rest of Latin America
Request for Country Level Research Report: Country Level Customization Request
Available Customization
With the given market data, SNS Insider offers customization as per the company’s specific needs. The following customization options are available for the report:
Product Analysis
Criss-Cross segment analysis (e.g. Product X Application)
Product Matrix which gives a detailed comparison of product portfolio of each company
Geographic Analysis
Additional countries in any of the regions
Company Information
Detailed analysis and profiling of additional market players (Up to five)
The Open-Source Intelligence Market Size was valued at US$ 9.32 billion in 2023 & is expected to reach US$ 59.61 billion by 2032 & grow at a CAGR of 22.9 % over the forecast period of 2024-2032.
The Data Brokers Market Size was USD 257.2 Billion in 2023. It is expected to grow to USD 441.4 Billion by 2032 and grow at a CAGR of 7.4% by 2024-2032.
The Cloud TV Market was valued at USD 1.98 billion in 2023 and is expected to reach USD 12.24 Billion by 2032, growing at a CAGR of 22.44% from 2024-2032.
The 5G IoT Market Size was valued at USD 12.9 Billion in 2023 and is expected to reach USD 199.9 Billion by 2032 and grow at a CAGR of 35.6 % over the forecast period 2024-2032.
The Identity Governance and Administration Market was valued at USD 7.1 Billion in 2023 and will reach USD 23.4 Billion and CAGR of 14.24% by 2032.
The Industry 5.0 Market Size was estimated at USD 58.15 billion in 2023 and is expected to reach USD 673.18 billion by 2032, with a growing at CAGR of 15.63% during the forecast period of 2024-2032.
Hi! Click one of our member below to chat on Phone