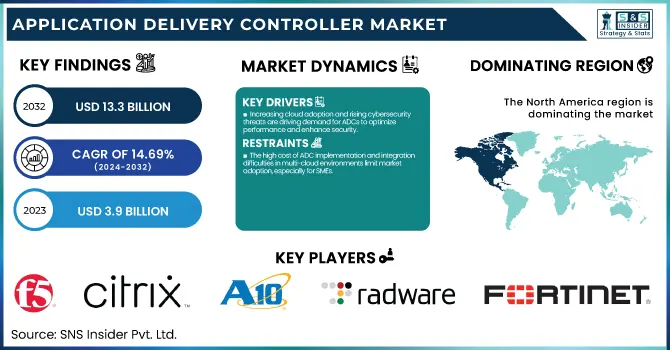
The Application Delivery Controller Market was valued at USD 3.9 Billion in 2023 and is expected to reach USD 13.3 Billion by 2032, growing at a CAGR of 14.69% from 2024-2032.
To Get more information on Application Delivery Controller Market - Request Free Sample Report
The adoption of Application Delivery Controllers (ADCs) is shifting toward cloud-based and virtual deployments, replacing traditional hardware solutions for better scalability and flexibility. The rising demand for cloud-native ADCs in hybrid and multi-cloud environments from 2020 to 2025 is driven by enterprises seeking cost-efficient and adaptive traffic management. AI and automation are playing a crucial role in optimizing ADC performance, enabling real-time traffic monitoring, anomaly detection, and intelligent load balancing for improved network efficiency. Additionally, the growing need for security and seamless application performance in high-traffic digital environments is accelerating the market expansion of ADC solutions, particularly in cybersecurity and load balancing applications.
Drivers:
Increasing cloud adoption and rising cybersecurity threats are driving demand for ADCs to optimize performance and enhance security.
The rising technology substantiates with growing cloud, mobile apps adoption, with digital transformation driving the Application Delivery Controllers market. ADCs help businesses optimize traffic management, deliver high-performance application experiences, and improve cyber threat defenses. With the increasing occurrence of DDoS attacks and web application vulnerabilities, the demand for ADC is expected to increase even further, due to the deployment of ADCs with security features built in. Apart from this, organizations are now using ADCs for load balancing, SSL offload, content caching, etc., to keep applications highly available & scalable. The ADC market is expected to record substantial growth as enterprises continue to expand their digital footprint through hybrid and multi-cloud phenomena.
Restraints:
The high cost of ADC implementation and integration difficulties in multi-cloud environments limit market adoption, especially for SMEs.
While ADCs provide benefits, the high deployment cost and complexity in integrating existing network infrastructure make them challenging for businesses. Conventional hardware-based ADCs have a high upfront investment cost that presents an obstacle for SMEs to adopt testing. Licenses are still required, such that even with ADC solutions that are purely software or cloud-native, in practice, there is a dependency on network professionals who know how to stitch together solutions. For example, organizations utilizing multi-cloud or hybrid environments may struggle to provide interoperability across platforms with ADCs deployment. Such hurdles in integration may cause the adoption rates to slow down, which would restrict the overall market growth to a larger extent, particularly for organizations with limited budget and little in-house tech skills.
Opportunities:
AI and automation in ADCs enable intelligent traffic management, self-healing networks, and real-time performance optimization.
As the technology of artificial intelligence and automation improves, we can expect ADCs to evolve into intelligent traffic management with capabilities like anomaly detection and real-time optimization. AI-based ADCs can dynamically steer traffic, identify congestion points before they happen, and avoid downtimes for application delivery. In addition, automation features are alleviating the amount of work hitting the IT teams by adopting self-healing networks and adaptive load balancing. Such innovations are becoming popular with enterprises seeking to improve application security, latency, and cloud workload performance. With the increasing demand for next-gen digital experiences, ADC providers have a lucrative opportunity to build smart, self-learning ADCs in the age of AI and automation.
Challenges:
Strict data protection laws and security risks create challenges in ADC deployment, requiring compliance-friendly and secure solutions.
As organizations increasingly turn to ADCs for securing the transfer of highly sensitive information, questions abound regarding compliance with the stringent data privacy regulations such as GDPR, CCPA and HIPAA. Having ADC deployments comply with various regulation frameworks, especially if enterprises operate across the geographic regions, becomes a very tedious and resource-consuming process. Moreover, since ADCs handle application traffic and protection, they become a cybercriminal's favourite target to exploit. Vendors must provide very strong encryption, handling of data, compliance, etc. in their ADC solutions to gain customer trust. The problem is finding a way to deliver scale you can trust without increasing operational costs so astronomically that you cannot continue to afford to provide service.
By Deployment
In 2023, hardware-based ADCs segment dominated the market and accounted for a significant revenue share. Compared with software-based ADCs, hardware-based ADCs are explicitly designed for performance. These devices incorporate specialized hardware components like Application-Specific Integrated Circuits to facilitate data processing and traffic maximization. This allows for rapid processing of packets in this specialized architecture, which means less latency and higher throughput. Therefore, hardware-based ADCs are ideal for organizations with high traffic loads, and for mission-critical applications that need guaranteed performance.
The virtual ADCs are expected to register the fastest CAGR during the forecast period. Cloud environments are being adopted at great speed, this has led to rapid adoption of Virtual Application Delivery Controllers by commercial organizations. Virtual ADCs are designed to work as part of cloud-based architectures and are instantly deployable to the cloud whenever and wherever needed without the limitations of physical hardware. With this functionality, businesses have the flexibility to dynamically scale their application delivery resources in line with variable workloads, so optimal performance can be guaranteed, automatically when needed.
By Enterprise Size
In 2023, the large enterprises segment dominated the market and accounted for a significant revenue share. Large enterprises typically have complexity in their IT landscape, spread across on-premises, cloud, and hybrid architectures. Management These trends lead to unprecedented complexity in application delivery, traffic management, and security, and require next-generation solutions that are infrastructure agnostic. ADCs are built to operate in these complex environments, providing a single point of control for application traffic, as well as transparency across platforms.
The SME segment is expected to register the fastest CAGR during the forecast period. With small and medium enterprises looking to increase operational efficiency and customer engagement, more and more are starting to undertake their digital transformation projects. Part of this transition often requires moving to cloud services, which can help make resources and applications accessible to SMEs more flexibly and cost-effectively. During this transformation, ADCs play a crucial role by providing reliable access to applications while streamlining performance between all points of your platform.
By End-Use
In 2023, BFSI segment dominated the market and accounted for significant revenue share. As the BFSI sector grows, the transaction volumes that financial institutions have to manage are also increasing. The increased activity results in the need for scalable solutions that are instantiated based on demand. This is where the ADC comes in, giving you the ability to adjust scale resources up or down on-demand.
The retail segment is expected to register the fastest CAGR during the forecast period. E-commerce has boomed, revolutionizing the retail market, and greatly increasing the volume of sales and customer interactions online. In response to this increasing need for faster and a more accessible shopping experience, retailers are now focusing on digital mediums to create their presence.
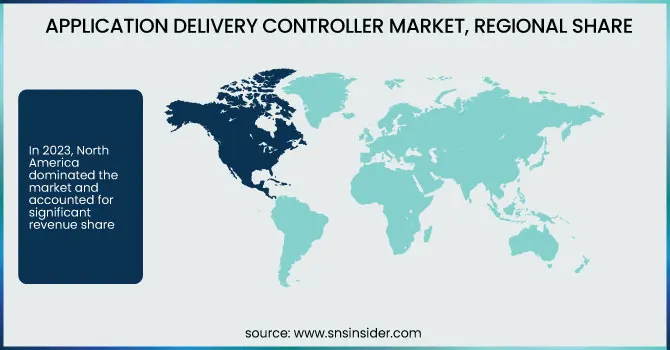
In 2023, North America dominated the market and accounted for significant revenue share. Cloud adoption and digital transformation are thus at the forefront of North American enterprises, specifically in the U.S. and Canada. With more and more businesses moving to a hybrid and multi-cloud setup, the demand for Application Delivery Controllers has drastically increased. ADC plays a critical role in the seamless application delivery, scalability, and securing of these infrastructures across the data center. ADCs are extremely important in cloud environments since they are responsible for controlling the optimal performance of cloud-based applications, perform load balancing of traffic, and help in reducing latency.
Asia Pacific is expected to register the fastest CAGR during the period. As small and medium enterprises in the Asia sector quickly adopt the digital AWS and cloud innovations, growing these businesses digitally also means the need for scalable, cost-effective Application Delivery Controllers is on the rise.
Get Customized Report as per Your Business Requirement - Enquiry Now
The major key players along with their products are
F5, Inc. – BIG-IP ADC
Citrix Systems, Inc. – Citrix ADC
A10 Networks, Inc. – Thunder ADC
Radware Ltd. – Alteon ADC
Barracuda Networks, Inc. – Barracuda Load Balancer ADC
Fortinet, Inc. – FortiADC
Array Networks, Inc. – APV Series ADC
Kemp Technologies (Progress) – LoadMaster ADC
Broadcom Inc. – Brocade Virtual Traffic Manager
NGINX (F5 Networks) – NGINX Plus ADC
AWS (Amazon Web Services) – AWS Elastic Load Balancer
Microsoft Corporation – Azure Application Gateway
Cloudflare, Inc. – Cloudflare Load Balancer
Google Cloud – Google Cloud Load Balancing
Imperva, Inc. – Imperva Incapsula ADC
In August 2023, Array Networks, Inc., a U.S.-based developer of application delivery controllers, partnered with Luna Technologies to introduce APV application delivery controller solutions targeting corporations, banks, and government organizations in Malawi.
In October 2023, Progress Software Corporation, a U.S.-based software company, launched LoadMaster 360, a unified cloud-centric application delivery platform designed to enhance performance, reliability, and security across diverse infrastructures.
|
Report Attributes |
Details |
|
Market Size in 2023 |
USD 3.9 Billion |
|
Market Size by 2032 |
USD 13.3 Billion |
|
CAGR |
CAGR of 14.69% From 2024 to 2032 |
|
Base Year |
2023 |
|
Forecast Period |
2024-2032 |
|
Historical Data |
2020-2022 |
|
Report Scope & Coverage |
Market Size, Segments Analysis, Competitive Landscape, Regional Analysis, DROC & SWOT Analysis, Forecast Outlook |
|
Key Segments |
• By Deployment (Hardware based ADCs, Virtual ADCs) |
|
Regional Analysis/Coverage |
North America (US, Canada, Mexico), Europe (Eastern Europe [Poland, Romania, Hungary, Turkey, Rest of Eastern Europe] Western Europe] Germany, France, UK, Italy, Spain, Netherlands, Switzerland, Austria, Rest of Western Europe]), Asia Pacific (China, India, Japan, South Korea, Vietnam, Singapore, Australia, Rest of Asia Pacific), Middle East & Africa (Middle East [UAE, Egypt, Saudi Arabia, Qatar, Rest of Middle East], Africa [Nigeria, South Africa, Rest of Africa], Latin America (Brazil, Argentina, Colombia, Rest of Latin America) |
|
Company Profiles |
F5, Inc., Citrix Systems, Inc., A10 Networks, Inc., Radware Ltd., Barracuda Networks, Inc., Fortinet, Inc., Array Networks, Inc., Kemp Technologies (Progress), Broadcom Inc., NGINX (F5 Networks), AWS (Amazon Web Services), Microsoft Corporation, Cloudflare, Inc., Google Cloud, Imperva, Inc. |
Ans - The Application Delivery Controller Market was valued at USD 3.9 Billion in 2023 and is expected to reach USD 13.3 Billion by 2032
Ans- The CAGR of the Application Delivery Controller Market during the forecast period is 14.69% from 2024-2032.
Ans- Asia-Pacific is expected to register the fastest CAGR during the forecast period.
Ans- Increasing cloud adoption and rising cybersecurity threats are driving demand for ADCs to optimize performance and enhance security.
Ans- Strict data protection laws and security risks create challenges in ADC deployment, requiring compliance-friendly and secure solutions.
Table of Content
1. Introduction
1.1 Market Definition
1.2 Scope (Inclusion and Exclusions)
1.3 Research Assumptions
2. Executive Summary
2.1 Market Overview
2.2 Regional Synopsis
2.3 Competitive Summary
3. Research Methodology
3.1 Top-Down Approach
3.2 Bottom-up Approach
3.3. Data Validation
3.4 Primary Interviews
4. Market Dynamics Impact Analysis
4.1 Market Driving Factors Analysis
4.1.1 Drivers
4.1.2 Restraints
4.1.3 Opportunities
4.1.4 Challenges
4.2 PESTLE Analysis
4.3 Porter’s Five Forces Model
5. Statistical Insights and Trends Reporting
5.1 Adoption Rates of Application Delivery Controllers, by Deployment Type
5.2 Growth in Cloud-Native ADC Deployments in Hybrid and Multi-Cloud Environments (2020-2025)
5.3 Impact of AI and Automation on ADC Performance Optimization
5.4 Market Growth of ADC Solutions in Security and Load Balancing Applications
6. Competitive Landscape
6.1 List of Major Companies, By Region
6.2 Market Share Analysis, By Region
6.3 Product Benchmarking
6.3.1 Product specifications and features
6.3.2 Pricing
6.4 Strategic Initiatives
6.4.1 Marketing and promotional activities
6.4.2 Distribution and supply chain strategies
6.4.3 Expansion plans and new product launches
6.4.4 Strategic partnerships and collaborations
6.5 Technological Advancements
6.6 Market Positioning and Branding
7. Application Delivery Controller Market Segmentation, By Deployment
7.1 Chapter Overview
7.2 Hardware based ADCs
7.2.1 Hardware based ADCs Market Trends Analysis (2020-2032)
7.2.2 Hardware based ADCs Market Size Estimates and Forecasts to 2032 (USD Billion)
7.3 Virtual ADCs
7.3.1 Virtual ADCs Market Trends Analysis (2020-2032)
7.3.2 Virtual ADCs Market Size Estimates and Forecasts to 2032 (USD Billion)
8. Application Delivery Controller Market Segmentation, by Enterprise Size
8.1 Chapter Overview
8.2 Small & Medium Enterprise
8.2.1 Small & Medium Enterprise Market Trends Analysis (2020-2032)
8.2.2 Small & Medium Enterprise Market Size Estimates and Forecasts to 2032 (USD Billion)
8.3 Large Enterprise
8.3.1 Large Enterprise Market Trends Analysis (2020-2032)
8.3.2 Large Enterprise Market Size Estimates and Forecasts to 2032 (USD Billion)
9. Application Delivery Controller Market Segmentation, by End-Use
9.1 Chapter Overview
9.2 IT & Telecom
9.2.1 IT & Telecom Market Trends Analysis (2020-2032)
9.2.2 IT & Telecom Market Size Estimates and Forecasts to 2032 (USD Billion)
9.3 BFSI
9.3.1 BFSI Market Trends Analysis (2020-2032)
9.3.2 BFSI Market Size Estimates and Forecasts to 2032 (USD Billion)
9.4 Government
9.4.1Government Market Trends Analysis (2020-2032)
9.4.2Government Market Size Estimates and Forecasts to 2032 (USD Billion)
9.5 Healthcare
9.5.1Healthcare Market Trends Analysis (2020-2032)
9.5.2Healthcare Market Size Estimates and Forecasts to 2032 (USD Billion)
9.6 Retail
9.6.1Retail Market Trends Analysis (2020-2032)
9.6.2Retail Market Size Estimates and Forecasts to 2032 (USD Billion)
9.7 Others
9.7.1Others Market Trends Analysis (2020-2032)
9.4.2Others Market Size Estimates and Forecasts to 2032 (USD Billion)
10. Regional Analysis
10.1 Chapter Overview
10.2 North America
10.2.1 Trends Analysis
10.2.2 North America Application Delivery Controller Market Estimates and Forecasts, by Country (2020-2032) (USD Billion)
10.2.3 North America Application Delivery Controller Market Estimates and Forecasts, By Deployment (2020-2032) (USD Billion)
10.2.4 North America Application Delivery Controller Market Estimates and Forecasts, by Enterprise Size (2020-2032) (USD Billion)
10.2.5 North America Application Delivery Controller Market Estimates and Forecasts, by Service (2020-2032) (USD Billion)
10.2.6 USA
10.2.6.1 USA Application Delivery Controller Market Estimates and Forecasts, By Deployment (2020-2032) (USD Billion)
10.2.6.2 USA Application Delivery Controller Market Estimates and Forecasts, by Enterprise Size (2020-2032) (USD Billion)
10.2.6.3 USA Application Delivery Controller Market Estimates and Forecasts, by End-Use (2020-2032) (USD Billion)
10.2.7 Canada
10.2.7.1 Canada Application Delivery Controller Market Estimates and Forecasts, By Deployment (2020-2032) (USD Billion)
10.2.7.2 Canada Application Delivery Controller Market Estimates and Forecasts, by Enterprise Size (2020-2032) (USD Billion)
10.2.7.3 Canada Application Delivery Controller Market Estimates and Forecasts, by End-Use (2020-2032) (USD Billion)
10.2.8 Mexico
10.2.8.1 Mexico Application Delivery Controller Market Estimates and Forecasts, By Deployment (2020-2032) (USD Billion)
10.2.8.2 Mexico Application Delivery Controller Market Estimates and Forecasts, by Enterprise Size (2020-2032) (USD Billion)
10.2.8.3 Mexico Application Delivery Controller Market Estimates and Forecasts, by End-Use (2020-2032) (USD Billion)
10.3 Europe
10.3.1 Eastern Europe
10.3.1.1 Trends Analysis
10.3.1.2 Eastern Europe Application Delivery Controller Market Estimates and Forecasts, by Country (2020-2032) (USD Billion)
10.3.1.3 Eastern Europe Application Delivery Controller Market Estimates and Forecasts, By Deployment (2020-2032) (USD Billion)
10.3.1.4 Eastern Europe Application Delivery Controller Market Estimates and Forecasts, by Enterprise Size (2020-2032) (USD Billion)
10.3.1.5 Eastern Europe Application Delivery Controller Market Estimates and Forecasts, by End-Use (2020-2032) (USD Billion)
10.3.1.6 Poland
10.3.1.6.1 Poland Application Delivery Controller Market Estimates and Forecasts, By Deployment (2020-2032) (USD Billion)
10.3.1.6.2 Poland Application Delivery Controller Market Estimates and Forecasts, by Enterprise Size (2020-2032) (USD Billion)
10.3.1.6.3 Poland Application Delivery Controller Market Estimates and Forecasts, by End-Use (2020-2032) (USD Billion)
10.3.1.7 Romania
10.3.1.7.1 Romania Application Delivery Controller Market Estimates and Forecasts, By Deployment (2020-2032) (USD Billion)
10.3.1.7.2 Romania Application Delivery Controller Market Estimates and Forecasts, by Enterprise Size (2020-2032) (USD Billion)
10.3.1.7.3 Romania Application Delivery Controller Market Estimates and Forecasts, by End-Use (2020-2032) (USD Billion)
10.3.1.8 Hungary
10.3.1.8.1 Hungary Application Delivery Controller Market Estimates and Forecasts, By Deployment (2020-2032) (USD Billion)
10.3.1.8.2 Hungary Application Delivery Controller Market Estimates and Forecasts, by Enterprise Size (2020-2032) (USD Billion)
10.3.1.8.3 Hungary Application Delivery Controller Market Estimates and Forecasts, by End-Use (2020-2032) (USD Billion)
10.3.1.9 Turkey
10.3.1.9.1 Turkey Application Delivery Controller Market Estimates and Forecasts, By Deployment (2020-2032) (USD Billion)
10.3.1.9.2 Turkey Application Delivery Controller Market Estimates and Forecasts, by Enterprise Size (2020-2032) (USD Billion)
10.3.1.9.3 Turkey Application Delivery Controller Market Estimates and Forecasts, by End-Use (2020-2032) (USD Billion)
10.3.1.10 Rest of Eastern Europe
10.3.1.10.1 Rest of Eastern Europe Application Delivery Controller Market Estimates and Forecasts, By Deployment (2020-2032) (USD Billion)
10.3.1.10.2 Rest of Eastern Europe Application Delivery Controller Market Estimates and Forecasts, by Enterprise Size (2020-2032) (USD Billion)
10.3.1.10.3 Rest of Eastern Europe Application Delivery Controller Market Estimates and Forecasts, by End-Use (2020-2032) (USD Billion)
10.3.2 Western Europe
10.3.2.1 Trends Analysis
10.3.2.2 Western Europe Application Delivery Controller Market Estimates and Forecasts, by Country (2020-2032) (USD Billion)
10.3.2.3 Western Europe Application Delivery Controller Market Estimates and Forecasts, By Deployment (2020-2032) (USD Billion)
10.3.2.4 Western Europe Application Delivery Controller Market Estimates and Forecasts, by Enterprise Size (2020-2032) (USD Billion)
10.3.2.5 Western Europe Application Delivery Controller Market Estimates and Forecasts, by End-Use (2020-2032) (USD Billion)
10.3.2.6 Germany
10.3.2.6.1 Germany Application Delivery Controller Market Estimates and Forecasts, By Deployment (2020-2032) (USD Billion)
10.3.2.6.2 Germany Application Delivery Controller Market Estimates and Forecasts, by Enterprise Size (2020-2032) (USD Billion)
10.3.2.6.3 Germany Application Delivery Controller Market Estimates and Forecasts, by End-Use (2020-2032) (USD Billion)
10.3.2.7 France
10.3.2.7.1 France Application Delivery Controller Market Estimates and Forecasts, By Deployment (2020-2032) (USD Billion)
10.3.2.7.2 France Application Delivery Controller Market Estimates and Forecasts, by Enterprise Size (2020-2032) (USD Billion)
10.3.2.7.3 France Application Delivery Controller Market Estimates and Forecasts, by End-Use (2020-2032) (USD Billion)
10.3.2.8 UK
10.3.2.8.1 UK Application Delivery Controller Market Estimates and Forecasts, By Deployment (2020-2032) (USD Billion)
10.3.2.8.2 UK Application Delivery Controller Market Estimates and Forecasts, by Enterprise Size (2020-2032) (USD Billion)
10.3.2.8.3 UK Application Delivery Controller Market Estimates and Forecasts, by End-Use (2020-2032) (USD Billion)
10.3.2.9 Italy
10.3.2.9.1 Italy Application Delivery Controller Market Estimates and Forecasts, By Deployment (2020-2032) (USD Billion)
10.3.2.9.2 Italy Application Delivery Controller Market Estimates and Forecasts, by Enterprise Size (2020-2032) (USD Billion)
10.3.2.9.3 Italy Application Delivery Controller Market Estimates and Forecasts, by End-Use (2020-2032) (USD Billion)
10.3.2.10 Spain
10.3.2.10.1 Spain Application Delivery Controller Market Estimates and Forecasts, By Deployment (2020-2032) (USD Billion)
10.3.2.10.2 Spain Application Delivery Controller Market Estimates and Forecasts, by Enterprise Size (2020-2032) (USD Billion)
10.3.2.10.3 Spain Application Delivery Controller Market Estimates and Forecasts, by End-Use (2020-2032) (USD Billion)
10.3.2.11 Netherlands
10.3.2.11.1 Netherlands Application Delivery Controller Market Estimates and Forecasts, By Deployment (2020-2032) (USD Billion)
10.3.2.11.2 Netherlands Application Delivery Controller Market Estimates and Forecasts, by Enterprise Size (2020-2032) (USD Billion)
10.3.2.11.3 Netherlands Application Delivery Controller Market Estimates and Forecasts, by End-Use (2020-2032) (USD Billion)
10.3.2.12 Switzerland
10.3.2.12.1 Switzerland Application Delivery Controller Market Estimates and Forecasts, By Deployment (2020-2032) (USD Billion)
10.3.2.12.2 Switzerland Application Delivery Controller Market Estimates and Forecasts, by Enterprise Size (2020-2032) (USD Billion)
10.3.2.12.3 Switzerland Application Delivery Controller Market Estimates and Forecasts, by End-Use (2020-2032) (USD Billion)
10.3.2.13 Austria
10.3.2.13.1 Austria Application Delivery Controller Market Estimates and Forecasts, By Deployment (2020-2032) (USD Billion)
10.3.2.13.2 Austria Application Delivery Controller Market Estimates and Forecasts, by Enterprise Size (2020-2032) (USD Billion)
10.3.2.13.3 Austria Application Delivery Controller Market Estimates and Forecasts, by End-Use (2020-2032) (USD Billion)
10.3.2.14 Rest of Western Europe
10.3.2.14.1 Rest of Western Europe Application Delivery Controller Market Estimates and Forecasts, By Deployment (2020-2032) (USD Billion)
10.3.2.14.2 Rest of Western Europe Application Delivery Controller Market Estimates and Forecasts, by Enterprise Size (2020-2032) (USD Billion)
10.3.2.14.3 Rest of Western Europe Application Delivery Controller Market Estimates and Forecasts, by End-Use (2020-2032) (USD Billion)
10.4 Asia Pacific
10.4.1 Trends Analysis
10.4.2 Asia Pacific Application Delivery Controller Market Estimates and Forecasts, by Country (2020-2032) (USD Billion)
10.4.3 Asia Pacific Application Delivery Controller Market Estimates and Forecasts, By Deployment (2020-2032) (USD Billion)
10.4.4 Asia Pacific Application Delivery Controller Market Estimates and Forecasts, by Enterprise Size (2020-2032) (USD Billion)
10.4.5 Asia Pacific Application Delivery Controller Market Estimates and Forecasts, by End-Use (2020-2032) (USD Billion)
10.4.6 China
10.4.6.1 China Application Delivery Controller Market Estimates and Forecasts, By Deployment (2020-2032) (USD Billion)
10.4.6.2 China Application Delivery Controller Market Estimates and Forecasts, by Display (2020-2032) (USD Billion)
10.4.6.3 China Application Delivery Controller Market Estimates and Forecasts, by End-Use (2020-2032) (USD Billion)
10.4.7 India
10.4.7.1 India Application Delivery Controller Market Estimates and Forecasts, By Deployment (2020-2032) (USD Billion)
10.4.7.2 India Application Delivery Controller Market Estimates and Forecasts, by Enterprise Size (2020-2032) (USD Billion)
10.4.7.3 India Application Delivery Controller Market Estimates and Forecasts, by End-Use (2020-2032) (USD Billion)
10.4.8 Japan
10.4.8.1 Japan Application Delivery Controller Market Estimates and Forecasts, By Deployment (2020-2032) (USD Billion)
10.4.8.2 Japan Application Delivery Controller Market Estimates and Forecasts, by Enterprise Size (2020-2032) (USD Billion)
10.4.8.3 Japan Application Delivery Controller Market Estimates and Forecasts, by End-Use (2020-2032) (USD Billion)
10.4.9 South Korea
10.4.9.1 South Korea Application Delivery Controller Market Estimates and Forecasts, By Deployment (2020-2032) (USD Billion)
10.4.9.2 South Korea Application Delivery Controller Market Estimates and Forecasts, by Enterprise Size (2020-2032) (USD Billion)
10.4.9.3 South Korea Application Delivery Controller Market Estimates and Forecasts, by End-Use (2020-2032) (USD Billion)
10.4.10 Vietnam
10.4.10.1 Vietnam Application Delivery Controller Market Estimates and Forecasts, By Deployment (2020-2032) (USD Billion)
10.4.10.2 Vietnam Application Delivery Controller Market Estimates and Forecasts, by Enterprise Size (2020-2032) (USD Billion)
10.4.10.3 Vietnam Application Delivery Controller Market Estimates and Forecasts, by End-Use (2020-2032) (USD Billion)
10.4.11 Singapore
10.4.11.1 Singapore Application Delivery Controller Market Estimates and Forecasts, By Deployment (2020-2032) (USD Billion)
10.4.11.2 Singapore Application Delivery Controller Market Estimates and Forecasts, by Enterprise Size (2020-2032) (USD Billion)
10.4.11.3 Singapore Application Delivery Controller Market Estimates and Forecasts, by End-Use (2020-2032) (USD Billion)
10.4.12 Australia
10.4.12.1 Australia Application Delivery Controller Market Estimates and Forecasts, By Deployment (2020-2032) (USD Billion)
10.4.12.2 Australia Application Delivery Controller Market Estimates and Forecasts, by Enterprise Size (2020-2032) (USD Billion)
10.4.12.3 Australia Application Delivery Controller Market Estimates and Forecasts, by End-Use (2020-2032) (USD Billion)
10.4.13 Rest of Asia Pacific
10.4.13.1 Rest of Asia Pacific Application Delivery Controller Market Estimates and Forecasts, By Deployment (2020-2032) (USD Billion)
10.4.13.2 Rest of Asia Pacific Application Delivery Controller Market Estimates and Forecasts, by Enterprise Size (2020-2032) (USD Billion)
10.4.13.3 Rest of Asia Pacific Application Delivery Controller Market Estimates and Forecasts, by End-Use (2020-2032) (USD Billion)
10.5 Middle East and Africa
10.5.1 Middle East
10.5.1.1 Trends Analysis
10.5.1.2 Middle East Application Delivery Controller Market Estimates and Forecasts, by Country (2020-2032) (USD Billion)
10.5.1.3 Middle East Application Delivery Controller Market Estimates and Forecasts, By Deployment (2020-2032) (USD Billion)
10.5.1.4 Middle East Application Delivery Controller Market Estimates and Forecasts, by Enterprise Size (2020-2032) (USD Billion)
10.5.1.5 Middle East Application Delivery Controller Market Estimates and Forecasts, by End-Use (2020-2032) (USD Billion)
10.5.1.6 UAE
10.5.1.6.1 UAE Application Delivery Controller Market Estimates and Forecasts, By Deployment (2020-2032) (USD Billion)
10.5.1.6.2 UAE Application Delivery Controller Market Estimates and Forecasts, by Enterprise Size (2020-2032) (USD Billion)
10.5.1.6.3 UAE Application Delivery Controller Market Estimates and Forecasts, by End-Use (2020-2032) (USD Billion)
10.5.1.7 Egypt
10.5.1.7.1 Egypt Application Delivery Controller Market Estimates and Forecasts, By Deployment (2020-2032) (USD Billion)
10.5.1.7.2 Egypt Application Delivery Controller Market Estimates and Forecasts, by Enterprise Size (2020-2032) (USD Billion)
10.5.1.7.3 Egypt Application Delivery Controller Market Estimates and Forecasts, by End-Use (2020-2032) (USD Billion)
10.5.1.8 Saudi Arabia
10.5.1.8.1 Saudi Arabia Application Delivery Controller Market Estimates and Forecasts, By Deployment (2020-2032) (USD Billion)
10.5.1.8.2 Saudi Arabia Application Delivery Controller Market Estimates and Forecasts, by Enterprise Size (2020-2032) (USD Billion)
10.5.1.8.3 Saudi Arabia Application Delivery Controller Market Estimates and Forecasts, by End-Use (2020-2032) (USD Billion)
10.5.1.9 Qatar
10.5.1.9.1 Qatar Application Delivery Controller Market Estimates and Forecasts, By Deployment (2020-2032) (USD Billion)
10.5.1.9.2 Qatar Application Delivery Controller Market Estimates and Forecasts, by Enterprise Size (2020-2032) (USD Billion)
10.5.1.9.3 Qatar Application Delivery Controller Market Estimates and Forecasts, by End-Use (2020-2032) (USD Billion)
10.5.1.10 Rest of Middle East
10.5.1.10.1 Rest of Middle East Application Delivery Controller Market Estimates and Forecasts, By Deployment (2020-2032) (USD Billion)
10.5.1.10.2 Rest of Middle East Application Delivery Controller Market Estimates and Forecasts, by Enterprise Size (2020-2032) (USD Billion)
10.5.1.10.3 Rest of Middle East Application Delivery Controller Market Estimates and Forecasts, by End-Use (2020-2032) (USD Billion)
10.5.2 Africa
10.5.2.1 Trends Analysis
10.5.2.2 Africa Application Delivery Controller Market Estimates and Forecasts, by Country (2020-2032) (USD Billion)
10.5.2.3 Africa Application Delivery Controller Market Estimates and Forecasts, By Deployment (2020-2032) (USD Billion)
10.5.2.4 Africa Application Delivery Controller Market Estimates and Forecasts, by Enterprise Size (2020-2032) (USD Billion)
10.5.2.5 Africa Application Delivery Controller Market Estimates and Forecasts, by End-Use (2020-2032) (USD Billion)
10.5.2.6 South Africa
10.5.2.6.1 South Africa Application Delivery Controller Market Estimates and Forecasts, By Deployment (2020-2032) (USD Billion)
10.5.2.6.2 South Africa Application Delivery Controller Market Estimates and Forecasts, by Enterprise Size (2020-2032) (USD Billion)
10.5.2.6.3 South Africa Application Delivery Controller Market Estimates and Forecasts, by End-Use (2020-2032) (USD Billion)
10.5.2.7 Nigeria
10.5.2.7.1 Nigeria Application Delivery Controller Market Estimates and Forecasts, By Deployment (2020-2032) (USD Billion)
10.5.2.7.2 Nigeria Application Delivery Controller Market Estimates and Forecasts, by Enterprise Size (2020-2032) (USD Billion)
10.5.2.7.3 Nigeria Application Delivery Controller Market Estimates and Forecasts, by End-Use (2020-2032) (USD Billion)
10.5.2.8 Rest of Africa
10.5.2.8.1 Rest of Africa Application Delivery Controller Market Estimates and Forecasts, By Deployment (2020-2032) (USD Billion)
10.5.2.8.2 Rest of Africa Application Delivery Controller Market Estimates and Forecasts, by Enterprise Size (2020-2032) (USD Billion)
10.5.2.8.3 Rest of Africa Application Delivery Controller Market Estimates and Forecasts, by End-Use (2020-2032) (USD Billion)
10.6 Latin America
10.6.1 Trends Analysis
10.6.2 Latin America Application Delivery Controller Market Estimates and Forecasts, by Country (2020-2032) (USD Billion)
10.6.3 Latin America Application Delivery Controller Market Estimates and Forecasts, By Deployment (2020-2032) (USD Billion)
10.6.4 Latin America Application Delivery Controller Market Estimates and Forecasts, by Enterprise Size (2020-2032) (USD Billion)
10.6.5 Latin America Application Delivery Controller Market Estimates and Forecasts, by End-Use (2020-2032) (USD Billion)
10.6.6 Brazil
10.6.6.1 Brazil Application Delivery Controller Market Estimates and Forecasts, By Deployment (2020-2032) (USD Billion)
10.6.6.2 Brazil Application Delivery Controller Market Estimates and Forecasts, by Enterprise Size (2020-2032) (USD Billion)
10.6.6.3 Brazil Application Delivery Controller Market Estimates and Forecasts, by End-Use (2020-2032) (USD Billion)
10.6.7 Argentina
10.6.7.1 Argentina Application Delivery Controller Market Estimates and Forecasts, By Deployment (2020-2032) (USD Billion)
10.6.7.2 Argentina Application Delivery Controller Market Estimates and Forecasts, by Enterprise Size (2020-2032) (USD Billion)
10.6.7.3 Argentina Application Delivery Controller Market Estimates and Forecasts, by End-Use (2020-2032) (USD Billion)
10.6.8 Colombia
10.6.8.1 Colombia Application Delivery Controller Market Estimates and Forecasts, By Deployment (2020-2032) (USD Billion)
10.6.8.2 Colombia Application Delivery Controller Market Estimates and Forecasts, by Enterprise Size (2020-2032) (USD Billion)
10.6.8.3 Colombia Application Delivery Controller Market Estimates and Forecasts, by End-Use (2020-2032) (USD Billion)
10.6.9 Rest of Latin America
10.6.9.1 Rest of Latin America Application Delivery Controller Market Estimates and Forecasts, By Deployment (2020-2032) (USD Billion)
10.6.9.2 Rest of Latin America Application Delivery Controller Market Estimates and Forecasts, by Enterprise Size (2020-2032) (USD Billion)
10.6.9.3 Rest of Latin America Application Delivery Controller Market Estimates and Forecasts, by End-Use (2020-2032) (USD Billion)
11. Company Profiles
11.1 F5, Inc.
11.1.1 Company Overview
11.1.2 Financial
11.1.3 Products/ Services Offered
11.1.4 SWOT Analysis
11.2 Citrix Systems, Inc.
11.2.1 Company Overview
11.2.2 Financial
11.2.3 Products/ Services Offered
11.2.4 SWOT Analysis
11.3 A10 Networks, Inc.
11.3.1 Company Overview
11.3.2 Financial
11.3.3 Products/ Services Offered
11.3.4 SWOT Analysis
11.4 Radware Ltd.
11.4.1 Company Overview
11.4.2 Financial
11.4.3 Products/ Services Offered
11.4.4 SWOT Analysis
11.5 Barracuda Networks, Inc.
11.5.1 Company Overview
11.5.2 Financial
11.5.3 Products/ Services Offered
11.5.4 SWOT Analysis
11.6 Fortinet, Inc.
11.6.1 Company Overview
11.6.2 Financial
11.6.3 Products/ Services Offered
11.6.4 SWOT Analysis
11.7 Array Networks, Inc.
11.7.1 Company Overview
11.7.2 Financial
11.7.3 Products/ Services Offered
11.7.4 SWOT Analysis
11.8 Kemp Technologies (Progress)
11.8.1 Company Overview
11.8.2 Financial
11.8.3 Products/ Services Offered
11.8.4 SWOT Analysis
11.9 Broadcom Inc
11.9.1 Company Overview
11.9.2 Financial
11.9.3 Products/ Services Offered
11.9.4 SWOT Analysis
11.10 NGINX (F5 Networks)
11.10.1 Company Overview
11.10.2 Financial
11.10.3 Products/ Services Offered
11.10.4 SWOT Analysis
12. Use Cases and Best Practices
13. Conclusion
An accurate research report requires proper strategizing as well as implementation. There are multiple factors involved in the completion of good and accurate research report and selecting the best methodology to compete the research is the toughest part. Since the research reports we provide play a crucial role in any company’s decision-making process, therefore we at SNS Insider always believe that we should choose the best method which gives us results closer to reality. This allows us to reach at a stage wherein we can provide our clients best and accurate investment to output ratio.
Each report that we prepare takes a timeframe of 350-400 business hours for production. Starting from the selection of titles through a couple of in-depth brain storming session to the final QC process before uploading our titles on our website we dedicate around 350 working hours. The titles are selected based on their current market cap and the foreseen CAGR and growth.
The 5 steps process:
Step 1: Secondary Research:
Secondary Research or Desk Research is as the name suggests is a research process wherein, we collect data through the readily available information. In this process we use various paid and unpaid databases which our team has access to and gather data through the same. This includes examining of listed companies’ annual reports, Journals, SEC filling etc. Apart from this our team has access to various associations across the globe across different industries. Lastly, we have exchange relationships with various university as well as individual libraries.

Step 2: Primary Research
When we talk about primary research, it is a type of study in which the researchers collect relevant data samples directly, rather than relying on previously collected data. This type of research is focused on gaining content specific facts that can be sued to solve specific problems. Since the collected data is fresh and first hand therefore it makes the study more accurate and genuine.
We at SNS Insider have divided Primary Research into 2 parts.
Part 1 wherein we interview the KOLs of major players as well as the upcoming ones across various geographic regions. This allows us to have their view over the market scenario and acts as an important tool to come closer to the accurate market numbers. As many as 45 paid and unpaid primary interviews are taken from both the demand and supply side of the industry to make sure we land at an accurate judgement and analysis of the market.
This step involves the triangulation of data wherein our team analyses the interview transcripts, online survey responses and observation of on filed participants. The below mentioned chart should give a better understanding of the part 1 of the primary interview.

Part 2: In this part of primary research the data collected via secondary research and the part 1 of the primary research is validated with the interviews from individual consultants and subject matter experts.
Consultants are those set of people who have at least 12 years of experience and expertise within the industry whereas Subject Matter Experts are those with at least 15 years of experience behind their back within the same space. The data with the help of two main processes i.e., FGDs (Focused Group Discussions) and IDs (Individual Discussions). This gives us a 3rd party nonbiased primary view of the market scenario making it a more dependable one while collation of the data pointers.
Step 3: Data Bank Validation
Once all the information is collected via primary and secondary sources, we run that information for data validation. At our intelligence centre our research heads track a lot of information related to the market which includes the quarterly reports, the daily stock prices, and other relevant information. Our data bank server gets updated every fortnight and that is how the information which we collected using our primary and secondary information is revalidated in real time.

Step 4: QA/QC Process
After all the data collection and validation our team does a final level of quality check and quality assurance to get rid of any unwanted or undesired mistakes. This might include but not limited to getting rid of the any typos, duplication of numbers or missing of any important information. The people involved in this process include technical content writers, research heads and graphics people. Once this process is completed the title gets uploader on our platform for our clients to read it.
Step 5: Final QC/QA Process:
This is the last process and comes when the client has ordered the study. In this process a final QA/QC is done before the study is emailed to the client. Since we believe in giving our clients a good experience of our research studies, therefore, to make sure that we do not lack at our end in any way humanly possible we do a final round of quality check and then dispatch the study to the client.
Key Segmentation:
By Deployment
Hardware based ADCs
Virtual ADCs
By Enterprise Size
Small & Medium Enterprise
Large Enterprise
By End-Use
IT & Telecom
BFSI
Government
Healthcare
Retail
Others
Request for Segment Customization as per your Business Requirement: Segment Customization Request
Regional Coverage:
North America
US
Canada
Mexico
Europe
Eastern Europe
Poland
Romania
Hungary
Turkey
Rest of Eastern Europe
Western Europe
Germany
France
UK
Italy
Spain
Netherlands
Switzerland
Austria
Rest of Western Europe
Asia Pacific
China
India
Japan
South Korea
Vietnam
Singapore
Australia
Rest of Asia Pacific
Middle East & Africa
Middle East
UAE
Egypt
Saudi Arabia
Qatar
Rest of Middle East
Africa
Nigeria
South Africa
Rest of Africa
Latin America
Brazil
Argentina
Colombia
Rest of Latin America
Request for Country Level Research Report: Country Level Customization Request
Available Customization
With the given market data, SNS Insider offers customization as per the company’s specific needs. The following customization options are available for the report:
Detailed Volume Analysis
Criss-Cross segment analysis (e.g. Product X Application)
Competitive Product Benchmarking
Geographic Analysis
Additional countries in any of the regions
Customized Data Representation
Detailed analysis and profiling of additional market players
Language Translation Device Market was valued at USD 1.22 billion in 2023 and is expected to reach USD 3.46 billion by 2032, growing at a CAGR of 12.37% from 2024-2032.
The Mobile Edge Computing (MEC) Market size was valued at USD 462.05 mn in 2023 and will grow to USD 5947.77 mn by 2030 and grow at a CAGR of 32.83 % by 2032.
The Insurance Telematics Market, valued at USD 4.1 billion in 2023 is expected grow at a CAGR of 18.91% over 2024-2032, to reach USD 18.70 billion by 2032.
Loyalty Management Market was valued at USD 10.8 billion in 2023 and is expected to reach to USD 34.6 billion by 2032 and grow at a CAGR of 13.8% from 2024-2032.
Smart Shelves Market was valued at USD 3.3 billion in 2023 and is expected to reach USD 21.5 billion by 2032 and grow at a CAGR of 23.1% from 2024-2032.
The Digital Logistics Market was valued at USD 28.7 Billion in 2023 and will reach USD 128.1 Billion by 2032, growing at a CAGR of 18.13% by 2032.

Hi! Click one of our member below to chat on Phone
© 2025 All Rights Reserved by SNS Insider Pvt Ltd


