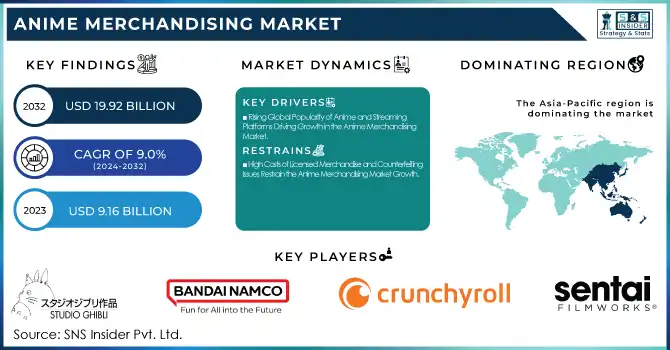
The Anime Merchandising Market Size was valued at USD 9.16 Billion in 2023 and is expected to reach USD 19.92 Billion by 2032 and grow at a CAGR of 9.0% over the forecast period 2024-2032. The Market is growing rapidly, driven by the global popularity of anime series, films, and games. Streaming platforms like Crunchyroll, Netflix, and Funimation have expanded anime’s reach, increasing demand for figurines, apparel, posters, and toys. E-commerce plays a key role, with companies like Good Smile Company, Bandai Namco, and Aniplex dominating the market. Japan, North America, and Europe lead in revenue, with rising interest in Latin America and Southeast Asia. Future trends include AR/VR-based collectibles, blockchain authentication, and AI-driven customization, ensuring continued market expansion through digital accessibility, nostalgia, and fan engagement.
To get more information on Anime Merchandising Market - Request Free Sample Report
Key Drivers:
Rising Global Popularity of Anime and Streaming Platforms Driving Growth in the Anime Merchandising Market
The increasing worldwide popularity of anime, fueled by streaming platforms like Crunchyroll, Netflix, and Funimation, is a major driver of the anime merchandising market. With anime becoming more accessible to international audiences, the demand for figures, apparel, posters, and collectibles has surged. Major franchises such as Demon Slayer, One Piece, and Attack on Titan have gained immense global followings, further stimulating merchandise sales. Additionally, anime conventions and exclusive collaborations with renowned studios and brands contribute to market expansion. The digital era has made it easier for fans to purchase officially licensed merchandise online, while social media marketing and influencer collaborations have significantly boosted consumer engagement. The rise of limited-edition merchandise and premium collectibles has also increased market value, as dedicated collectors seek rare and high-quality anime-related products. This sustained global interest in anime, combined with digital accessibility, continues to propel the anime merchandising industry forward.
Restrain:
High Costs of Licensed Merchandise and Counterfeiting Issues Restrain the Anime Merchandising Market Growth
The anime merchandising market is the high cost of officially licensed products and the widespread issue of counterfeit merchandise. Premium-quality collectibles, figures, and apparel from renowned brands such as Good Smile Company, Bandai Namco, and Aniplex often come at steep prices, making them less accessible to budget-conscious consumers. At the same time, the proliferation of fake and unauthorized merchandise on online marketplaces significantly impacts legitimate sales. Counterfeit products not only result in financial losses for official manufacturers but also diminish brand reputation and customer trust due to inferior quality. Consumers looking for affordable options may unknowingly purchase knockoffs, further affecting market revenue. Addressing this issue requires strict intellectual property enforcement, blockchain authentication, and enhanced consumer awareness. Until a reliable solution is implemented, counterfeiting and pricing concerns will continue to pose challenges for the anime merchandising industry.
Opportunities:
Integration of AR/VR and Blockchain Authentication Presents Growth Opportunities for the Anime Merchandising Market
The adoption of AR/VR technology and blockchain authentication presents a major growth opportunity in the anime merchandising market. Augmented and virtual reality can enhance fan engagement by allowing customers to interact with digital versions of their favorite anime figures before purchase. AR applications could enable fans to visualize how figures and collectibles fit into their spaces, boosting buying confidence. Additionally, blockchain authentication ensures the authenticity of limited-edition and high-value merchandise, protecting consumers from counterfeit products. This technology can store detailed ownership records and provenance, making collectibles more valuable for resale and investment. By incorporating these innovations, companies can attract tech-savvy and serious collectors, thereby increasing revenue and customer loyalty. As digital integration becomes a key factor in merchandising, brands leveraging immersive technology and secure authentication methods will gain a competitive edge, leading to long-term market growth and sustainability.
Challenges:
Fluctuating Consumer Trends and Short Product Life Cycles Pose Challenges in the Anime Merchandising Market
The anime merchandising market is constantly changing consumer preferences and the short product life cycle of anime-related merchandise. The popularity of anime series and franchises varies over time, with some gaining global recognition while others fade quickly. As a result, merchandise linked to trending anime titles has a limited sales window before consumer interest shifts to newer releases. Companies must continuously predict trends and produce merchandise rapidly to stay relevant. This rapid turnover also creates inventory management challenges, as unsold products from declining franchises may lead to financial losses. Additionally, seasonal demand spikes, such as during anime conventions or major series premieres, require brands to strategically plan production and marketing efforts. Addressing these challenges demands data-driven market analysis, adaptable production strategies, and flexible inventory management systems to ensure that anime merchandising companies can sustain profitability amid shifting consumer interests.
By Product
The Figurine segment held the largest revenue share of 38% in 2023, driven by strong consumer demand for high-quality collectible figures based on popular anime franchises. Companies like Good Smile Company, Bandai Namco, and Kotobukiya continue to expand their figurine offerings, introducing detailed scale figures, Nendoroids, and Figma action figures to cater to different collectors.
In 2023, Good Smile Company launched new Nendoroid figures from Chainsaw Man, Jujutsu Kaisen, and Spy x Family, further fueling market demand. Bandai Namco's Tamashii Nations line also expanded with new S.H. Figuarts figures from Dragon Ball Z and One Piece, targeting premium collectors. Limited-edition and exclusive event-based figures continue to drive sales, as anime conventions and online pre-orders create high anticipation among fans.
The Books segment is experiencing the fastest growth, with a CAGR of 10.6% in the forecast period, driven by the increasing global demand for manga, art books, and light novels. Companies like VIZ Media, Kodansha, and Yen Press have aggressively expanded their translated manga offerings, making anime-related literature more accessible to international audiences.
The success of anime adaptations also fuels book sales, as viewers seek original source material after watching an anime series. This synergy between anime streaming and book merchandising strengthens the overall anime merchandising market, ensuring continued growth through multi-platform engagement and expanding global accessibility.
By Deployment
The Online segment held the largest revenue share in 2023, driven by the convenience of e-commerce platforms, global accessibility, and exclusive digital sales. Major companies like Crunchyroll, Good Smile Company, and Aniplex have strengthened their direct-to-consumer (DTC) online stores, offering exclusive pre-orders, limited-edition releases, and regional shipping.
In 2023, Crunchyroll Store expanded its online catalog with exclusive figures, apparel, and Blu-rays from Demon Slayer, One Piece, and Jujutsu Kaisen. Good Smile Company introduced an international pre-order system, allowing global collectors to access Nendoroids, Figma, and Pop-Up Parade figures directly from their official site.
The Offline segment is experiencing the fastest growth in the forecast period, fueled by the increasing popularity of anime conventions, specialty stores, and theme-based retail experiences. Companies like Animate, Kotobukiya, and Mandarake have expanded their physical store networks, offering exclusive in-store merchandise, limited-run collectibles, and immersive anime-themed shopping experiences.
In 2023, Animate opened new flagship stores in Tokyo and Osaka, introducing dedicated sections for Spy x Family and Blue Lock merchandise. Kotobukiya expanded its Akihabara retail space, allowing visitors to experience prototype figure displays before launch.
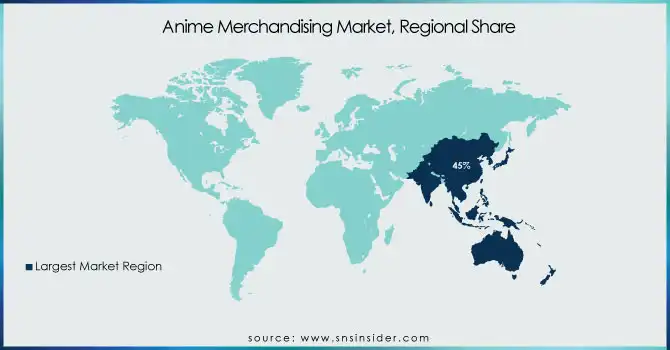
The Asia Pacific region dominated the anime merchandising market in 2023, holding an estimated market share of 45%, driven by Japan’s deep-rooted anime culture, strong consumer demand, and established industry players. Japan remains the global hub for anime production and merchandising, with companies like Bandai Namco, Good Smile Company, and Aniplex leading the market. The region also benefits from high consumer spending on otaku culture, particularly in Japan, South Korea, and China. In 2023, Bandai Namco expanded its Premium Bandai store offerings, while animate opened additional flagship stores in Japan, further boosting regional sales. The rise of anime-themed cafes, pop-up shops, and conventions in cities like Tokyo, Seoul, and Shanghai has reinforced Asia Pacific's dominance in the anime merchandising market.
The North America region is the fastest-growing in the anime merchandising market, with an estimated CAGR of 12.4% in 2023. This growth is fueled by the increasing popularity of anime streaming platforms, rising convention culture, and growing acceptance of anime in mainstream entertainment. Streaming giants like Crunchyroll and Netflix have expanded their anime libraries, driving merchandise demand. Anime conventions like Anime Expo in Los Angeles and New York Comic Con have become major merchandising hubs, with companies such as Funimation (Sony Pictures Entertainment) and Good Smile Company launching exclusive regional products. The expansion of retail partnerships with Walmart, Target, and Hot Topic has also contributed to sales growth. With increasing consumer engagement and rising disposable income, North America is expected to remain the fastest-growing region in the anime merchandising industry.
Get Customized Report as per Your Business Requirement - Enquiry Now
Some of the major players in the Anime Merchandising Market are:
Studio Ghibli, Inc. (Studio Ghibli Collectible Figures, Studio Ghibli Art Books)
Bandai Namco Filmworks Inc. (Gunpla Model Kits, Tamashii Nations Figures)
Crunchyroll (Sony Pictures Entertainment Inc.) (Crunchyroll Exclusive Figures, Crunchyroll Anime Apparel)
Good Smile Company, Inc. (Nendoroid Figures, Figma Action Figures)
Sentai Holdings, LLC (AMC Networks) (Sentai Filmworks Blu-rays, Sentai Filmworks Limited Edition Box Sets)
Ufotable Co., Ltd. (Ufotable Café Exclusive Merchandise, Demon Slayer Collectibles)
Atomic Flare (Anime-Themed Apparel, Anime Art Prints)
MegaHouse (Bandai Namco Filmworks Inc.) (G.E.M. Series Figures, Variable Action Heroes Figures)
MAX FACTORY, INC. (Max Factory Figma, PLAMAX Plastic Model Kits)
Alter Co., Ltd. (Alter Scale Figures, Alter Prize Figures)
BANDAI SPIRITS CO., LTD. (Ichiban Kuji Prize Figures, S.H. Figuarts Figures)
Bioworld Merchandising, Inc. (Anime-Themed Apparel, Anime Accessories)
Stronger Co., Ltd. (Stronger Scale Figures, Stronger Limited-Edition Statues)
Aniplex Inc. (Sony Pictures Entertainment Inc.) (Aniplex Exclusive Figures, Aniplex Limited Edition Blu-rays)
Medicom Toy Co., Ltd. (BE@RBRICK Figures, Real Action Heroes Figures)
In December 2024, Studio Ghibli issued a trilingual statement on its official website addressing the proliferation of unauthorized merchandise infringing on its intellectual property rights. The studio specifically highlighted the sale of high-priced framed images and paintings derived from its films and publications without proper authorization.
In August 2024, Crunchyroll revealed plans to collaborate with Japanese creators to develop anime series rooted in Indian characters, themes, and stories. This initiative aimed to diversify anime narratives and cater to a broader audience by incorporating non-Japanese cultural elements.
| Report Attributes | Details |
|---|---|
| Market Size in 2023 | US$ 9.16 Billion |
| Market Size by 2032 | US$ 19.92 Billion |
| CAGR | CAGR of 9.0 % From 2024 to 2032 |
| Base Year | 2023 |
| Forecast Period | 2024-2032 |
| Historical Data | 2020-2022 |
| Report Scope & Coverage | Market Size, Segments Analysis, Competitive Landscape, Regional Analysis, DROC & SWOT Analysis, Forecast Outlook |
| Key Segments | • By Product (Figurine, Clothing, Books, Board Games & Toys, Posters, Others) • By Deployment (Online, Offline) |
| Regional Analysis/Coverage | North America (US, Canada, Mexico), Europe (Eastern Europe [Poland, Romania, Hungary, Turkey, Rest of Eastern Europe] Western Europe] Germany, France, UK, Italy, Spain, Netherlands, Switzerland, Austria, Rest of Western Europe]), Asia Pacific (China, India, Japan, South Korea, Vietnam, Singapore, Australia, Rest of Asia Pacific), Middle East & Africa (Middle East [UAE, Egypt, Saudi Arabia, Qatar, Rest of Middle East], Africa [Nigeria, South Africa, Rest of Africa], Latin America (Brazil, Argentina, Colombia, Rest of Latin America) |
| Company Profiles | Studio Ghibli, Inc., Bandai Namco Filmworks Inc., Crunchyroll (Sony Pictures Entertainment Inc.), Good Smile Company, Inc., Sentai Holdings, LLC (AMC Networks), Ufotable Co., Ltd., Atomic Flare, MegaHouse (Bandai Namco Filmworks Inc.), MAX FACTORY, INC., Alter Co., Ltd., BANDAI SPIRITS CO., LTD., Bioworld Merchandising, Inc., Stronger Co., Ltd., Aniplex Inc. (Sony Pictures Entertainment Inc.), Medicom Toy Co., Ltd. |
Ans: The Anime Merchandising Market is expected to grow at a CAGR of 9.0% during 2024-2032.
Ans: The Anime Merchandising Market size was USD 9.16 billion in 2023 and is expected to Reach USD 19.92 billion by 2032.
Ans: The major growth factor of the Anime Merchandising Market is the rising global popularity of anime, fueled by streaming platforms, conventions, and increasing consumer demand for collectibles and apparel.
Ans: The Figurine segment dominated the Anime Merchandising Market.
Ans: Asia Pacific dominated the Anime Merchandising Market in 2023.
Table of Content
1. Introduction
1.1 Market Definition
1.2 Scope (Inclusion and Exclusions)
1.3 Research Assumptions
2. Executive Summary
2.1 Market Overview
2.2 Regional Synopsis
2.3 Competitive Summary
3. Research Methodology
3.1 Top-Down Approach
3.2 Bottom-up Approach
3.3. Data Validation
3.4 Primary Interviews
4. Market Dynamics Impact Analysis
4.1 Market Driving Factors Analysis
4.1.2 Drivers
4.1.2 Restraints
4.1.3 Opportunities
4.1.4 Challenges
4.2 PESTLE Analysis
4.3 Porter’s Five Forces Model
5. Statistical Insights and Trends Reporting
5.1 Consumer Demographics (2023)
5.2 Growth in Licensing Agreements
5.3 Social Media & Influencer Impact (2023)
5.4 Subscription Box Market
6. Competitive Landscape
6.1 List of Major Companies, By Region
6.2 Market Share Analysis, By Region
6.3 Product Benchmarking
6.3.1 Product specifications and features
6.3.2 Pricing
6.4 Strategic Initiatives
6.4.1 Marketing and promotional activities
6.4.2 Distribution and supply chain strategies
6.4.3 Expansion plans and new product launches
6.4.4 Strategic partnerships and collaborations
6.5 Technological Advancements
6.6 Market Positioning and Branding
7. Anime Merchandising Market Segmentation, By Product
7.1 Chapter Overview
7.2 Figurine
7.2.1 Figurine Market Trends Analysis (2020-2032)
7.2.2 Figurine Market Size Estimates and Forecasts to 2032 (USD Billion)
7.3 Clothing
7.3.1 Clothing Market Trends Analysis (2020-2032)
7.3.2 Clothing Market Size Estimates and Forecasts to 2032 (USD Billion)
7.5 Books
7.5.1 Books Market Trends Analysis (2020-2032)
7.5.2 Books Market Size Estimates and Forecasts to 2032 (USD Billion)
7.6 Board Games & Toys
7.6.1 Board Games & Toys Market Trends Analysis (2020-2032)
7.6.2 Board Games & Toys Market Size Estimates and Forecasts to 2032 (USD Billion)
7.7 Posters
7.7.1 Posters Market Trends Analysis (2020-2032)
7.7.2 Posters Market Size Estimates and Forecasts to 2032 (USD Billion)
7.8 Others
7.8.1 Others Market Trends Analysis (2020-2032)
7.8.2 Others Market Size Estimates and Forecasts to 2032 (USD Billion)
8. Anime Merchandising Market Segmentation, By Deployment
8.1 Chapter Overview
8.2 Online
8.2.1 Online Market Trends Analysis (2020-2032)
8.2.2 Online Market Size Estimates and Forecasts to 2032 (USD Billion)
8.3 Offline
8.3.1 Offline Market Trends Analysis (2020-2032)
8.3.2 Offline Market Size Estimates and Forecasts to 2032 (USD Billion)
9. Regional Analysis
9.1 Chapter Overview
9.2 North America
9.2.1 Trends Analysis
9.2.2 North America Anime Merchandising Market Estimates and Forecasts, by Country (2020-2032) (USD Billion)
9.2.3 North America Anime Merchandising Market Estimates and Forecasts, By Product (2020-2032) (USD Billion)
9.2.4 North America Anime Merchandising Market Estimates and Forecasts, By Deployment (2020-2032) (USD Billion)
9.2.5 USA
9.2.5.1 USA Anime Merchandising Market Estimates and Forecasts, By Product (2020-2032) (USD Billion)
9.2.5.2 USA Anime Merchandising Market Estimates and Forecasts, By Deployment (2020-2032) (USD Billion)
9.2.6 Canada
9.2.6.1 Canada Anime Merchandising Market Estimates and Forecasts, By Product (2020-2032) (USD Billion)
9.2.6.2 Canada Anime Merchandising Market Estimates and Forecasts, By Deployment (2020-2032) (USD Billion)
9.2.7 Mexico
9.2.7.1 Mexico Anime Merchandising Market Estimates and Forecasts, By Product (2020-2032) (USD Billion)
9.2.7.2 Mexico Anime Merchandising Market Estimates and Forecasts, By Deployment (2020-2032) (USD Billion)
9.3 Europe
9.3.1 Eastern Europe
9.3.1.1 Trends Analysis
9.3.1.2 Eastern Europe Anime Merchandising Market Estimates and Forecasts, by Country (2020-2032) (USD Billion)
9.3.1.3 Eastern Europe Anime Merchandising Market Estimates and Forecasts, By Product (2020-2032) (USD Billion)
9.3.1.4 Eastern Europe Anime Merchandising Market Estimates and Forecasts, By Deployment (2020-2032) (USD Billion)
9.3.1.5 Poland
9.3.1.5.1 Poland Anime Merchandising Market Estimates and Forecasts, By Product (2020-2032) (USD Billion)
9.3.1.5.2 Poland Anime Merchandising Market Estimates and Forecasts, By Deployment (2020-2032) (USD Billion)
9.3.1.6 Romania
9.3.1.6.1 Romania Anime Merchandising Market Estimates and Forecasts, By Product (2020-2032) (USD Billion)
9.3.1.6.2 Romania Anime Merchandising Market Estimates and Forecasts, By Deployment (2020-2032) (USD Billion)
9.3.1.7 Hungary
9.3.1.7.1 Hungary Anime Merchandising Market Estimates and Forecasts, By Product (2020-2032) (USD Billion)
9.3.1.7.2 Hungary Anime Merchandising Market Estimates and Forecasts, By Deployment (2020-2032) (USD Billion)
9.3.1.8 Turkey
9.3.1.8.1 Turkey Anime Merchandising Market Estimates and Forecasts, By Product (2020-2032) (USD Billion)
9.3.1.8.2 Turkey Anime Merchandising Market Estimates and Forecasts, By Deployment (2020-2032) (USD Billion)
9.3.1.9 Rest of Eastern Europe
9.3.1.9.1 Rest of Eastern Europe Anime Merchandising Market Estimates and Forecasts, By Product (2020-2032) (USD Billion)
9.3.1.9.2 Rest of Eastern Europe Anime Merchandising Market Estimates and Forecasts, By Deployment (2020-2032) (USD Billion)
9.3.2 Western Europe
9.3.2.1 Trends Analysis
9.3.2.2 Western Europe Anime Merchandising Market Estimates and Forecasts, by Country (2020-2032) (USD Billion)
9.3.2.3 Western Europe Anime Merchandising Market Estimates and Forecasts, By Product (2020-2032) (USD Billion)
9.3.2.4 Western Europe Anime Merchandising Market Estimates and Forecasts, By Deployment (2020-2032) (USD Billion)
9.3.2.5 Germany
9.3.2.5.1 Germany Anime Merchandising Market Estimates and Forecasts, By Product (2020-2032) (USD Billion)
9.3.2.5.2 Germany Anime Merchandising Market Estimates and Forecasts, By Deployment (2020-2032) (USD Billion)
9.3.2.6 France
9.3.2.6.1 France Anime Merchandising Market Estimates and Forecasts, By Product (2020-2032) (USD Billion)
9.3.2.6.2 France Anime Merchandising Market Estimates and Forecasts, By Deployment (2020-2032) (USD Billion)
9.3.2.7 UK
9.3.2.7.1 UK Anime Merchandising Market Estimates and Forecasts, By Product (2020-2032) (USD Billion)
9.3.2.7.2 UK Anime Merchandising Market Estimates and Forecasts, By Deployment (2020-2032) (USD Billion)
9.3.2.8 Italy
9.3.2.8.1 Italy Anime Merchandising Market Estimates and Forecasts, By Product (2020-2032) (USD Billion)
9.3.2.8.2 Italy Anime Merchandising Market Estimates and Forecasts, By Deployment (2020-2032) (USD Billion)
9.3.2.9 Spain
9.3.2.9.1 Spain Anime Merchandising Market Estimates and Forecasts, By Product (2020-2032) (USD Billion)
9.3.2.9.2 Spain Anime Merchandising Market Estimates and Forecasts, By Deployment (2020-2032) (USD Billion)
9.3.2.10 Netherlands
9.3.2.10.1 Netherlands Anime Merchandising Market Estimates and Forecasts, By Product (2020-2032) (USD Billion)
9.3.2.10.2 Netherlands Anime Merchandising Market Estimates and Forecasts, By Deployment (2020-2032) (USD Billion)
9.3.2.11 Switzerland
9.3.2.11.1 Switzerland Anime Merchandising Market Estimates and Forecasts, By Product (2020-2032) (USD Billion)
9.3.2.11.2 Switzerland Anime Merchandising Market Estimates and Forecasts, By Deployment (2020-2032) (USD Billion)
9.3.2.12 Austria
9.3.2.12.1 Austria Anime Merchandising Market Estimates and Forecasts, By Product (2020-2032) (USD Billion)
9.3.2.12.2 Austria Anime Merchandising Market Estimates and Forecasts, By Deployment (2020-2032) (USD Billion)
9.3.2.13 Rest of Western Europe
9.3.2.13.1 Rest of Western Europe Anime Merchandising Market Estimates and Forecasts, By Product (2020-2032) (USD Billion)
9.3.2.13.2 Rest of Western Europe Anime Merchandising Market Estimates and Forecasts, By Deployment (2020-2032) (USD Billion)
9.4 Asia Pacific
9.4.1 Trends Analysis
9.4.2 Asia Pacific Anime Merchandising Market Estimates and Forecasts, by Country (2020-2032) (USD Billion)
9.4.3 Asia Pacific Anime Merchandising Market Estimates and Forecasts, By Product (2020-2032) (USD Billion)
9.4.4 Asia Pacific Anime Merchandising Market Estimates and Forecasts, By Deployment (2020-2032) (USD Billion)
9.4.5 China
9.4.5.1 China Anime Merchandising Market Estimates and Forecasts, By Product (2020-2032) (USD Billion)
9.4.5.2 China Anime Merchandising Market Estimates and Forecasts, By Deployment (2020-2032) (USD Billion)
9.4.6 India
9.4.5.1 India Anime Merchandising Market Estimates and Forecasts, By Product (2020-2032) (USD Billion)
9.4.5.2 India Anime Merchandising Market Estimates and Forecasts, By Deployment (2020-2032) (USD Billion)
9.4.5 Japan
9.4.5.1 Japan Anime Merchandising Market Estimates and Forecasts, By Product (2020-2032) (USD Billion)
9.4.5.2 Japan Anime Merchandising Market Estimates and Forecasts, By Deployment (2020-2032) (USD Billion)
9.4.6 South Korea
9.4.6.1 South Korea Anime Merchandising Market Estimates and Forecasts, By Product (2020-2032) (USD Billion)
9.4.6.2 South Korea Anime Merchandising Market Estimates and Forecasts, By Deployment (2020-2032) (USD Billion)
9.4.7 Vietnam
9.4.7.1 Vietnam Anime Merchandising Market Estimates and Forecasts, By Product (2020-2032) (USD Billion)
9.2.7.2 Vietnam Anime Merchandising Market Estimates and Forecasts, By Deployment (2020-2032) (USD Billion)
9.4.8 Singapore
9.4.8.1 Singapore Anime Merchandising Market Estimates and Forecasts, By Product (2020-2032) (USD Billion)
9.4.8.2 Singapore Anime Merchandising Market Estimates and Forecasts, By Deployment (2020-2032) (USD Billion)
9.4.9 Australia
9.4.9.1 Australia Anime Merchandising Market Estimates and Forecasts, By Product (2020-2032) (USD Billion)
9.4.9.2 Australia Anime Merchandising Market Estimates and Forecasts, By Deployment (2020-2032) (USD Billion)
9.4.10 Rest of Asia Pacific
9.4.10.1 Rest of Asia Pacific Anime Merchandising Market Estimates and Forecasts, By Product (2020-2032) (USD Billion)
9.4.10.2 Rest of Asia Pacific Anime Merchandising Market Estimates and Forecasts, By Deployment (2020-2032) (USD Billion)
9.5 Middle East and Africa
9.5.1 Middle East
9.5.1.1 Trends Analysis
9.5.1.2 Middle East Anime Merchandising Market Estimates and Forecasts, by Country (2020-2032) (USD Billion)
9.5.1.3 Middle East Anime Merchandising Market Estimates and Forecasts, By Product (2020-2032) (USD Billion)
9.5.1.4 Middle East Anime Merchandising Market Estimates and Forecasts, By Deployment (2020-2032) (USD Billion)
9.5.1.5 UAE
9.5.1.5.1 UAE Anime Merchandising Market Estimates and Forecasts, By Product (2020-2032) (USD Billion)
9.5.1.5.2 UAE Anime Merchandising Market Estimates and Forecasts, By Deployment (2020-2032) (USD Billion)
9.5.1.6 Egypt
9.5.1.6.1 Egypt Anime Merchandising Market Estimates and Forecasts, By Product (2020-2032) (USD Billion)
9.5.1.6.2 Egypt Anime Merchandising Market Estimates and Forecasts, By Deployment (2020-2032) (USD Billion)
9.5.1.7 Saudi Arabia
9.5.1.7.1 Saudi Arabia Anime Merchandising Market Estimates and Forecasts, By Product (2020-2032) (USD Billion)
9.5.1.7.2 Saudi Arabia Anime Merchandising Market Estimates and Forecasts, By Deployment (2020-2032) (USD Billion)
9.5.1.8 Qatar
9.5.1.8.1 Qatar Anime Merchandising Market Estimates and Forecasts, By Product (2020-2032) (USD Billion)
9.5.1.8.2 Qatar Anime Merchandising Market Estimates and Forecasts, By Deployment (2020-2032) (USD Billion)
9.5.1.9 Rest of Middle East
9.5.1.9.1 Rest of Middle East Anime Merchandising Market Estimates and Forecasts, By Product (2020-2032) (USD Billion)
9.5.1.9.2 Rest of Middle East Anime Merchandising Market Estimates and Forecasts, By Deployment (2020-2032) (USD Billion)
9.5.2 Africa
9.5.2.1 Trends Analysis
9.5.2.2 Africa Anime Merchandising Market Estimates and Forecasts, by Country (2020-2032) (USD Billion)
9.5.2.3 Africa Anime Merchandising Market Estimates and Forecasts, By Product (2020-2032) (USD Billion)
9.5.2.4 Africa Anime Merchandising Market Estimates and Forecasts, By Deployment (2020-2032) (USD Billion)
9.5.2.5 South Africa
9.5.2.5.1 South Africa Anime Merchandising Market Estimates and Forecasts, By Product (2020-2032) (USD Billion)
9.5.2.5.2 South Africa Anime Merchandising Market Estimates and Forecasts, By Deployment (2020-2032) (USD Billion)
9.5.2.6 Nigeria
9.5.2.6.1 Nigeria Anime Merchandising Market Estimates and Forecasts, By Product (2020-2032) (USD Billion)
9.5.2.6.2 Nigeria Anime Merchandising Market Estimates and Forecasts, By Deployment (2020-2032) (USD Billion)
9.5.2.7 Rest of Africa
9.5.2.7.1 Rest of Africa Anime Merchandising Market Estimates and Forecasts, By Product (2020-2032) (USD Billion)
9.5.2.7.2 Rest of Africa Anime Merchandising Market Estimates and Forecasts, By Deployment (2020-2032) (USD Billion)
9.6 Latin America
9.6.1 Trends Analysis
9.6.2 Latin America Anime Merchandising Market Estimates and Forecasts, by Country (2020-2032) (USD Billion)
9.6.3 Latin America Anime Merchandising Market Estimates and Forecasts, By Product (2020-2032) (USD Billion)
9.6.4 Latin America Anime Merchandising Market Estimates and Forecasts, By Deployment (2020-2032) (USD Billion)
9.6.5 Brazil
9.6.5.1 Brazil Anime Merchandising Market Estimates and Forecasts, By Product (2020-2032) (USD Billion)
9.6.5.2 Brazil Anime Merchandising Market Estimates and Forecasts, By Deployment (2020-2032) (USD Billion)
9.6.6 Argentina
9.6.6.1 Argentina Anime Merchandising Market Estimates and Forecasts, By Product (2020-2032) (USD Billion)
9.6.6.2 Argentina Anime Merchandising Market Estimates and Forecasts, By Deployment (2020-2032) (USD Billion)
9.6.7 Colombia
9.6.7.1 Colombia Anime Merchandising Market Estimates and Forecasts, By Product (2020-2032) (USD Billion)
9.6.7.2 Colombia Anime Merchandising Market Estimates and Forecasts, By Deployment (2020-2032) (USD Billion)
9.6.8 Rest of Latin America
9.6.8.1 Rest of Latin America Anime Merchandising Market Estimates and Forecasts, By Product (2020-2032) (USD Billion)
9.6.8.2 Rest of Latin America Anime Merchandising Market Estimates and Forecasts, By Deployment (2020-2032) (USD Billion)
10. Company Profiles
10.1 Studio Ghibli, Inc.
10.1.1 Company Overview
10.1.2 Financial
10.1.3 Products/ Services Offered
110.1.4 SWOT Analysis
10.2 Bandai Namco Filmworks Inc.
10.2.1 Company Overview
10.2.2 Financial
10.2.3 Products/ Services Offered
10.2.4 SWOT Analysis
10.3 Crunchyroll (Sony Pictures Entertainment Inc.)
10.3.1 Company Overview
10.3.2 Financial
10.3.3 Products/ Services Offered
10.3.4 SWOT Analysis
10.4 Good Smile Company, Inc.
10.4.1 Company Overview
10.4.2 Financial
10.4.3 Products/ Services Offered
10.4.4 SWOT Analysis
10.5 Sentai Holdings, LLC (AMC Networks)
10.5.1 Company Overview
10.5.2 Financial
10.5.3 Products/ Services Offered
10.5.4 SWOT Analysis
10.6 Ufotable Co., Ltd.
10.6.1 Company Overview
10.6.2 Financial
10.6.3 Products/ Services Offered
10.6.4 SWOT Analysis
10.7 Atomic Flare
10.7.1 Company Overview
10.7.2 Financial
10.7.3 Products/ Services Offered
10.7.4 SWOT Analysis
10.8 MegaHouse (Bandai Namco Filmworks Inc.)
10.8.1 Company Overview
10.8.2 Financial
10.8.3 Products/ Services Offered
10.8.4 SWOT Analysis
10.9 MAX FACTORY, INC.
10.9.1 Company Overview
10.9.2 Financial
10.9.3 Products/ Services Offered
10.9.4 SWOT Analysis
10.10 Alter Co., Ltd.
10.9.1 Company Overview
10.9.2 Financial
10.9.3 Products/ Services Offered
10.9.4 SWOT Analysis
11. Use Cases and Best Practices
12. Conclusion
An accurate research report requires proper strategizing as well as implementation. There are multiple factors involved in the completion of good and accurate research report and selecting the best methodology to compete the research is the toughest part. Since the research reports we provide play a crucial role in any company’s decision-making process, therefore we at SNS Insider always believe that we should choose the best method which gives us results closer to reality. This allows us to reach at a stage wherein we can provide our clients best and accurate investment to output ratio.
Each report that we prepare takes a timeframe of 350-400 business hours for production. Starting from the selection of titles through a couple of in-depth brain storming session to the final QC process before uploading our titles on our website we dedicate around 350 working hours. The titles are selected based on their current market cap and the foreseen CAGR and growth.
The 5 steps process:
Step 1: Secondary Research:
Secondary Research or Desk Research is as the name suggests is a research process wherein, we collect data through the readily available information. In this process we use various paid and unpaid databases which our team has access to and gather data through the same. This includes examining of listed companies’ annual reports, Journals, SEC filling etc. Apart from this our team has access to various associations across the globe across different industries. Lastly, we have exchange relationships with various university as well as individual libraries.

Step 2: Primary Research
When we talk about primary research, it is a type of study in which the researchers collect relevant data samples directly, rather than relying on previously collected data. This type of research is focused on gaining content specific facts that can be sued to solve specific problems. Since the collected data is fresh and first hand therefore it makes the study more accurate and genuine.
We at SNS Insider have divided Primary Research into 2 parts.
Part 1 wherein we interview the KOLs of major players as well as the upcoming ones across various geographic regions. This allows us to have their view over the market scenario and acts as an important tool to come closer to the accurate market numbers. As many as 45 paid and unpaid primary interviews are taken from both the demand and supply side of the industry to make sure we land at an accurate judgement and analysis of the market.
This step involves the triangulation of data wherein our team analyses the interview transcripts, online survey responses and observation of on filed participants. The below mentioned chart should give a better understanding of the part 1 of the primary interview.

Part 2: In this part of primary research the data collected via secondary research and the part 1 of the primary research is validated with the interviews from individual consultants and subject matter experts.
Consultants are those set of people who have at least 12 years of experience and expertise within the industry whereas Subject Matter Experts are those with at least 15 years of experience behind their back within the same space. The data with the help of two main processes i.e., FGDs (Focused Group Discussions) and IDs (Individual Discussions). This gives us a 3rd party nonbiased primary view of the market scenario making it a more dependable one while collation of the data pointers.
Step 3: Data Bank Validation
Once all the information is collected via primary and secondary sources, we run that information for data validation. At our intelligence centre our research heads track a lot of information related to the market which includes the quarterly reports, the daily stock prices, and other relevant information. Our data bank server gets updated every fortnight and that is how the information which we collected using our primary and secondary information is revalidated in real time.

Step 4: QA/QC Process
After all the data collection and validation our team does a final level of quality check and quality assurance to get rid of any unwanted or undesired mistakes. This might include but not limited to getting rid of the any typos, duplication of numbers or missing of any important information. The people involved in this process include technical content writers, research heads and graphics people. Once this process is completed the title gets uploader on our platform for our clients to read it.
Step 5: Final QC/QA Process:
This is the last process and comes when the client has ordered the study. In this process a final QA/QC is done before the study is emailed to the client. Since we believe in giving our clients a good experience of our research studies, therefore, to make sure that we do not lack at our end in any way humanly possible we do a final round of quality check and then dispatch the study to the client.
Key Segments:
By Product
Figurine
Clothing
Books
Board Games & Toys
Posters
Others
By Deployment
Online
Offline
Request for Segment Customization as per your Business Requirement: Segment Customization Request
Regional Coverage:
North America
US
Canada
Mexico
Europe
Eastern Europe
Poland
Romania
Hungary
Turkey
Rest of Eastern Europe
Western Europe
Germany
France
UK
Italy
Spain
Netherlands
Switzerland
Austria
Rest of Western Europe
Asia Pacific
China
India
Japan
South Korea
Vietnam
Singapore
Australia
Rest of Asia Pacific
Middle East & Africa
Middle East
UAE
Egypt
Saudi Arabia
Qatar
Rest of Middle East
Africa
Nigeria
South Africa
Rest of Africa
Latin America
Brazil
Argentina
Colombia
Rest of Latin America
Request for Country Level Research Report: Country Level Customization Request
Available Customization
With the given market data, SNS Insider offers customization as per the company’s specific needs. The following customization options are available for the report:
Detailed Volume Analysis
Criss-Cross segment analysis (e.g. Product X Application)
Competitive Product Benchmarking
Geographic Analysis
Additional countries in any of the regions
Customized Data Representation
Detailed analysis and profiling of additional market players
Workflow Automation Market was valued at USD 20.47 billion in 2023 and is expected to reach USD 48.31 billion by 2032, growing at a CAGR of 10.09% from 2024-2032.
The Web Content Management Market Size was valued at USD 8.13 Billion in 2023 and will reach USD 28.76 Billion by 2032 and grow at a CAGR of 15.1% by 2032.
The Generative AI in Animation Market Size was valued at USD 1.32 Billion in 2023 and is expected to reach USD 26.13 Billion by 2032 and grow at a CAGR of 39.5% over the forecast period 2024-2032.
The Workplace Transformation Market was valued at USD 23.87 billion in 2023 and will reach USD 103.10 billion by 2032, growing at a CAGR of 17.68% by 2032.
The E-Signature Software Market size was valued at USD 4.81 Billion in 2023. It is estimated to reach USD 67.59 Billion by 2032, growing at a CAGR of 34.14% during 2024-2032.
The Smart Speaker Market was valued at USD 12.23 Billion in 2023 and is expected to reach USD 55.44 Billion by 2032, growing at a CAGR of 18.33% by 2032.

Hi! Click one of our member below to chat on Phone
© 2025 All Rights Reserved by SNS Insider Pvt Ltd


