Get More Information on Animal Model Market - Request Sample Report
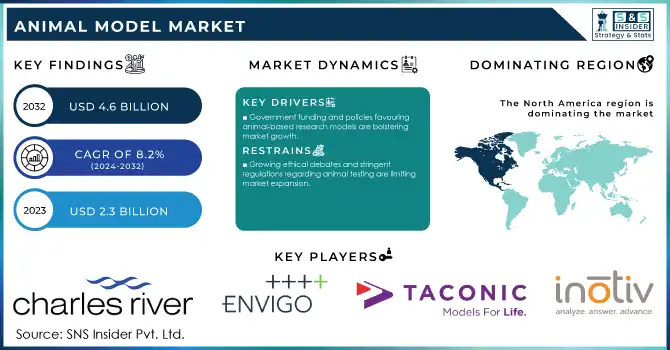
The Animal model Market Size was valued at USD 2.3 Billion in 2023 and is expected to reach USD 4.6 billion by 2032, growing at a CAGR of 8.2% over the forecast period 2024-2032.
The animal model market continues to experience significant growth, underpinned by advancements in preclinical research, increasing government funding for biomedical studies, and a rising incidence of chronic and infectious diseases globally. Governments and international organizations have consistently emphasized the critical role of animal models in accelerating medical breakthroughs and combating public health challenges. In 2023, the National Institutes of Health (NIH) allocated over $41 billion to medical research, with a substantial share directed toward studies utilizing animal models for drug development, vaccine testing, and genetic research. A specific focus was placed on zoonotic diseases, as the World Health Organization (WHO) reported that 60% of emerging infectious diseases originate from animal sources. This underscores the pivotal role of animal models in understanding disease mechanisms and developing therapeutic interventions. Furthermore, the Centers for Disease Control and Prevention (CDC) documented a 12% rise in animal model utilization for vaccine development between 2022 and 2023.
Government initiatives such as the NIH's Accelerating Medicines Partnership and the FDA's Animal Rule have further supported the integration of animal models into preclinical studies. For instance, in 2023, over 65% of preclinical trials funded by the NIH involved animal models, highlighting their centrality in biomedical research pipelines. Additionally, international funding for ethical advancements in animal research has gained momentum. The European Commission, for example, allocated €500 million under the "3Rs" initiative (Replacement, Reduction, and Refinement) to promote ethical animal testing practices and advance alternative model development.
The development of genome editing and genetic engineering tools has resulted in a revolution in the field of animal modeling. The capacity to change genes in animals allows scientists to construct models that closely resemble human diseases, resulting in more precise and accurate results. These technical improvements have increased the usability of animal models tremendously, consequently promoting market expansion. In May 2023, for example, researchers from the Massachusetts Institute of Technology devised a novel method for engineering specific cancer-linked mutations into mice models, employing the CRISPR approach to create models of diverse mutations.
Drivers
Technological progress in genome editing, such as CRISPR, enables the development of animal models that closely mimic human diseases, enhancing research accuracy.
Pharmaceutical and biotechnology companies are investing more in research and development, utilizing animal models for drug discovery and development processes.
Government funding and policies favouring animal-based research models are bolstering market growth.
The continuous growth of genetic engineering techniques, such as CRISPR-Cas9, is a significant driver of the animal model market. Such technologies provide accurate genome editing capabilities for the development of transgenic and knockout models reflective of human diseases previously difficult to recreate. This has transformed biomedicine, enabling improved understanding of disease mechanisms and more rational therapeutic development. In 2023, more than 70% of research in neuroscience and oncology used genetically modified mouse models, according to the National Institutes of Health (NIH). These models have been an important part of preclinical studies enabling the fast and efficient modeling of diseases such as Alzheimer several types of cancers. Additionally, CRISPR has simplified the generation of animal models, reducing development timelines from several months to a few weeks, and significantly enhancing research efficiency.
The application of these advanced models has expanded into studying rare genetic disorders. In 2024, researchers at Stanford University created a genetic mouse model for Rett Syndrome (a rare neurological condition) and discovered a new drug target. In addition, initiatives like the International Mouse Phenotyping Consortium (IMPC) have sequenced thousands of genetically modified mice and phenotyped each strain uniquely, offering powerful tools in the drug discovery paradigm. These developments guarantee that genetically engineered animal models will be an invaluable part of contemporary medical research.
Restraints:
Growing ethical debates and stringent regulations regarding animal testing are limiting market expansion.
The significant expenses associated with maintaining and utilizing animal models pose financial challenges for research institutions.
The development of in vitro and computational models offers alternatives to animal testing, potentially reducing demand for animal models.
The increasing realization regarding the ethical issues related to using animal models and stringent regulatory frameworks. Public sentiment against animal testing is growing, driven by awareness campaigns from animal rights organizations and advocacy for alternative research methods. While some argue that animal experiments should be stopped for ethical reasons, others debate the pain and suffering that is observed when animals are tested, and if such testing should be done at all.
Moreover, in some parts of the world, strict guidelines have been implemented by regulatory authorities to reduce animal usage in experimentation. For example, the European Union's Directive 2010/63/EU requires that the 3Rs principle (Replacement, Reduction, and Refinement) be used to limit the use of animals in research. These policies frequently result in project delays and higher bureaucracy for the researchers. These concerns and regulatory hurdles have driven the search for alternative methods, including in vitro approaches and computer models, and caused a contentious debate regarding the relevance of animal models in current science.
By Animal Type
Due to their diverse application in biomedical research, mice accounted for the largest revenue share 51% of the animal type segment in 2023. According to the National Center for Biotechnology Information (NCBI), 75% of genes responsible for human diseases are also found in mice, making them indispensable in genetic and pharmaceutical studies. Furthermore, the Food and Drug Administration (FDA) states that mice were involved in over 65% of preclinical trials approved in 2023. These species have short generation times and are relatively inexpensive which makes them operate well in a long-term study. Another strong showing for transgenic and knockout mice research increased by 18% in 2023, further solidifying their dominance.
By Application
In 2023, the cancer segment dominated with a 41% market share due to the growing interest in cancer research. Government data from the American Cancer Society (ACS) estimates that more than 1.9 million cases of cancer will be diagnosed in 2023, bringing up the investments for novel therapies through animal models. In 2023, the NIH invested around $8 billion in cancer research, and more than 40% of these research projects use animal models. Such models are essential for studying tumorigenesis, metastasis, and drug responses. Additionally, more ethical approaches, such as OLAW-supported protocols leading to diminished animal burden, have allowed them to remain in use in cancer models.
By End-use
The pharmaceutical and biotechnology companies segment accounted for the largest market share of 38% in 2023, due to the major dependency of these companies on animal models during the drug discovery and development phase. The Biotechnology Innovation Organization (BIO) has long reviewed government statistics showing that biopharmaceutical R&D spending increased by 14% between 2022 and 2023 and that animal testing is a critical part of that process. The research eventually led to FDA approval of more than 100 drugs over ten years, nearly 60% of which had been studied in animal models before their release. This segment’s growth is further bolstered by global initiatives like the 21st Century Cures Act, which promotes the accelerated approval of breakthrough therapies, often necessitating preclinical animal studies.
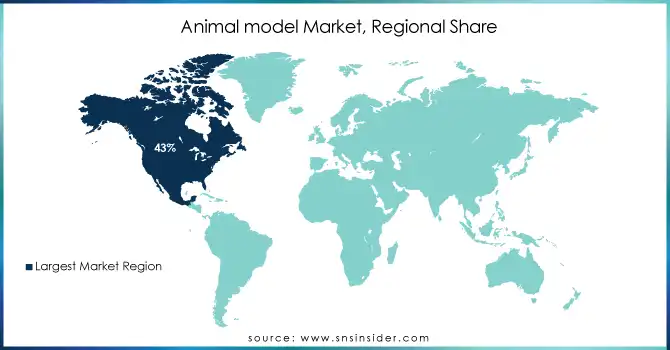
North America was the leading region in 2023 with a 43% revenue share of the animal model market. A lot of government spending on biomedical research and the existence of world-leading academic and pharmaceutical companies has led to this leadership. For instance, 70% of federally funded research projects included animal models, according to a report from the U.S. Department of Health and Human Services (HHS). In 2023, the NIH also allocated an additional 15% towards translational research initiatives which contributed to continued regional growth. Canada has also refined its preclinical emphasis; in 2023, the Canadian Institutes of Health Research (CIHR) earmarked $500 million for the advancement of new animal models.
On the other hand, the highest compound annual growth rate is expected in the Asia-Pacific region over the forecast years with a significant CAGR for the years 2024-2032. The rapid development of pharmaceutical industries in countries like China and India, along with the extensive subsidies provided by governments, have put these countries at the forefront of this trend. The Chinese Ministry of Science and Technology announced a 20% budget increase for biotechnology research in 2023, prioritizing advanced animal models for drug development. In the same manner, grants for animal testing methods innovation by India recently launched several by its Department of Biotechnology (DBT) to support the region that has been witnessing strong growth. Europe continues to be active, propelled by moral progress and regulatory activities around the “3Rs” concept (Replacement, Reduction, and Refinement), including further Horizon Europe activities.
Get Customized Report as per Your Business Requirement - Request For Customized Report
In June 2023, The U.S. NIH launched a $2 billion initiative aimed at enhancing the development of next-generation animal models for rare diseases.
In May 2023, researchers at University Hospital Carl Gustav Carus created a humanized mouse with a defective gene linked to congenital adrenal hyperplasia, marking a potential breakthrough for developing new treatments.
In January 2023, Charles River Laboratories expanded its portfolio of triple-immunodeficient mice by adding two new NCG strains designed for research in oncology, immunology, and infectious diseases.
Key Service Providers/Manufacturers
Charles River Laboratories (GEM® Mice, Elite™ Mice)
Envigo (Rat Model, Mouse Model)
Taconic Biosciences (Rat Models, Knockout Mice)
Harlan Laboratories (Crl: CD(SD) Rats, Crl: OFA® Sprague Dawley® Rats)
Janvier Labs (C57BL/6J Mice, Wistar Rats)
Shanghai Model Organisms Center (Sirt1-/- Mouse, R6/2 Transgenic Mouse)
Crown Bioscience (NOG Mouse, HuGEM® Mouse)
The Jackson Laboratory (C57BL/6J, C3H/HeJ)
BioIVT (F344 Rat, SD Rat)
Inotiv (ICR Mice, SD Rats)
Key Users of Services/Products
Pfizer
Johnson & Johnson
Merck & Co.
Bristol Myers Squibb
Roche
Novartis
AstraZeneca
Eli Lilly
Sanofi
AbbVie
| Report Attributes | Details |
|---|---|
| Market Size in 2023 | USD 2.3 Billion |
| Market Size by 2032 | USD 4.6 Billion |
| CAGR | CAGR of 8.2% From 2024 to 2032 |
| Base Year | 2023 |
| Forecast Period | 2024-2032 |
| Historical Data | 2020-2022 |
| Report Scope & Coverage | Market Size, Segments Analysis, Competitive Landscape, Regional Analysis, DROC & SWOT Analysis, Forecast Outlook |
| Key Segments | • By Animal Type (Mice, Rat, Guinea Pigs, Rabbits, Hamsters, Others) • By Application (Cancer, Immunological Disease, Infectious Disease, Others) • By End-use (Pharmaceutical & Biotechnology Companies, Academic Research Institute, Contract Research Organization) |
| Regional Analysis/Coverage | North America (US, Canada, Mexico), Europe (Eastern Europe [Poland, Romania, Hungary, Turkey, Rest of Eastern Europe] Western Europe] Germany, France, UK, Italy, Spain, Netherlands, Switzerland, Austria, Rest of Western Europe]), Asia Pacific (China, India, Japan, South Korea, Vietnam, Singapore, Australia, Rest of Asia Pacific), Middle East & Africa (Middle East [UAE, Egypt, Saudi Arabia, Qatar, Rest of Middle East], Africa [Nigeria, South Africa, Rest of Africa], Latin America (Brazil, Argentina, Colombia, Rest of Latin America) |
| Company Profiles | Charles River Laboratories, Envigo, Taconic Biosciences, Harlan Laboratories, Janvier Labs, Shanghai Model Organisms Center, Crown Bioscience, The Jackson Laboratory, BioIVT, Inotiv, quamma. |
| Key Drivers | • Technological progress in genome editing, such as CRISPR, enables the development of animal models that closely mimic human diseases, enhancing research accuracy. • Pharmaceutical and biotechnology companies are investing more in research and development, utilizing animal models for drug discovery and development processes. |
| Restraints | • Growing ethical debates and stringent regulations regarding animal testing are limiting market expansion. • The significant expenses associated with maintaining and utilizing animal models pose financial challenges for research institutions. |
Ans. The projected market size for the Animal model Market is USD 4.6 Billion by 2032.
Ans: The North American region dominated the Animal model Market in 2023.
Ans: The CAGR of the Animal model Market is 8.2% During the forecast period of 2024-2032.
Ans: The Pharmaceutical & Biotechnology Companies end-use segment dominated the Animal model Market in 2023.
Ans:
Table of Contents
1. Introduction
1.1 Market Definition
1.2 Scope (Inclusion and Exclusions)
1.3 Research Assumptions
2. Executive Summary
2.1 Market Overview
2.2 Regional Synopsis
2.3 Competitive Summary
3. Research Methodology
3.1 Top-Down Approach
3.2 Bottom-up Approach
3.3. Data Validation
3.4 Primary Interviews
4. Market Dynamics Impact Analysis
4.1 Market Driving Factors Analysis
4.1.1 Drivers
4.1.2 Restraints
4.1.3 Opportunities
4.1.4 Challenges
4.2 PESTLE Analysis
4.3 Porter’s Five Forces Model
5. Statistical Insights and Trends Reporting
5.1 Incidence and Prevalence (2023)
5.2 Prescription Trends, (2023), by Region
5.3 Drug Volume: Production and usage volumes of pharmaceuticals.
5.4 Healthcare Spending: Expenditure data by government, insurers, and out-of-pocket by patients.
6. Competitive Landscape
6.1 List of Major Companies, By Region
6.2 Market Share Analysis, By Region
6.3 Product Benchmarking
6.3.1 Product specifications and features
6.3.2 Pricing
6.4 Strategic Initiatives
6.4.1 Marketing and promotional activities
6.4.2 Distribution and Supply Chain Strategies
6.4.3 Expansion plans and new product launches
6.4.4 Strategic partnerships and collaborations
6.5 Technological Advancements
6.6 Market Positioning and Branding
7. Animal model Market Segmentation, By Animal Type
7.1 Chapter Overview
7.2 Mice
7.2.1 Mice Market Trends Analysis (2020-2032)
7.2.2 Mice Market Size Estimates and Forecasts to 2032 (USD Billion)
7.3 Rat
7.3.1 Rat Market Trends Analysis (2020-2032)
7.3.2 Rat Market Size Estimates and Forecasts to 2032 (USD Billion)
7.4 Guinea Pigs
7.4.1 Guinea Pigs Market Trends Analysis (2020-2032)
7.4.2 Guinea Pigs Market Size Estimates and Forecasts to 2032 (USD Billion)
7.5 Rabbits
7.5.1 Rabbits Market Trends Analysis (2020-2032)
7.5.2 Rabbits Market Size Estimates and Forecasts to 2032 (USD Billion)
7.6 Hamsters
7.6.1 Hamsters Market Trends Analysis (2020-2032)
7.6.2 Hamsters Market Size Estimates and Forecasts to 2032 (USD Billion)
7.7 Others
7.7.1 Others Market Trends Analysis (2020-2032)
7.7.2 Others Market Size Estimates and Forecasts to 2032 (USD Billion)
8. Animal model Market Segmentation, By Application
8.1 Chapter Overview
8.2 Cancer
8.2.1 Cancer Market Trends Analysis (2020-2032)
8.2.2 Cancer Market Size Estimates and Forecasts to 2032 (USD Billion)
8.3 Immunological Disease
8.3.1 Immunological Disease Market Trends Analysis (2020-2032)
8.3.2 Immunological Disease Market Size Estimates and Forecasts to 2032 (USD Billion)
8.4 Infectious Disease
8.4.1 Infectious Disease Market Trends Analysis (2020-2032)
8.4.2 Infectious Disease Market Size Estimates and Forecasts to 2032 (USD Billion)
8.5 Others
8.5.1 Others Market Trends Analysis (2020-2032)
8.5.2 Others Market Size Estimates and Forecasts to 2032 (USD Billion)
9. Animal model Market Segmentation, By End-use
9.1 Chapter Overview
9.2 Pharmaceutical & Biotechnology Companies
9.2.1 Pharmaceutical & Biotechnology Companies Market Trends Analysis (2020-2032)
9.2.2 Pharmaceutical & Biotechnology Companies Market Size Estimates and Forecasts to 2032 (USD Billion)
9.3 Academic Research Institute
9.3.1 Academic Research Institute Market Trends Analysis (2020-2032)
9.3.2 Academic Research Institute Market Size Estimates and Forecasts to 2032 (USD Billion)
9.4 Contract Research Organization
9.4.1 Contract Research Organization Market Trends Analysis (2020-2032)
9.4.2 Contract Research Organization Market Size Estimates and Forecasts to 2032 (USD Billion)
10. Regional Analysis
10.1 Chapter Overview
10.2 North America
10.2.1 Trends Analysis
10.2.2 North America Animal model Market Estimates and Forecasts, by Country (2020-2032) (USD Billion)
10.2.3 North America Animal model Market Estimates and Forecasts, By Animal Type (2020-2032) (USD Billion)
10.2.4 North America Animal model Market Estimates and Forecasts, By Application (2020-2032) (USD Billion)
10.2.5 North America Animal model Market Estimates and Forecasts, By End-use (2020-2032) (USD Billion)
10.2.6 USA
10.2.6.1 USA Animal model Market Estimates and Forecasts, By Animal Type (2020-2032) (USD Billion)
10.2.6.2 USA Animal model Market Estimates and Forecasts, By Application (2020-2032) (USD Billion)
10.2.6.3 USA Animal model Market Estimates and Forecasts, By End-use (2020-2032) (USD Billion)
10.2.7 Canada
10.2.7.1 Canada Animal model Market Estimates and Forecasts, By Animal Type (2020-2032) (USD Billion)
10.2.7.2 Canada Animal model Market Estimates and Forecasts, By Application (2020-2032) (USD Billion)
10.2.7.3 Canada Animal model Market Estimates and Forecasts, By End-use (2020-2032) (USD Billion)
10.2.8 Mexico
10.2.8.1 Mexico Animal model Market Estimates and Forecasts, By Animal Type (2020-2032) (USD Billion)
10.2.8.2 Mexico Animal model Market Estimates and Forecasts, By Application (2020-2032) (USD Billion)
10.2.8.3 Mexico Animal model Market Estimates and Forecasts, By End-use (2020-2032) (USD Billion)
10.3 Europe
10.3.1 Eastern Europe
10.3.1.1 Trends Analysis
10.3.1.2 Eastern Europe Animal model Market Estimates and Forecasts, by Country (2020-2032) (USD Billion)
10.3.1.3 Eastern Europe Animal model Market Estimates and Forecasts, By Animal Type (2020-2032) (USD Billion)
10.3.1.4 Eastern Europe Animal model Market Estimates and Forecasts, By Application (2020-2032) (USD Billion)
10.3.1.5 Eastern Europe Animal model Market Estimates and Forecasts, By End-use (2020-2032) (USD Billion)
10.3.1.6 Poland
10.3.1.6.1 Poland Animal model Market Estimates and Forecasts, By Animal Type (2020-2032) (USD Billion)
10.3.1.6.2 Poland Animal model Market Estimates and Forecasts, By Application (2020-2032) (USD Billion)
10.3.1.6.3 Poland Animal model Market Estimates and Forecasts, By End-use (2020-2032) (USD Billion)
10.3.1.7 Romania
10.3.1.7.1 Romania Animal model Market Estimates and Forecasts, By Animal Type (2020-2032) (USD Billion)
10.3.1.7.2 Romania Animal model Market Estimates and Forecasts, By Application (2020-2032) (USD Billion)
10.3.1.7.3 Romania Animal model Market Estimates and Forecasts, By End-use (2020-2032) (USD Billion)
10.3.1.8 Hungary
10.3.1.8.1 Hungary Animal model Market Estimates and Forecasts, By Animal Type (2020-2032) (USD Billion)
10.3.1.8.2 Hungary Animal model Market Estimates and Forecasts, By Application (2020-2032) (USD Billion)
10.3.1.8.3 Hungary Animal model Market Estimates and Forecasts, By End-use (2020-2032) (USD Billion)
10.3.1.9 Turkey
10.3.1.9.1 Turkey Animal model Market Estimates and Forecasts, By Animal Type (2020-2032) (USD Billion)
10.3.1.9.2 Turkey Animal model Market Estimates and Forecasts, By Application (2020-2032) (USD Billion)
10.3.1.9.3 Turkey Animal model Market Estimates and Forecasts, By End-use (2020-2032) (USD Billion)
10.3.1.10 Rest of Eastern Europe
10.3.1.10.1 Rest of Eastern Europe Animal model Market Estimates and Forecasts, By Animal Type (2020-2032) (USD Billion)
10.3.1.10.2 Rest of Eastern Europe Animal model Market Estimates and Forecasts, By Application (2020-2032) (USD Billion)
10.3.1.10.3 Rest of Eastern Europe Animal model Market Estimates and Forecasts, By End-use (2020-2032) (USD Billion)
10.3.2 Western Europe
10.3.2.1 Trends Analysis
10.3.2.2 Western Europe Animal model Market Estimates and Forecasts, by Country (2020-2032) (USD Billion)
10.3.2.3 Western Europe Animal model Market Estimates and Forecasts, By Animal Type (2020-2032) (USD Billion)
10.3.2.4 Western Europe Animal model Market Estimates and Forecasts, By Application (2020-2032) (USD Billion)
10.3.2.5 Western Europe Animal model Market Estimates and Forecasts, By End-use (2020-2032) (USD Billion)
10.3.2.6 Germany
10.3.2.6.1 Germany Animal model Market Estimates and Forecasts, By Animal Type (2020-2032) (USD Billion)
10.3.2.6.2 Germany Animal model Market Estimates and Forecasts, By Application (2020-2032) (USD Billion)
10.3.2.6.3 Germany Animal model Market Estimates and Forecasts, By End-use (2020-2032) (USD Billion)
10.3.2.7 France
10.3.2.7.1 France Animal model Market Estimates and Forecasts, By Animal Type (2020-2032) (USD Billion)
10.3.2.7.2 France Animal model Market Estimates and Forecasts, By Application (2020-2032) (USD Billion)
10.3.2.7.3 France Animal model Market Estimates and Forecasts, By End-use (2020-2032) (USD Billion)
10.3.2.8 UK
10.3.2.8.1 UK Animal model Market Estimates and Forecasts, By Animal Type (2020-2032) (USD Billion)
10.3.2.8.2 UK Animal model Market Estimates and Forecasts, By Application (2020-2032) (USD Billion)
10.3.2.8.3 UK Animal model Market Estimates and Forecasts, By End-use (2020-2032) (USD Billion)
10.3.2.9 Italy
10.3.2.9.1 Italy Animal model Market Estimates and Forecasts, By Animal Type (2020-2032) (USD Billion)
10.3.2.9.2 Italy Animal model Market Estimates and Forecasts, By Application (2020-2032) (USD Billion)
10.3.2.9.3 Italy Animal model Market Estimates and Forecasts, By End-use (2020-2032) (USD Billion)
10.3.2.10 Spain
10.3.2.10.1 Spain Animal model Market Estimates and Forecasts, By Animal Type (2020-2032) (USD Billion)
10.3.2.10.2 Spain Animal model Market Estimates and Forecasts, By Application (2020-2032) (USD Billion)
10.3.2.10.3 Spain Animal model Market Estimates and Forecasts, By End-use (2020-2032) (USD Billion)
10.3.2.11 Netherlands
10.3.2.11.1 Netherlands Animal model Market Estimates and Forecasts, By Animal Type (2020-2032) (USD Billion)
10.3.2.11.2 Netherlands Animal model Market Estimates and Forecasts, By Application (2020-2032) (USD Billion)
10.3.2.11.3 Netherlands Animal model Market Estimates and Forecasts, By End-use (2020-2032) (USD Billion)
10.3.2.12 Switzerland
10.3.2.12.1 Switzerland Animal model Market Estimates and Forecasts, By Animal Type (2020-2032) (USD Billion)
10.3.2.12.2 Switzerland Animal model Market Estimates and Forecasts, By Application (2020-2032) (USD Billion)
10.3.2.12.3 Switzerland Animal model Market Estimates and Forecasts, By End-use (2020-2032) (USD Billion)
10.3.2.13 Austria
10.3.2.13.1 Austria Animal model Market Estimates and Forecasts, By Animal Type (2020-2032) (USD Billion)
10.3.2.13.2 Austria Animal model Market Estimates and Forecasts, By Application (2020-2032) (USD Billion)
10.3.2.13.3 Austria Animal model Market Estimates and Forecasts, By End-use (2020-2032) (USD Billion)
10.3.2.14 Rest of Western Europe
10.3.2.14.1 Rest of Western Europe Animal model Market Estimates and Forecasts, By Animal Type (2020-2032) (USD Billion)
10.3.2.14.2 Rest of Western Europe Animal model Market Estimates and Forecasts, By Application (2020-2032) (USD Billion)
10.3.2.14.3 Rest of Western Europe Animal model Market Estimates and Forecasts, By End-use (2020-2032) (USD Billion)
10.4 Asia Pacific
10.4.1 Trends Analysis
10.4.2 Asia Pacific Animal model Market Estimates and Forecasts, by Country (2020-2032) (USD Billion)
10.4.3 Asia Pacific Animal model Market Estimates and Forecasts, By Animal Type (2020-2032) (USD Billion)
10.4.4 Asia Pacific Animal model Market Estimates and Forecasts, By Application (2020-2032) (USD Billion)
10.4.5 Asia Pacific Animal model Market Estimates and Forecasts, By End-use (2020-2032) (USD Billion)
10.4.6 China
10.4.6.1 China Animal model Market Estimates and Forecasts, By Animal Type (2020-2032) (USD Billion)
10.4.6.2 China Animal model Market Estimates and Forecasts, By Application (2020-2032) (USD Billion)
10.4.6.3 China Animal model Market Estimates and Forecasts, By End-use (2020-2032) (USD Billion)
10.4.7 India
10.4.7.1 India Animal model Market Estimates and Forecasts, By Animal Type (2020-2032) (USD Billion)
10.4.7.2 India Animal model Market Estimates and Forecasts, By Application (2020-2032) (USD Billion)
10.4.7.3 India Animal model Market Estimates and Forecasts, By End-use (2020-2032) (USD Billion)
10.4.8 Japan
10.4.8.1 Japan Animal model Market Estimates and Forecasts, By Animal Type (2020-2032) (USD Billion)
10.4.8.2 Japan Animal model Market Estimates and Forecasts, By Application (2020-2032) (USD Billion)
10.4.8.3 Japan Animal model Market Estimates and Forecasts, By End-use (2020-2032) (USD Billion)
10.4.9 South Korea
10.4.9.1 South Korea Animal model Market Estimates and Forecasts, By Animal Type (2020-2032) (USD Billion)
10.4.9.2 South Korea Animal model Market Estimates and Forecasts, By Application (2020-2032) (USD Billion)
10.4.9.3 South Korea Animal model Market Estimates and Forecasts, By End-use (2020-2032) (USD Billion)
10.4.10 Vietnam
10.4.10.1 Vietnam Animal model Market Estimates and Forecasts, By Animal Type (2020-2032) (USD Billion)
10.4.10.2 Vietnam Animal model Market Estimates and Forecasts, By Application (2020-2032) (USD Billion)
10.4.10.3 Vietnam Animal model Market Estimates and Forecasts, By End-use (2020-2032) (USD Billion)
10.4.11 Singapore
10.4.11.1 Singapore Animal model Market Estimates and Forecasts, By Animal Type (2020-2032) (USD Billion)
10.4.11.2 Singapore Animal model Market Estimates and Forecasts, By Application (2020-2032) (USD Billion)
10.4.11.3 Singapore Animal model Market Estimates and Forecasts, By End-use (2020-2032) (USD Billion)
10.4.12 Australia
10.4.12.1 Australia Animal model Market Estimates and Forecasts, By Animal Type (2020-2032) (USD Billion)
10.4.12.2 Australia Animal model Market Estimates and Forecasts, By Application (2020-2032) (USD Billion)
10.4.12.3 Australia Animal model Market Estimates and Forecasts, By End-use (2020-2032) (USD Billion)
10.4.13 Rest of Asia Pacific
10.4.13.1 Rest of Asia Pacific Animal model Market Estimates and Forecasts, By Animal Type (2020-2032) (USD Billion)
10.4.13.2 Rest of Asia Pacific Animal model Market Estimates and Forecasts, By Application (2020-2032) (USD Billion)
10.4.13.3 Rest of Asia Pacific Animal model Market Estimates and Forecasts, By End-use (2020-2032) (USD Billion)
10.5 Middle East and Africa
10.5.1 Middle East
10.5.1.1 Trends Analysis
10.5.1.2 Middle East Animal model Market Estimates and Forecasts, by Country (2020-2032) (USD Billion)
10.5.1.3 Middle East Animal model Market Estimates and Forecasts, By Animal Type (2020-2032) (USD Billion)
10.5.1.4 Middle East Animal model Market Estimates and Forecasts, By Application (2020-2032) (USD Billion)
10.5.1.5 Middle East Animal model Market Estimates and Forecasts, By End-use (2020-2032) (USD Billion)
10.5.1.6 UAE
10.5.1.6.1 UAE Animal model Market Estimates and Forecasts, By Animal Type (2020-2032) (USD Billion)
10.5.1.6.2 UAE Animal model Market Estimates and Forecasts, By Application (2020-2032) (USD Billion)
10.5.1.6.3 UAE Animal model Market Estimates and Forecasts, By End-use (2020-2032) (USD Billion)
10.5.1.7 Egypt
10.5.1.7.1 Egypt Animal model Market Estimates and Forecasts, By Animal Type (2020-2032) (USD Billion)
10.5.1.7.2 Egypt Animal model Market Estimates and Forecasts, By Application (2020-2032) (USD Billion)
10.5.1.7.3 Egypt Animal model Market Estimates and Forecasts, By End-use (2020-2032) (USD Billion)
10.5.1.8 Saudi Arabia
10.5.1.8.1 Saudi Arabia Animal model Market Estimates and Forecasts, By Animal Type (2020-2032) (USD Billion)
10.5.1.8.2 Saudi Arabia Animal model Market Estimates and Forecasts, By Application (2020-2032) (USD Billion)
10.5.1.8.3 Saudi Arabia Animal model Market Estimates and Forecasts, By End-use (2020-2032) (USD Billion)
10.5.1.9 Qatar
10.5.1.9.1 Qatar Animal model Market Estimates and Forecasts, By Animal Type (2020-2032) (USD Billion)
10.5.1.9.2 Qatar Animal model Market Estimates and Forecasts, By Application (2020-2032) (USD Billion)
10.5.1.9.3 Qatar Animal model Market Estimates and Forecasts, By End-use (2020-2032) (USD Billion)
10.5.1.10 Rest of Middle East
10.5.1.10.1 Rest of Middle East Animal model Market Estimates and Forecasts, By Animal Type (2020-2032) (USD Billion)
10.5.1.10.2 Rest of Middle East Animal model Market Estimates and Forecasts, By Application (2020-2032) (USD Billion)
10.5.1.10.3 Rest of Middle East Animal model Market Estimates and Forecasts, By End-use (2020-2032) (USD Billion)
10.5.2 Africa
10.5.2.1 Trends Analysis
10.5.2.2 Africa Animal model Market Estimates and Forecasts, by Country (2020-2032) (USD Billion)
10.5.2.3 Africa Animal model Market Estimates and Forecasts, By Animal Type (2020-2032) (USD Billion)
10.5.2.4 Africa Animal model Market Estimates and Forecasts, By Application (2020-2032) (USD Billion)
10.5.2.5 Africa Animal model Market Estimates and Forecasts, By End-use (2020-2032) (USD Billion)
10.5.2.6 South Africa
10.5.2.6.1 South Africa Animal model Market Estimates and Forecasts, By Animal Type (2020-2032) (USD Billion)
10.5.2.6.2 South Africa Animal model Market Estimates and Forecasts, By Application (2020-2032) (USD Billion)
10.5.2.6.3 South Africa Animal model Market Estimates and Forecasts, By End-use (2020-2032) (USD Billion)
10.5.2.7 Nigeria
10.5.2.7.1 Nigeria Animal model Market Estimates and Forecasts, By Animal Type (2020-2032) (USD Billion)
10.5.2.7.2 Nigeria Animal model Market Estimates and Forecasts, By Application (2020-2032) (USD Billion)
10.5.2.7.3 Nigeria Animal model Market Estimates and Forecasts, By End-use (2020-2032) (USD Billion)
10.5.2.8 Rest of Africa
10.5.2.8.1 Rest of Africa Animal model Market Estimates and Forecasts, By Animal Type (2020-2032) (USD Billion)
10.5.2.8.2 Rest of Africa Animal model Market Estimates and Forecasts, By Application (2020-2032) (USD Billion)
10.5.2.8.3 Rest of Africa Animal model Market Estimates and Forecasts, By End-use (2020-2032) (USD Billion)
10.6 Latin America
10.6.1 Trends Analysis
10.6.2 Latin America Animal model Market Estimates and Forecasts, by Country (2020-2032) (USD Billion)
10.6.3 Latin America Animal model Market Estimates and Forecasts, By Animal Type (2020-2032) (USD Billion)
10.6.4 Latin America Animal model Market Estimates and Forecasts, By Application (2020-2032) (USD Billion)
10.6.5 Latin America Animal model Market Estimates and Forecasts, By End-use (2020-2032) (USD Billion)
10.6.6 Brazil
10.6.6.1 Brazil Animal model Market Estimates and Forecasts, By Animal Type (2020-2032) (USD Billion)
10.6.6.2 Brazil Animal model Market Estimates and Forecasts, By Application (2020-2032) (USD Billion)
10.6.6.3 Brazil Animal model Market Estimates and Forecasts, By End-use (2020-2032) (USD Billion)
10.6.7 Argentina
10.6.7.1 Argentina Animal model Market Estimates and Forecasts, By Animal Type (2020-2032) (USD Billion)
10.6.7.2 Argentina Animal model Market Estimates and Forecasts, By Application (2020-2032) (USD Billion)
10.6.7.3 Argentina Animal model Market Estimates and Forecasts, By End-use (2020-2032) (USD Billion)
10.6.8 Colombia
10.6.8.1 Colombia Animal model Market Estimates and Forecasts, By Animal Type (2020-2032) (USD Billion)
10.6.8.2 Colombia Animal model Market Estimates and Forecasts, By Application (2020-2032) (USD Billion)
10.6.8.3 Colombia Animal model Market Estimates and Forecasts, By End-use (2020-2032) (USD Billion)
10.6.9 Rest of Latin America
10.6.9.1 Rest of Latin America Animal model Market Estimates and Forecasts, By Animal Type (2020-2032) (USD Billion)
10.6.9.2 Rest of Latin America Animal model Market Estimates and Forecasts, By Application (2020-2032) (USD Billion)
10.6.9.3 Rest of Latin America Animal model Market Estimates and Forecasts, By End-use (2020-2032) (USD Billion)
11. Company Profiles
11.1 Charles River Laboratories
11.1.1 Company Overview
11.1.2 Financial
11.1.3 Products/ Services Offered
11.1.4 SWOT Analysis
11.2 Envigo
11.2.1 Company Overview
11.2.2 Financial
11.2.3 Products/ Services Offered
11.2.4 SWOT Analysis
11.3 Taconic Biosciences
11.3.1 Company Overview
11.3.2 Financial
11.3.3 Products/ Services Offered
11.3.4 SWOT Analysis
11.4 Harlan Laboratories
11.4.1 Company Overview
11.4.2 Financial
11.4.3 Products/ Services Offered
11.4.4 SWOT Analysis
11.5 Janvier Labs
11.5.1 Company Overview
11.5.2 Financial
11.5.3 Products/ Services Offered
11.5.4 SWOT Analysis
11.6 Shanghai Model Organisms Center
11.6.1 Company Overview
11.6.2 Financial
11.6.3 Products/ Services Offered
11.6.4 SWOT Analysis
11.7 Crown Bioscience
11.7.1 Company Overview
11.7.2 Financial
11.7.3 Products/ Services Offered
11.7.4 SWOT Analysis
11.8 The Jackson Laboratory
11.8.1 Company Overview
11.8.2 Financial
11.8.3 Products/ Services Offered
11.8.4 SWOT Analysis
11.9 BioIVT
11.9.1 Company Overview
11.9.2 Financial
11.9.3 Products/ Services Offered
11.9.4 SWOT Analysis
11.10 Inotiv.
11.10.1 Company Overview
11.10.2 Financial
11.10.3 Products/ Services Offered
11.10.4 SWOT Analysis
12. Use Cases and Best Practices
13. Conclusion
An accurate research report requires proper strategizing as well as implementation. There are multiple factors involved in the completion of good and accurate research report and selecting the best methodology to compete the research is the toughest part. Since the research reports we provide play a crucial role in any company’s decision-making process, therefore we at SNS Insider always believe that we should choose the best method which gives us results closer to reality. This allows us to reach at a stage wherein we can provide our clients best and accurate investment to output ratio.
Each report that we prepare takes a timeframe of 350-400 business hours for production. Starting from the selection of titles through a couple of in-depth brain storming session to the final QC process before uploading our titles on our website we dedicate around 350 working hours. The titles are selected based on their current market cap and the foreseen CAGR and growth.
The 5 steps process:
Step 1: Secondary Research:
Secondary Research or Desk Research is as the name suggests is a research process wherein, we collect data through the readily available information. In this process we use various paid and unpaid databases which our team has access to and gather data through the same. This includes examining of listed companies’ annual reports, Journals, SEC filling etc. Apart from this our team has access to various associations across the globe across different industries. Lastly, we have exchange relationships with various university as well as individual libraries.

Step 2: Primary Research
When we talk about primary research, it is a type of study in which the researchers collect relevant data samples directly, rather than relying on previously collected data. This type of research is focused on gaining content specific facts that can be sued to solve specific problems. Since the collected data is fresh and first hand therefore it makes the study more accurate and genuine.
We at SNS Insider have divided Primary Research into 2 parts.
Part 1 wherein we interview the KOLs of major players as well as the upcoming ones across various geographic regions. This allows us to have their view over the market scenario and acts as an important tool to come closer to the accurate market numbers. As many as 45 paid and unpaid primary interviews are taken from both the demand and supply side of the industry to make sure we land at an accurate judgement and analysis of the market.
This step involves the triangulation of data wherein our team analyses the interview transcripts, online survey responses and observation of on filed participants. The below mentioned chart should give a better understanding of the part 1 of the primary interview.

Part 2: In this part of primary research the data collected via secondary research and the part 1 of the primary research is validated with the interviews from individual consultants and subject matter experts.
Consultants are those set of people who have at least 12 years of experience and expertise within the industry whereas Subject Matter Experts are those with at least 15 years of experience behind their back within the same space. The data with the help of two main processes i.e., FGDs (Focused Group Discussions) and IDs (Individual Discussions). This gives us a 3rd party nonbiased primary view of the market scenario making it a more dependable one while collation of the data pointers.
Step 3: Data Bank Validation
Once all the information is collected via primary and secondary sources, we run that information for data validation. At our intelligence centre our research heads track a lot of information related to the market which includes the quarterly reports, the daily stock prices, and other relevant information. Our data bank server gets updated every fortnight and that is how the information which we collected using our primary and secondary information is revalidated in real time.

Step 4: QA/QC Process
After all the data collection and validation our team does a final level of quality check and quality assurance to get rid of any unwanted or undesired mistakes. This might include but not limited to getting rid of the any typos, duplication of numbers or missing of any important information. The people involved in this process include technical content writers, research heads and graphics people. Once this process is completed the title gets uploader on our platform for our clients to read it.
Step 5: Final QC/QA Process:
This is the last process and comes when the client has ordered the study. In this process a final QA/QC is done before the study is emailed to the client. Since we believe in giving our clients a good experience of our research studies, therefore, to make sure that we do not lack at our end in any way humanly possible we do a final round of quality check and then dispatch the study to the client.
By Animal Type
Mice
Rat
Guinea Pigs
Rabbits
Hamsters
Others
By Application
Cancer
Immunological Disease
Infectious Disease
Others
By End-use
Pharmaceutical & Biotechnology Companies
Academic Research Institute
Contract Research Organization
Request for Segment Customization as per your Business Requirement: Segment Customization Request
REGIONAL COVERAGE:
North America
US
Canada
Mexico
Europe
Eastern Europe
Poland
Romania
Hungary
Turkey
Rest of Eastern Europe
Western Europe
Germany
France
UK
Italy
Spain
Netherlands
Switzerland
Austria
Rest of Western Europe
Asia Pacific
China
India
Japan
South Korea
Vietnam
Singapore
Australia
Rest of Asia Pacific
Middle East & Africa
Middle East
UAE
Egypt
Saudi Arabia
Qatar
Rest of the Middle East
Africa
Nigeria
South Africa
Rest of Africa
Latin America
Brazil
Argentina
Colombia
Rest of Latin America
Request for Country Level Research Report: Country Level Customization Request
Available Customization
With the given market data, SNS Insider offers customization as per the company’s specific needs. The following customization options are available for the report:
Product Analysis
Criss-Cross segment analysis (e.g. Product X Application)
Product Matrix which gives a detailed comparison of product portfolio of each company
Geographic Analysis
Additional countries in any of the regions
Company Information
Detailed analysis and profiling of additional market players (Up to five)
The Injection Pen Market was valued at USD 40.6 billion in 2023 and is projected to reach USD 73.8 billion by 2032, with a growing CAGR of 6.8% from 2024 to 2032.
The Healthcare Quality Management Market Size was valued at USD 3.31 billion in 2023 and is expected to reach USD 10.22 billion by 2032 and grow at a CAGR of 14.18% over the forecast period 2024-2032.
The Drug Discovery Informatics Market Size was surveyed at USD 3.14 billion out of 2023 and is supposed to addition to USD 8.12 billion by 2032, stretching out at a CAGR of 11.16% from 2024 to 2032.
The Wireless Health Market Size was valued at USD 198.7 Billion in 2023 and is expected to reach USD 896.3 Billion by 2032, growing at a CAGR of 18.2% over the forecast period 2024-2032.
The Medical Isotope Market was valued at USD 5.66 billion in 2023 and is expected to reach USD 12.15 billion by 2032, growing at a CAGR of 8.87% over the forecast period 2024-2032.
The Prefilled Syringes Market was valued at USD 7.31 billion in 2023 and is expected to reach USD 21.30 billion by 2032, growing at a CAGR of 12.51% from 2024 to 2032.

Hi! Click one of our member below to chat on Phone
© 2025 All Rights Reserved by SNS Insider Pvt Ltd


