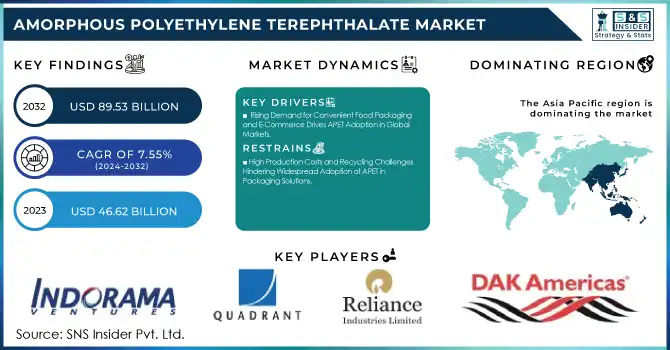
The Amorphous Polyethylene Terephthalate Market was valued at USD 46.62 billion in 2023 and is expected to reach USD 89.53 billion by 2032, growing at a CAGR of 7.55% over the forecast period 2024-2032.
Get More Information on Amorphous Polyethylene Terephthalate Market - Request Sample Report
The amorphous Polyethylene terephthalate market is expanding owing to the versatility of properties and dictation high application. APET is another common type with its excellent clarity, toughness, and recyclability which make it widely used for bottles, films, sheets, and food packaging. These properties make it an ideal packaging material, especially in the food and beverage market, where demand for durability and sustainability is steadily increasing among consumers. A high strength-to-weight ratio in APET benefits increases the demand for APET in pharmaceuticals and consumer goods, which supports the growth of the APET market. APET maintains transparency and still provides barrier protection for products, making it a mainstay of packaging solutions. APET has a recycling rate of 30%, whereby carbon emissions are reduced by 60% through recycling. APET Bottles represent about 45% of bottled beverage packaging in 2023, and recycled APET can save 50% of the energy for producing virgin APET. Moreover, APET recycling helps decrease the energy used in the process by 84% and greenhouse gas emissions by 71%.
The anticipated development in the APET market astounding base is additionally ascribed to a rising accentuation on sustainable and natural foundation materials. Environmental consciousness is at its peak and manufacturers are switching to APET for its recyclability rate which is in line with global standards for lowering plastic waste. There is thus continued demand for APET as an alternative because the growth of regulations to limit single-use plastic and promote recycling is real. Additionally, although the demand for APET would be driven due to urbanization and population growth across the globe, the rise in demand in emerging markets across Asia Pacific and Latin American economies would significantly boost the demand for APET in the forecast period, particularly for food and beverage packaging. In the U.S. the rate increased from 34.2% to 36.8 % for PET bottles. Enhanced collection systems that keep plastic waste out of landfills have been successful, diverting as much as 46% of plastic in California. APET adoption is also supported by the European Union's goal of putting at least 30% recycled content in all packaging by 2030.
KEY DRIVERS:
Rising Demand for Convenient Food Packaging and E-Commerce Drives APET Adoption in Global Markets
The key factor driving demand for Amorphous Polyethylene Terephthalate is high demand for convenience and ready-to-use food packaging. As people are leading busier lives and opting for on-the-go products, the demand for packaging that protects the freshness and quality of the food, while also being user-friendly, is rising. Due to its great sealability, barrier protection, product tightness, and even sturdiness during distribution and storage, APET is a good packaging material for ready-to-eat meals, snacks, and drinks. The changing consumer preference in developed and emerging economies towards pre-packaged and single-served food products is expected to create a high APET market. The increasing trend of e-commerce and home delivery has also boosted the requirement for safe and reliable packaging materials, which is effectively provided by APET. In India and China, more than 40% of packaged foods have switched to single-serving formats, as global demand for ready-to-eat meals and snacks rose by 5-7% per year. The sector of e-commerce food delivery service has gone over 30%, which requires a stable form of packaging to preserve food hygiene like APET to protect during transportation. 25% of global food packaging efforts target sustainable materials in response to consumer preference and regulations
Advancements in APET Film Extrusion and Coating Technologies Drive Market Growth and Industry Adoption
One vital driver is the modernized innovations related to APET, principally top-to-bottom film extrusion and molding procedures. These innovations make for improved product performance, as well as a broader application range. Contemporary manufacturing processes have enabled the manufacture of mechanical strength, minimized APET with clarity, and chemical resistance suitable for a wider range of end-use industries including electronics, automotive, and personal care. In addition, the introduction of APET with custom coatings or multi-layer structures provides improved barrier functionality by blocking moisture, gases, and UV light, which is especially important for the preservation of moisture-sensitive products, such as pharmaceuticals and cosmetics. APET gaining traction in new applications owing to such developments and meeting the changing needs of industries is anticipated to propel market growth. In 2023, 100% recycled content APET, is manufactured in food contact certified by EFSA with available thicknesses from 150 to 1200 microns, allowing to provide custom barrier properties such as moisture, gas, and UV protection. Over 40% of the innovations in packaging are multi-layered, barrier-protected solutions making barrier-coated APET essential for moisture-sensitive products. Similarly, 25-30% of new packaging in categories such as electronics, automotive parts, and personal care is now APET, which is valued for its strength and barrier properties.
RESTRAIN:
High Production Costs and Recycling Challenges Hindering Widespread Adoption of APET in Packaging Solutions
The relatively high production cost of APET in comparison to other common plastics is a major obstacle to its widespread application, particularly in cost-sensitive sectors. Specialized production facilities and energy-intensive production methods increase the cost of manufacturing. This prevents even small and medium enterprises from using APET in their packaging solutions. A second area of difficulty is the minimized recycling capabilities that exist when it comes to the APET in certain areas. APET is recyclable, but built and available recycling facilities and systems are still greatly lacking. Despite its recyclability, environmental concerns can arise from the low levels of collection and recycling programs for APET. Further contamination risk compounds the issue, as waste that contains mixed materials tends to be less easily processed, negating some of the sustainability potential of the material. This could delay the adoption of APET in some markets.
BY APPLICATION
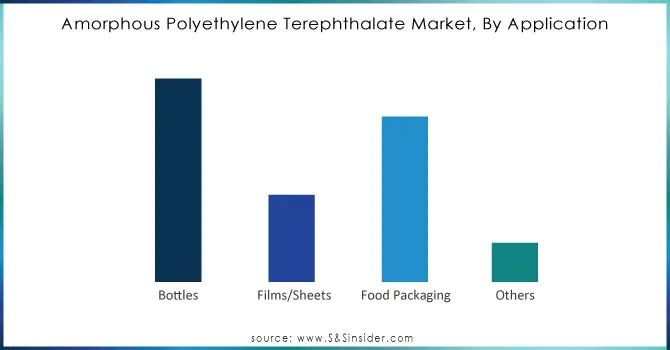
Bottles accounted for the largest revenue share of 47% in 2023, as the terrific properties of APET such as high clarity and strength with good toughness, and easy manufacturing and processing make them useful to be used in various applications. Owing to its lightweight, strength, and cost-effectiveness, APET has become a material of choice for a wide range of bottled products including beverages, personal care, and household products. APET bottles have been dominating the market due to increased demand for packaging solutions that are recyclable, transparent, and sustainable in end-use industries including food & beverage, cosmetics, and cleaning products. In addition, its recyclability meets the increasing global call for lowering plastic waste which strengthens its prominence in the bottle sector
Food packaging will experience the fastest CAGR growth from 2024 to 2032 due to an increase in demand for easy-to-eat, ready-to-eat, and single-meal food products is increasing the demand for reliable packaging materials that preserve food quality and extend shelf life, enabling the convenience of portability. The good barrier properties of APET, such as moisture, oxygen, and UV light barrier make APET a preferred material for fresh, frozen, or processed foods packaging. In addition, APET has recyclability, which makes it a preferable substitute for non-eco-friendly materials as consumers’ awareness of sustainability heightens.
BY END USE
Food & Beverage accounted for a leading market share of 59% in 2023, which APET is an ideal choice due to its high performance in packaging food and drink products. APET gives terrific transparency, which means that products look good and appeal to consumers. The invention is also lightweight, and strong, and provides a high moisture, gas, and UV barrier essential for maintaining the quality, taste, and freshness of food and beverage. In this segment, the rising consumer demand for convenience, on-the-go food products as well as packaged beverages is anticipated to propel APET acceptance. Due to its recyclability, APET is also a suitable choice for food and beverage packaging, as the consumer demand for sustainable and recyclable packaging material continues its grow.
Pharmaceuticals are predicted to register the fastest CAGR during the forecast timespan, 2024 to 2032, owing to the growing demand for safe, tamper-proof & high-performance packaging materials. The high barrier protection of APET from moisture, oxygen, and light makes it suitable for most sensitive pharmaceutical products such as tablets, capsules, and liquids. In addition, the rising need for keeping product integrity, longer shelf life, and regulatory compliance of packaging materials in the pharmaceutical industry will drive the market for APET. Furthermore, as the global healthcare industry is expected to continue expansion, especially in emerging markets, demand for long-term sustainable packaging solutions will remain high, making for the fastest-growing sector in pharmaceutical packaging the APET.
Get Customized Report as per Your Business Requirement - Request For Customized Report
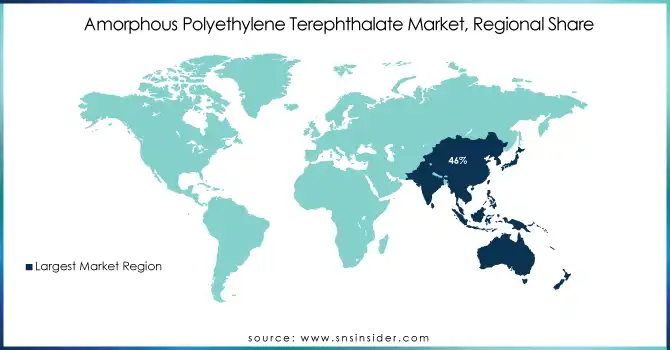
Asia Pacific was the market leader with 46% in 2023 due to the fast industrialization, growing consumption, and development of packaging in the region. The food and beverage sector is seeing growing demand in emerging markets like China and India, which are a major driver of this dominance. APET is widely utilized for job bottled beverages, snacks, and instant meals, for instance, in China. To Meet such customer demand and cough up a Big Bulky to Big Names like Nongfu Sprint (Big Bottled Water Brand), Companies like these rely on APET for its transparency and durability. At the same time, the growth of e-commerce and delivery in the region has multiplied the need for suitable, lightweight packaging, driving the use of APET in food packaging and consumer packaged goods.
North America is projected to experience the fastest CAGR period from 2024 to 2032. The primary factor contributing to this growth is the rising demand for sustainability-based packaging solutions along with the requirement to cut down on plastic use. APET is gaining momentum in food and beverage packaging in the US while brands like Coca-Cola are moving over to APET on its green qualities. The rise of online grocery shopping and meal kit delivery services, including HelloFresh and Blue Apron, is also fuelling demand for APET packaging as these pre-portioned ingredients require protection and freshness while in transit as well. North America is likely to drive the rapidly growing APET market in the upcoming years with its sustainability and recycling initiatives.
Key players
Some of the major players in the Amorphous Polyethylene Terephthalate Market are:
Indorama Ventures (PET resin, ClearGuard™)
Reliance Industries Limited (PET resins, PET films)
Covestro AG (APET sheets, high-performance films)
M&G Chemicals (PET resins, APET films)
LOTTE Chemical Corporation (APET, PET sheets)
JBF Industries Ltd. (PET resins, packaging materials)
PolyQuest (APET films, food-grade PET resins)
Daiwa Can Company (APET, shrink films)
Shijiazhuang Sicong Technology Co. Ltd. (APET resin, recycled PET)
Quadrant AG (APET sheets, PET plastic packaging)
Polisan Holding (PET resins, PET sheets)
Teijin Limited (PET films, automotive materials)
Jiangsu Sanfangxiang (APET resin, packaging materials)
Alpek Polyester (PET resin, APET products)
Evergreen Plastics (APET sheets, PET recycling)
Toray Industries (APET films, plastic sheets)
Jiangsu Zhongtai International (PET resin, APET products)
SABIC (Recycled PET, APET resin)
OCTAL (PET resin, food-grade packaging)
MPI Polyester Industries (APET resin, films for packaging)
Some of the Raw Material Suppliers:
Reliance Industries Limited
M&G Chemicals
Covestro AG
DuPont
BASF
Eastman Chemical Company
SABIC
Indorama Ventures
LG Chem
Toray Industries
RECENT TRENDS
In October 2024, Indorama Ventures partnered with Suntory to launch the world’s first commercial PET bottles made from bio-paraxylene, derived from used cooking oil, marking a significant step in sustainable packaging.
In October 2024, Teijin Frontier launched OCTAIR, a premium insulation fiber for bedding and apparel, designed as an alternative to natural feathers. The company also introduced SOLOTEX OCTAIR, combining PTT fibers and OCTAIR™ for enhanced insulation, now available for global sale.
In November 2024, Covestro strengthened its partnership with Ausell to boost automotive plastics recycling, turning end-of-life vehicle parts into reusable materials. This collaboration supports the shift toward a circular economy.
| Report Attributes | Details |
|---|---|
| Market Size in 2023 | USD 46.62 Billion |
| Market Size by 2032 | USD 89.53 Billion |
| CAGR | CAGR of 7.55% From 2024 to 2032 |
| Base Year | 2023 |
| Forecast Period | 2024-2032 |
| Historical Data | 2020-2022 |
| Report Scope & Coverage | Market Size, Segments Analysis, Competitive Landscape, Regional Analysis, DROC & SWOT Analysis, Forecast Outlook |
| Key Segments | • By Application (Bottles, Films/Sheets, Food Packaging, Others) • By End Use (Food & Beverage, Pharmaceuticals, Others) |
| Regional Analysis/Coverage | North America (US, Canada, Mexico), Europe (Eastern Europe [Poland, Romania, Hungary, Turkey, Rest of Eastern Europe] Western Europe] Germany, France, UK, Italy, Spain, Netherlands, Switzerland, Austria, Rest of Western Europe]), Asia Pacific (China, India, Japan, South Korea, Vietnam, Singapore, Australia, Rest of Asia Pacific), Middle East & Africa (Middle East [UAE, Egypt, Saudi Arabia, Qatar, Rest of Middle East], Africa [Nigeria, South Africa, Rest of Africa], Latin America (Brazil, Argentina, Colombia, Rest of Latin America) |
| Company Profiles | Indorama Ventures, Reliance Industries Limited, Covestro AG, M&G Chemicals, LOTTE Chemical Corporation, JBF Industries Ltd., PolyQuest, Daiwa Can Company, Shijiazhuang Sicong Technology Co. Ltd., Quadrant AG, Polisan Holding, Teijin Limited, Jiangsu Sanfangxiang, Alpek Polyester, Evergreen Plastics, Toray Industries, Jiangsu Zhongtai International, SABIC, OCTAL, MPI Polyester Industries. |
| Key Drivers | • Rising Demand for Convenient Food Packaging and E-Commerce Drives APET Adoption in Global Markets • Advancements in APET Film Extrusion and Coating Technologies Drive Market Growth and Industry Adoption |
| Restraints | • High Production Costs and Recycling Challenges Hindering Widespread Adoption of APET in Packaging Solutions |
Ans: The Amorphous Polyethylene Terephthalate Market is expected to grow at a CAGR of 7.55% during 2024-2032.
Ans: Amorphous Polyethylene Terephthalate Market size was USD 46.62 billion in 2023 and is expected to Reach USD 89.53 billion by 2032.
Ans: The major growth factor of the Amorphous Polyethylene Terephthalate (APET) market is the increasing demand for sustainable, lightweight, and recyclable packaging solutions, particularly in the food and beverage industry.
Ans: The Bottles segment dominated the Amorphous Polyethylene Terephthalate Market in 2023.
Ans: Asia Pacific dominated the Amorphous Polyethylene Terephthalate Market in 2023.
Table of Contents:
1. Introduction
1.1 Market Definition
1.2 Scope (Inclusion and Exclusions)
1.3 Research Assumptions
2. Executive Summary
2.1 Market Overview
2.2 Regional Synopsis
2.3 Competitive Summary
3. Research Methodology
3.1 Top-Down Approach
3.2 Bottom-up Approach
3.3. Data Validation
3.4 Primary Interviews
4. Market Dynamics Impact Analysis
4.1 Market Driving Factors Analysis
4.1.1 Drivers
4.1.2 Restraints
4.1.3 Opportunities
4.1.4 Challenges
4.2 PESTLE Analysis
4.3 Porter’s Five Forces Model
5. Statistical Insights and Trends Reporting
5.1 Amorphous Polyethylene Terephthalate Innovation and Technology Adoption (2023)
5.2 Amorphous Polyethylene Terephthalate Recycling and Sustainability Rates (2023)
5.3 Amorphous Polyethylene Terephthalate Supply Chain Metrics
5.4 Amorphous Polyethylene Terephthalate Environmental Impact
6. Competitive Landscape
6.1 List of Major Companies, By Region
6.2 Market Share Analysis, By Region
6.3 Product Benchmarking
6.3.1 Product specifications and features
6.3.2 Pricing
6.4 Strategic Initiatives
6.4.1 Marketing and promotional activities
6.4.2 Distribution and Supply Chain Strategies
6.4.3 Expansion plans and new product launches
6.4.4 Strategic partnerships and collaborations
6.5 Technological Advancements
6.6 Market Positioning and Branding
7. Amorphous Polyethylene Terephthalate Market Segmentation, By Application
7.1 Chapter Overview
7.2 Bottles
7.2.1 Bottles Market Trends Analysis (2020-2032)
7.2.2 Bottles Market Size Estimates and Forecasts to 2032 (USD Billion)
7.3 Films/Sheets
7.3.1 Films/Sheets Market Trends Analysis (2020-2032)
7.3.2 Films/Sheets Market Size Estimates and Forecasts to 2032 (USD Billion)
7.4 Food Packaging
7.4.1 Food Packaging Market Trends Analysis (2020-2032)
7.4.2 Food Packaging Market Size Estimates and Forecasts to 2032 (USD Billion)
7.5 Others
7.5.1 Others Market Trends Analysis (2020-2032)
7.5.2 Others Market Size Estimates and Forecasts to 2032 (USD Billion)
8. Amorphous Polyethylene Terephthalate Market Segmentation, By End Use
8.1 Chapter Overview
8.2 Food & Beverage
8.2.1 Food & Beverage Market Trends Analysis (2020-2032)
8.2.2 Food & Beverage Market Size Estimates and Forecasts to 2032 (USD Billion)
8.3 Pharmaceuticals
8.3.1 Pharmaceuticals Market Trends Analysis (2020-2032)
8.3.2 Pharmaceuticals Market Size Estimates and Forecasts to 2032 (USD Billion)
8.4 Others
8.4.1 Others Market Trends Analysis (2020-2032)
8.4.2 Others Market Size Estimates and Forecasts to 2032 (USD Billion)
9. Regional Analysis
9.1 Chapter Overview
9.2 North America
9.2.1 Trends Analysis
9.2.2 North America Amorphous Polyethylene Terephthalate Market Estimates and Forecasts, by Country (2020-2032) (USD Billion)
9.2.3 North America Amorphous Polyethylene Terephthalate Market Estimates and Forecasts, By Application (2020-2032) (USD Billion)
9.2.4 North America Amorphous Polyethylene Terephthalate Market Estimates and Forecasts, By End Use (2020-2032) (USD Billion)
9.2.5 USA
9.2.5.1 USA Amorphous Polyethylene Terephthalate Market Estimates and Forecasts, By Application (2020-2032) (USD Billion)
9.2.5.2 USA Amorphous Polyethylene Terephthalate Market Estimates and Forecasts, By End Use (2020-2032) (USD Billion)
9.2.6 Canada
9.2.6.1 Canada Amorphous Polyethylene Terephthalate Market Estimates and Forecasts, By Application (2020-2032) (USD Billion)
9.2.6.2 Canada Amorphous Polyethylene Terephthalate Market Estimates and Forecasts, By End Use (2020-2032) (USD Billion)
9.2.7 Mexico
9.2.7.1 Mexico Amorphous Polyethylene Terephthalate Market Estimates and Forecasts, By Application (2020-2032) (USD Billion)
9.2.7.2 Mexico Amorphous Polyethylene Terephthalate Market Estimates and Forecasts, By End Use (2020-2032) (USD Billion)
9.3 Europe
9.3.1 Eastern Europe
9.3.1.1 Trends Analysis
9.3.1.2 Eastern Europe Amorphous Polyethylene Terephthalate Market Estimates and Forecasts, by Country (2020-2032) (USD Billion)
9.3.1.3 Eastern Europe Amorphous Polyethylene Terephthalate Market Estimates and Forecasts, By Application (2020-2032) (USD Billion)
9.3.1.4 Eastern Europe Amorphous Polyethylene Terephthalate Market Estimates and Forecasts, By End Use (2020-2032) (USD Billion)
9.3.1.5 Poland
9.3.1.5.1 Poland Amorphous Polyethylene Terephthalate Market Estimates and Forecasts, By Application (2020-2032) (USD Billion)
9.3.1.5.2 Poland Amorphous Polyethylene Terephthalate Market Estimates and Forecasts, By End Use (2020-2032) (USD Billion)
9.3.1.6 Romania
9.3.1.6.1 Romania Amorphous Polyethylene Terephthalate Market Estimates and Forecasts, By Application (2020-2032) (USD Billion)
9.3.1.6.2 Romania Amorphous Polyethylene Terephthalate Market Estimates and Forecasts, By End Use (2020-2032) (USD Billion)
9.3.1.7 Hungary
9.3.1.7.1 Hungary Amorphous Polyethylene Terephthalate Market Estimates and Forecasts, By Application (2020-2032) (USD Billion)
9.3.1.7.2 Hungary Amorphous Polyethylene Terephthalate Market Estimates and Forecasts, By End Use (2020-2032) (USD Billion)
9.3.1.8 turkey
9.3.1.8.1 Turkey Amorphous Polyethylene Terephthalate Market Estimates and Forecasts, By Application (2020-2032) (USD Billion)
9.3.1.8.2 Turkey Amorphous Polyethylene Terephthalate Market Estimates and Forecasts, By End Use (2020-2032) (USD Billion)
9.3.1.9 Rest of Eastern Europe
9.3.1.9.1 Rest of Eastern Europe Amorphous Polyethylene Terephthalate Market Estimates and Forecasts, By Application (2020-2032) (USD Billion)
9.3.1.9.2 Rest of Eastern Europe Amorphous Polyethylene Terephthalate Market Estimates and Forecasts, By End Use (2020-2032) (USD Billion)
9.3.2 Western Europe
9.3.2.1 Trends Analysis
9.3.2.2 Western Europe Amorphous Polyethylene Terephthalate Market Estimates and Forecasts, by Country (2020-2032) (USD Billion)
9.3.2.3 Western Europe Amorphous Polyethylene Terephthalate Market Estimates and Forecasts, By Application (2020-2032) (USD Billion)
9.3.2.4 Western Europe Amorphous Polyethylene Terephthalate Market Estimates and Forecasts, By End Use (2020-2032) (USD Billion)
9.3.2.5 Germany
9.3.2.5.1 Germany Amorphous Polyethylene Terephthalate Market Estimates and Forecasts, By Application (2020-2032) (USD Billion)
9.3.2.5.2 Germany Amorphous Polyethylene Terephthalate Market Estimates and Forecasts, By End Use (2020-2032) (USD Billion)
9.3.2.6 France
9.3.2.6.1 France Amorphous Polyethylene Terephthalate Market Estimates and Forecasts, By Application (2020-2032) (USD Billion)
9.3.2.6.2 France Amorphous Polyethylene Terephthalate Market Estimates and Forecasts, By End Use (2020-2032) (USD Billion)
9.3.2.7 UK
9.3.2.7.1 UK Amorphous Polyethylene Terephthalate Market Estimates and Forecasts, By Application (2020-2032) (USD Billion)
9.3.2.7.2 UK Amorphous Polyethylene Terephthalate Market Estimates and Forecasts, By End Use (2020-2032) (USD Billion)
9.3.2.8 Italy
9.3.2.8.1 Italy Amorphous Polyethylene Terephthalate Market Estimates and Forecasts, By Application (2020-2032) (USD Billion)
9.3.2.8.2 Italy Amorphous Polyethylene Terephthalate Market Estimates and Forecasts, By End Use (2020-2032) (USD Billion)
9.3.2.9 Spain
9.3.2.9.1 Spain Amorphous Polyethylene Terephthalate Market Estimates and Forecasts, By Application (2020-2032) (USD Billion)
9.3.2.9.2 Spain Amorphous Polyethylene Terephthalate Market Estimates and Forecasts, By End Use (2020-2032) (USD Billion)
9.3.2.10 Netherlands
9.3.2.10.1 Netherlands Amorphous Polyethylene Terephthalate Market Estimates and Forecasts, By Application (2020-2032) (USD Billion)
9.3.2.10.2 Netherlands Amorphous Polyethylene Terephthalate Market Estimates and Forecasts, By End Use (2020-2032) (USD Billion)
9.3.2.11 Switzerland
9.3.2.11.1 Switzerland Amorphous Polyethylene Terephthalate Market Estimates and Forecasts, By Application (2020-2032) (USD Billion)
9.3.2.11.2 Switzerland Amorphous Polyethylene Terephthalate Market Estimates and Forecasts, By End Use (2020-2032) (USD Billion)
9.3.2.12 Austria
9.3.2.12.1 Austria Amorphous Polyethylene Terephthalate Market Estimates and Forecasts, By Application (2020-2032) (USD Billion)
9.3.2.12.2 Austria Amorphous Polyethylene Terephthalate Market Estimates and Forecasts, By End Use (2020-2032) (USD Billion)
9.3.2.13 Rest of Western Europe
9.3.2.13.1 Rest of Western Europe Amorphous Polyethylene Terephthalate Market Estimates and Forecasts, By Application (2020-2032) (USD Billion)
9.3.2.13.2 Rest of Western Europe Amorphous Polyethylene Terephthalate Market Estimates and Forecasts, By End Use (2020-2032) (USD Billion)
9.4 Asia Pacific
9.4.1 Trends Analysis
9.4.2 Asia Pacific Amorphous Polyethylene Terephthalate Market Estimates and Forecasts, by Country (2020-2032) (USD Billion)
9.4.3 Asia Pacific Amorphous Polyethylene Terephthalate Market Estimates and Forecasts, By Application (2020-2032) (USD Billion)
9.4.4 Asia Pacific Amorphous Polyethylene Terephthalate Market Estimates and Forecasts, By End Use (2020-2032) (USD Billion)
9.4.5 China
9.4.5.1 China Amorphous Polyethylene Terephthalate Market Estimates and Forecasts, By Application (2020-2032) (USD Billion)
9.4.5.2 China Amorphous Polyethylene Terephthalate Market Estimates and Forecasts, By End Use (2020-2032) (USD Billion)
9.4.6 India
9.4.5.1 India Amorphous Polyethylene Terephthalate Market Estimates and Forecasts, By Application (2020-2032) (USD Billion)
9.4.5.2 India Amorphous Polyethylene Terephthalate Market Estimates and Forecasts, By End Use (2020-2032) (USD Billion)
9.4.5 japan
9.4.5.1 Japan Amorphous Polyethylene Terephthalate Market Estimates and Forecasts, By Application (2020-2032) (USD Billion)
9.4.5.2 Japan Amorphous Polyethylene Terephthalate Market Estimates and Forecasts, By End Use (2020-2032) (USD Billion)
9.4.6 South Korea
9.4.6.1 South Korea Amorphous Polyethylene Terephthalate Market Estimates and Forecasts, By Application (2020-2032) (USD Billion)
9.4.6.2 South Korea Amorphous Polyethylene Terephthalate Market Estimates and Forecasts, By End Use (2020-2032) (USD Billion)
9.4.7 Vietnam
9.4.7.1 Vietnam Amorphous Polyethylene Terephthalate Market Estimates and Forecasts, By Application (2020-2032) (USD Billion)
9.2.7.2 Vietnam Amorphous Polyethylene Terephthalate Market Estimates and Forecasts, By End Use (2020-2032) (USD Billion)
9.4.8 Singapore
9.4.8.1 Singapore Amorphous Polyethylene Terephthalate Market Estimates and Forecasts, By Application (2020-2032) (USD Billion)
9.4.8.2 Singapore Amorphous Polyethylene Terephthalate Market Estimates and Forecasts, By End Use (2020-2032) (USD Billion)
9.4.9 Australia
9.4.9.1 Australia Amorphous Polyethylene Terephthalate Market Estimates and Forecasts, By Application (2020-2032) (USD Billion)
9.4.9.2 Australia Amorphous Polyethylene Terephthalate Market Estimates and Forecasts, By End Use (2020-2032) (USD Billion)
9.4.10 Rest of Asia Pacific
9.4.10.1 Rest of Asia Pacific Amorphous Polyethylene Terephthalate Market Estimates and Forecasts, By Application (2020-2032) (USD Billion)
9.4.10.2 Rest of Asia Pacific Amorphous Polyethylene Terephthalate Market Estimates and Forecasts, By End Use (2020-2032) (USD Billion)
9.5 Middle East and Africa
9.5.1 Middle East
9.5.1.1 Trends Analysis
9.5.1.2 Middle East Amorphous Polyethylene Terephthalate Market Estimates and Forecasts, by Country (2020-2032) (USD Billion)
9.5.1.3 Middle East Amorphous Polyethylene Terephthalate Market Estimates and Forecasts, By Application (2020-2032) (USD Billion)
9.5.1.4 Middle East Amorphous Polyethylene Terephthalate Market Estimates and Forecasts, By End Use (2020-2032) (USD Billion)
9.5.1.5 UAE
9.5.1.5.1 UAE Amorphous Polyethylene Terephthalate Market Estimates and Forecasts, By Application (2020-2032) (USD Billion)
9.5.1.5.2 UAE Amorphous Polyethylene Terephthalate Market Estimates and Forecasts, By End Use (2020-2032) (USD Billion)
9.5.1.6 Egypt
9.5.1.6.1 Egypt Amorphous Polyethylene Terephthalate Market Estimates and Forecasts, By Application (2020-2032) (USD Billion)
9.5.1.6.2 Egypt Amorphous Polyethylene Terephthalate Market Estimates and Forecasts, By End Use (2020-2032) (USD Billion)
9.5.1.7 Saudi Arabia
9.5.1.7.1 Saudi Arabia Amorphous Polyethylene Terephthalate Market Estimates and Forecasts, By Application (2020-2032) (USD Billion)
9.5.1.7.2 Saudi Arabia Amorphous Polyethylene Terephthalate Market Estimates and Forecasts, By End Use (2020-2032) (USD Billion)
9.5.1.8 Qatar
9.5.1.8.1 Qatar Amorphous Polyethylene Terephthalate Market Estimates and Forecasts, By Application (2020-2032) (USD Billion)
9.5.1.8.2 Qatar Amorphous Polyethylene Terephthalate Market Estimates and Forecasts, By End Use (2020-2032) (USD Billion)
9.5.1.9 Rest of Middle East
9.5.1.9.1 Rest of Middle East Amorphous Polyethylene Terephthalate Market Estimates and Forecasts, By Application (2020-2032) (USD Billion)
9.5.1.9.2 Rest of Middle East Amorphous Polyethylene Terephthalate Market Estimates and Forecasts, By End Use (2020-2032) (USD Billion)
9.5.2 Africa
9.5.2.1 Trends Analysis
9.5.2.2 Africa Amorphous Polyethylene Terephthalate Market Estimates and Forecasts, by Country (2020-2032) (USD Billion)
9.5.2.3 Africa Amorphous Polyethylene Terephthalate Market Estimates and Forecasts, By Application (2020-2032) (USD Billion)
9.5.2.4 Africa Amorphous Polyethylene Terephthalate Market Estimates and Forecasts, By End Use (2020-2032) (USD Billion)
9.5.2.5 South Africa
9.5.2.5.1 South Africa Amorphous Polyethylene Terephthalate Market Estimates and Forecasts, By Application (2020-2032) (USD Billion)
9.5.2.5.2 South Africa Amorphous Polyethylene Terephthalate Market Estimates and Forecasts, By End Use (2020-2032) (USD Billion)
9.5.2.6 Nigeria
9.5.2.6.1 Nigeria Amorphous Polyethylene Terephthalate Market Estimates and Forecasts, By Application (2020-2032) (USD Billion)
9.5.2.6.2 Nigeria Amorphous Polyethylene Terephthalate Market Estimates and Forecasts, By End Use (2020-2032) (USD Billion)
9.5.2.7 Rest of Africa
9.5.2.7.1 Rest of Africa Amorphous Polyethylene Terephthalate Market Estimates and Forecasts, By Application (2020-2032) (USD Billion)
9.5.2.7.2 Rest of Africa Amorphous Polyethylene Terephthalate Market Estimates and Forecasts, By End Use (2020-2032) (USD Billion)
9.6 Latin America
9.6.1 Trends Analysis
9.6.2 Latin America Amorphous Polyethylene Terephthalate Market Estimates and Forecasts, by Country (2020-2032) (USD Billion)
9.6.3 Latin America Amorphous Polyethylene Terephthalate Market Estimates and Forecasts, By Application (2020-2032) (USD Billion)
9.6.4 Latin America Amorphous Polyethylene Terephthalate Market Estimates and Forecasts, By End Use (2020-2032) (USD Billion)
9.6.5 brazil
9.6.5.1 Brazil Amorphous Polyethylene Terephthalate Market Estimates and Forecasts, By Application (2020-2032) (USD Billion)
9.6.5.2 Brazil Amorphous Polyethylene Terephthalate Market Estimates and Forecasts, By End Use (2020-2032) (USD Billion)
9.6.6 Argentina
9.6.6.1 Argentina Amorphous Polyethylene Terephthalate Market Estimates and Forecasts, By Application (2020-2032) (USD Billion)
9.6.6.2 Argentina Amorphous Polyethylene Terephthalate Market Estimates and Forecasts, By End Use (2020-2032) (USD Billion)
9.6.7 Colombia
9.6.7.1 Colombia Amorphous Polyethylene Terephthalate Market Estimates and Forecasts, By Application (2020-2032) (USD Billion)
9.6.7.2 Colombia Amorphous Polyethylene Terephthalate Market Estimates and Forecasts, By End Use (2020-2032) (USD Billion)
9.6.8 Rest of Latin America
9.6.8.1 Rest of Latin America Amorphous Polyethylene Terephthalate Market Estimates and Forecasts, By Application (2020-2032) (USD Billion)
9.6.8.2 Rest of Latin America Amorphous Polyethylene Terephthalate Market Estimates and Forecasts, By End Use (2020-2032) (USD Billion)
10. Company Profiles
10.1 Indorama Ventures
10.1.1 Company Overview
10.1.2 Financial
10.1.3 Products/ Services Offered
110.1.4 SWOT Analysis
10.2 Reliance Industries Limited
10.2.1 Company Overview
10.2.2 Financial
10.2.3 Products/ Services Offered
10.2.4 SWOT Analysis
10.3 Covestro AG
10.3.1 Company Overview
10.3.2 Financial
10.3.3 Products/ Services Offered
10.3.4 SWOT Analysis
10.4 M&G Chemicals
10.4.1 Company Overview
10.4.2 Financial
10.4.3 Products/ Services Offered
10.4.4 SWOT Analysis
10.5 LOTTE Chemical Corporation
10.5.1 Company Overview
10.5.2 Financial
10.5.3 Products/ Services Offered
10.5.4 SWOT Analysis
10.6 JBF Industries Ltd
10.6.1 Company Overview
10.6.2 Financial
10.6.3 Products/ Services Offered
10.6.4 SWOT Analysis
10.7 PolyQuest
10.7.1 Company Overview
10.7.2 Financial
10.7.3 Products/ Services Offered
10.7.4 SWOT Analysis
10.8 Daiwa Can Company
10.8.1 Company Overview
10.8.2 Financial
10.8.3 Products/ Services Offered
10.8.4 SWOT Analysis
10.9 Quadrant AG
10.9.1 Company Overview
10.9.2 Financial
10.9.3 Products/ Services Offered
10.9.4 SWOT Analysis
10.10 Polisan Holding
10.9.1 Company Overview
10.9.2 Financial
10.9.3 Products/ Services Offered
10.9.4 SWOT Analysis
11. Use Cases and Best Practices
12. Conclusion
An accurate research report requires proper strategizing as well as implementation. There are multiple factors involved in the completion of good and accurate research report and selecting the best methodology to compete the research is the toughest part. Since the research reports we provide play a crucial role in any company’s decision-making process, therefore we at SNS Insider always believe that we should choose the best method which gives us results closer to reality. This allows us to reach at a stage wherein we can provide our clients best and accurate investment to output ratio.
Each report that we prepare takes a timeframe of 350-400 business hours for production. Starting from the selection of titles through a couple of in-depth brain storming session to the final QC process before uploading our titles on our website we dedicate around 350 working hours. The titles are selected based on their current market cap and the foreseen CAGR and growth.
The 5 steps process:
Step 1: Secondary Research:
Secondary Research or Desk Research is as the name suggests is a research process wherein, we collect data through the readily available information. In this process we use various paid and unpaid databases which our team has access to and gather data through the same. This includes examining of listed companies’ annual reports, Journals, SEC filling etc. Apart from this our team has access to various associations across the globe across different industries. Lastly, we have exchange relationships with various university as well as individual libraries.

Step 2: Primary Research
When we talk about primary research, it is a type of study in which the researchers collect relevant data samples directly, rather than relying on previously collected data. This type of research is focused on gaining content specific facts that can be sued to solve specific problems. Since the collected data is fresh and first hand therefore it makes the study more accurate and genuine.
We at SNS Insider have divided Primary Research into 2 parts.
Part 1 wherein we interview the KOLs of major players as well as the upcoming ones across various geographic regions. This allows us to have their view over the market scenario and acts as an important tool to come closer to the accurate market numbers. As many as 45 paid and unpaid primary interviews are taken from both the demand and supply side of the industry to make sure we land at an accurate judgement and analysis of the market.
This step involves the triangulation of data wherein our team analyses the interview transcripts, online survey responses and observation of on filed participants. The below mentioned chart should give a better understanding of the part 1 of the primary interview.

Part 2: In this part of primary research the data collected via secondary research and the part 1 of the primary research is validated with the interviews from individual consultants and subject matter experts.
Consultants are those set of people who have at least 12 years of experience and expertise within the industry whereas Subject Matter Experts are those with at least 15 years of experience behind their back within the same space. The data with the help of two main processes i.e., FGDs (Focused Group Discussions) and IDs (Individual Discussions). This gives us a 3rd party nonbiased primary view of the market scenario making it a more dependable one while collation of the data pointers.
Step 3: Data Bank Validation
Once all the information is collected via primary and secondary sources, we run that information for data validation. At our intelligence centre our research heads track a lot of information related to the market which includes the quarterly reports, the daily stock prices, and other relevant information. Our data bank server gets updated every fortnight and that is how the information which we collected using our primary and secondary information is revalidated in real time.

Step 4: QA/QC Process
After all the data collection and validation our team does a final level of quality check and quality assurance to get rid of any unwanted or undesired mistakes. This might include but not limited to getting rid of the any typos, duplication of numbers or missing of any important information. The people involved in this process include technical content writers, research heads and graphics people. Once this process is completed the title gets uploader on our platform for our clients to read it.
Step 5: Final QC/QA Process:
This is the last process and comes when the client has ordered the study. In this process a final QA/QC is done before the study is emailed to the client. Since we believe in giving our clients a good experience of our research studies, therefore, to make sure that we do not lack at our end in any way humanly possible we do a final round of quality check and then dispatch the study to the client.
Key Segments:
By Application
Bottles
Films/Sheets
Food Packaging
Others
By End Use
Food & Beverage
Pharmaceuticals
Others
Request for Segment Customization as per your Business Requirement: Segment Customization Request
REGIONAL COVERAGE:
North America
US
Canada
Mexico
Europe
Eastern Europe
Poland
Romania
Hungary
Turkey
Rest of Eastern Europe
Western Europe
Germany
France
UK
Italy
Spain
Netherlands
Switzerland
Austria
Rest of Western Europe
Asia Pacific
China
India
Japan
South Korea
Vietnam
Singapore
Australia
Rest of Asia Pacific
Middle East & Africa
Middle East
UAE
Egypt
Saudi Arabia
Qatar
Rest of the Middle East
Africa
Nigeria
South Africa
Rest of Africa
Latin America
Brazil
Argentina
Colombia
Rest of Latin America
Request for Country Level Research Report: Country Level Customization Request
Available Customization
With the given market data, SNS Insider offers customization as per the company’s specific needs. The following customization options are available for the report:
Product Analysis
Criss-Cross segment analysis (e.g. Product X Application)
Product Matrix which gives a detailed comparison of the product portfolio of each company
Geographic Analysis
Additional countries in any of the regions
Company Information
Detailed analysis and profiling of additional market players (Up to five)
The Alkyl Polyglucosides Market size was valued at USD 1.1 Billion in 2023. It is expected to grow to USD 1.9 Billion by 2032 and grow at a CAGR of 6.5% over the forecast period of 2024-2032.
The Reclaimed Rubber Market Size was valued at USD 1.2 Billion in 2023 and will reach USD 3.1 Billion by 2032 and grow at a CAGR of 11.2% by 2024-2032.
The Antimicrobial Additives Market Size was valued at USD 3.24 billion in 2023 and is expected to reach USD 6.86 billion by 2032 and grow at a CAGR of 9.20% over the forecast period 2024-2032.
Acetaldehyde market size was USD 1.92 Billion in 2023 and is expected to reach USD 3.04 Billion by 2032, growing at a CAGR of 5.91 % from 2024 to 2032.
The Hydrophilic Coating Market Size was valued at USD 16.59 Billion in 2023 and is expected to reach USD 27.23 Billion by 2032, growing at a CAGR of 5.66% over the forecast period of 2024-2032.
The Phosphate Fertilizer Market size was USD 66.86 billion in 2023 and is expected to reach USD 111.93 billion by 2032 and grow at a CAGR of 5.89% over the forecast period of 2024-2032.

Hi! Click one of our member below to chat on Phone
© 2025 All Rights Reserved by SNS Insider Pvt Ltd


