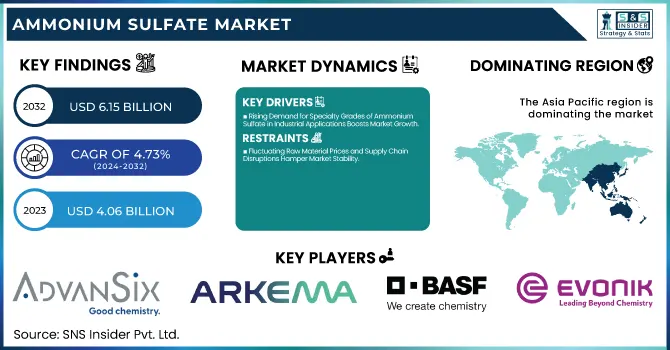
The Ammonium Sulfate Market Size was valued at USD 4.06 Billion in 2023 and is expected to reach USD 6.15 Billion by 2032, growing at a CAGR of 4.73% over the forecast period of 2024-2032.
To Get more information on Ammonium Sulfate Markett - Request Free Sample Report
The Ammonium Sulfate Market is driven by its widespread use in fertilizers, water treatment, and industrial applications. Our report explores the cost structure, analyzing raw material, energy, and labor expenses shaping production economics. Strategic investment and ROI analysis highlight capital requirements and profitability trends. Regulatory compliance is crucial, with international quality and safety standards like REACH and EPA regulations impacting trade. Understanding consumer perception and buying behavior reveals shifting demand in agriculture and industry. Additionally, competition from substitutes challenges market growth, making adoption rates of alternative products a key factor. Our research provides exclusive insights into these elements, offering a comprehensive view of the ammonium sulfate industry’s evolving landscape.
Drivers
Rising Demand for Specialty Grades of Ammonium Sulfate in Industrial Applications Boosts Market Growth
Ammonium sulfate is no longer confined to its traditional role in agriculture; it is increasingly gaining prominence in industrial applications, including pharmaceuticals, food additives, and water treatment. The growing demand for high-purity ammonium sulfate grades in these sectors is creating new growth opportunities for manufacturers. In the pharmaceutical industry, ammonium sulfate is widely used as a stabilizing agent in drug formulations and vaccine production, driving demand for ultrapure variants. Similarly, in the food industry, ammonium sulfate serves as a dough conditioner and food preservative, requiring compliance with stringent safety standards. Another significant application is in wastewater treatment, where ammonium sulfate acts as a coagulation agent, aiding in the removal of impurities from industrial effluents. With increasing environmental regulations mandating effective water purification solutions, the role of ammonium sulfate in industrial water treatment is expanding. Manufacturers are now investing in advanced purification techniques to cater to industries with strict quality requirements, further fueling market growth. As industries seek reliable and high-performance chemical solutions, ammonium sulfate’s diverse industrial applications are set to drive sustained market expansion.
Restraints
Fluctuating Raw Material Prices and Supply Chain Disruptions Hamper Market Stability
The ammonium sulfate market is highly dependent on the stability of raw material supply and production costs, making it vulnerable to price fluctuations and supply chain disruptions. Since ammonium sulfate is primarily produced as a byproduct of caprolactam manufacturing, any variations in the demand or supply of caprolactam directly impact ammonium sulfate availability. Additionally, raw materials such as ammonia and sulfuric acid experience frequent price volatility due to changing global demand, geopolitical tensions, and disruptions in the chemical industry. Supply chain inefficiencies, such as transportation constraints and trade restrictions, further exacerbate the challenge of maintaining a steady ammonium sulfate supply. The COVID-19 pandemic and other economic disruptions have highlighted vulnerabilities in the global supply chain, leading to unpredictable market conditions. These uncertainties make it difficult for manufacturers to maintain consistent pricing strategies, affecting profit margins. To address these challenges, companies are exploring alternative production methods and securing long-term supply contracts, but the inherent volatility in raw material prices remains a significant restraint for the ammonium sulfate market.
Opportunities
Emerging Applications of Ammonium Sulfate in Battery Technologies Drive Future Market Growth
As the demand for advanced energy storage solutions rises, researchers are exploring new applications of ammonium sulfate in battery technologies. Recent studies indicate that ammonium sulfate can enhance electrolyte stability in lithium-sulfur and flow battery systems, improving battery efficiency and lifespan. With the global push toward renewable energy and electric vehicles, the need for cost-effective and high-performance battery materials is growing rapidly. Companies involved in battery research and development are testing ammonium sulfate as a potential component in next-generation energy storage solutions. Collaborations between chemical manufacturers and battery technology firms are expected to accelerate innovation in this space. The shift toward alternative battery chemistries that reduce reliance on scarce or expensive materials is also driving interest in ammonium sulfate-based solutions. If successfully integrated into commercial battery systems, this application could open new revenue streams for ammonium sulfate manufacturers. As the energy storage market expands, ammonium sulfate’s role in battery technologies presents a promising opportunity for future market growth.
Challenge
Limited Awareness and Adoption of Specialty Ammonium Sulfate Grades in Emerging Markets
Despite the increasing demand for high-purity ammonium sulfate, many developing regions still rely on conventional fertilizers and basic industrial chemicals. Awareness of specialty ammonium sulfate grades remains low among small-scale farmers and industrial users, limiting adoption. Additionally, inadequate infrastructure for specialty chemical distribution makes it challenging to supply advanced ammonium sulfate formulations to emerging markets. The high cost of specialty grades also deters price-sensitive consumers, reducing their accessibility. Companies must invest in educational initiatives, training programs, and marketing campaigns to increase awareness of specialty ammonium sulfate benefits. Strategic partnerships with local distributors and agricultural cooperatives can help improve market penetration. Overcoming these barriers will require long-term efforts to enhance product visibility, accessibility, and affordability in emerging economies.
By Form
Solid ammonium sulfate dominated the ammonium sulfate market in 2023 with a 78.5% market share. The dominance of solid ammonium sulfate is driven by its cost-effectiveness, ease of handling, and long shelf life compared to liquid alternatives. Solid ammonium sulfate is widely used in agriculture as a nitrogen and sulfur fertilizer, particularly in large-scale farming across Asia-Pacific, Europe, and North America. According to the International Fertilizer Association (IFA), global nitrogen fertilizer demand increased in 2023, with ammonium sulfate being a key component in crop nutrition. The U.S. Department of Agriculture (USDA) has also promoted the use of ammonium sulfate in precision farming, further driving its demand. Additionally, major fertilizer producers such as Nutrien and Gujarat State Fertilizers & Chemicals Limited have expanded their production of solid ammonium sulfate to meet rising agricultural needs, reinforcing its dominant position in the market.
By Production Process
The caprolactam byproduct process dominated the ammonium sulfate market in 2023 with a 62% market share. This method remains the most widely used due to its cost-efficiency and sustainability, as it utilizes ammonium sulfate as a byproduct of caprolactam production, reducing industrial waste. Major manufacturers such as BASF, Fibrant, and Sumitomo Chemical rely on this process to produce ammonium sulfate, ensuring consistent supply and cost-effectiveness. According to the European Chemical Industry Council (CEFIC), caprolactam production has expanded in key markets such as China, Europe, and North America, further supporting the dominance of this production method. Additionally, environmental regulations promoting circular economy practices, such as the European Union’s Green Deal, have encouraged companies to maximize the utilization of industrial byproducts, reinforcing the widespread adoption of this process in the ammonium sulfate market.
By Application
Fertilizers dominated the ammonium sulfate market in 2023 with a 75.4% market share. The agricultural sector heavily relies on ammonium sulfate as a nitrogen and sulfur-based fertilizer to enhance soil fertility and crop yields. According to the Food and Agriculture Organization (FAO), the demand for fertilizers grew steadily in 2023, particularly in countries like China, India, and Brazil, where ammonium sulfate is widely used in rice, corn, and wheat cultivation. Governments worldwide, including China’s Ministry of Agriculture and Rural Affairs, have implemented subsidies and soil improvement programs that encourage farmers to adopt ammonium sulfate-based fertilizers. Additionally, companies such as Nutrien and OCI Global have increased their production capacity to cater to the growing demand from the agricultural sector. With rising global food production needs and the importance of soil nutrient management, ammonium sulfate continues to be the preferred fertilizer choice, solidifying its dominant position in the market.
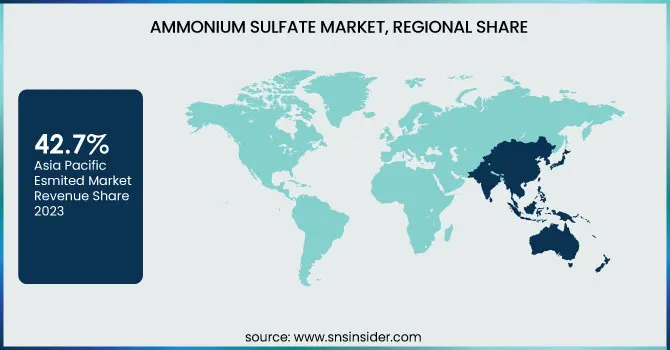
Asia Pacific dominated the ammonium sulfate market in 2023 with an estimated market share of 42.7%. The region's dominance is primarily driven by the high consumption of ammonium sulfate in the agricultural sector, especially in countries like China, India, and Indonesia, where large-scale farming requires nitrogen and sulfur fertilizers to enhance crop yields. According to the Food and Agriculture Organization (FAO), China alone accounted for nearly 30% of global fertilizer consumption in 2023, with ammonium sulfate playing a key role in rice and wheat cultivation. India, supported by government initiatives such as the Pradhan Mantri Kisan Samman Nidhi (PM-KISAN) and fertilizer subsidies, has witnessed significant demand for ammonium sulfate-based fertilizers. Indonesia, a major palm oil producer, also relies on ammonium sulfate for improving oil palm yield. Additionally, major manufacturers such as OCI Global and SINOPEC CORP. have expanded their production facilities in the region to meet the growing demand. The presence of cost-effective production methods, abundant raw material availability, and favorable government policies further solidify Asia Pacific’s leading position in the ammonium sulfate market.
On the other hand, Europe emerged as the fastest-growing region in the ammonium sulfate market, with a significant growth rate during the forecast period. The region’s rapid growth is attributed to increasing adoption of ammonium sulfate for sustainable farming practices and strict environmental regulations that promote its use as an eco-friendly fertilizer. The European Union’s Common Agricultural Policy (CAP) has encouraged farmers to utilize ammonium sulfate to enhance soil fertility while reducing nitrogen losses. Germany, the largest agricultural producer in Europe, has witnessed a rising preference for ammonium sulfate due to government-backed incentives for sulfur-based fertilizers. France, another key market, has seen an upsurge in ammonium sulfate demand for vineyards and wheat farming, supported by subsidies under the EU Green Deal. The Netherlands, a major hub for chemical industries, has also increased ammonium sulfate production through companies such as BASF and DSM. With growing demand for sustainable fertilizers and government regulations favoring ammonium sulfate usage, Europe is poised to experience significant market growth.
Get Customized Report as per Your Business Requirement - Enquiry Now
Key Players
AdvanSix
BASF SE
DOMO Chemicals
Evonik Industries AG
Fibrant
Gujarat State Fertilizers & Chemicals Limited
Helm AG
LANXESS
Merck KGaA
Nutrien
OCI Global
OSTCHEM
SINOPEC CORP.
Sumitomo Chemical Co., Ltd.
UBE Corporation
Vinipul Inorganics Pvt. Ltd.
ArcelorMittal SA
| Report Attributes | Details |
|---|---|
| Market Size in 2023 | USD 4.06 Billion |
| Market Size by 2032 | USD 6.15 Billion |
| CAGR | CAGR of 4.73% From 2024 to 2032 |
| Base Year | 2023 |
| Forecast Period | 2024-2032 |
| Historical Data | 2020-2022 |
| Report Scope & Coverage | Market Size, Segments Analysis, Competitive Landscape, Regional Analysis, DROC & SWOT Analysis, Forecast Outlook |
| Key Segments | •By Form (Solid, Liquid) •By Production Process (Caprolactam Byproduct Process, Coke Oven Gas Process, Gypsum Conversion Process, Neutralization Process) •By Application (Fertilizers, Pharmaceuticals, Food & Feed Additive, Water Treatment, Others) |
| Regional Analysis/Coverage | North America (US, Canada, Mexico), Europe (Eastern Europe [Poland, Romania, Hungary, Turkey, Rest of Eastern Europe] Western Europe] Germany, France, UK, Italy, Spain, Netherlands, Switzerland, Austria, Rest of Western Europe]), Asia Pacific (China, India, Japan, South Korea, Vietnam, Singapore, Australia, Rest of Asia Pacific), Middle East & Africa (Middle East [UAE, Egypt, Saudi Arabia, Qatar, Rest of Middle East], Africa [Nigeria, South Africa, Rest of Africa], Latin America (Brazil, Argentina, Colombia, Rest of Latin America) |
| Company Profiles | BASF SE, Evonik Industries AG, Sumitomo Chemical Co., Ltd., LANXESS, Domo Chemicals, Arkema, OCI Global, Fibrant, AdvanSix, Nutrien and other key players |
Ans: The Ammonium Sulfate Market is expected to grow from USD 4.06 Billion in 2023 to USD 6.15 Billion by 2032 at a CAGR of 4.73%.
Ans: The caprolactam byproduct process led the market in 2023 with a 62% share due to cost-efficiency and sustainability.
Ans: Fertilizers dominate with a 75.4% share, driven by global agricultural demand for nitrogen and sulfur-based fertilizers.
Ans: Major players include BASF, Nutrien, OCI Global, SINOPEC CORP., Sumitomo Chemical, and Gujarat State Fertilizers & Chemicals Limited.
Ans: Asia Pacific held the highest market share (42.7%) in 2023 due to high agricultural consumption in China, India, and Indonesia.
Table of Contents:
1. Introduction
1.1 Market Definition
1.2 Scope (Inclusion and Exclusions)
1.3 Research Assumptions
2. Executive Summary
2.1 Market Overview
2.2 Regional Synopsis
2.3 Competitive Summary
3. Research Methodology
3.1 Top-Down Approach
3.2 Bottom-up Approach
3.3. Data Validation
3.4 Primary Interviews
4. Market Dynamics Impact Analysis
4.1 Market Driving Factors Analysis
4.1.1 Drivers
4.1.2 Restraints
4.1.3 Opportunities
4.1.4 Challenges
4.2 PESTLE Analysis
4.3 Porter’s Five Forces Model
5. Statistical Insights and Trends Reporting
5.1 Cost Structure Analysis
5.2 Investment requirements and ROI analysis
5.3 International quality and safety standards (e.g., REACH, EPA regulations)
5.4 Consumer Perception and Buying Behavior
5.5 Adoption rates of substitute products in key industries
6. Competitive Landscape
6.1 List of Major Companies, By Region
6.2 Market Share Analysis, By Region
6.3 Product Benchmarking
6.3.1 Product specifications and features
6.3.2 Pricing
6.4 Strategic Initiatives
6.4.1 Marketing and promotional activities
6.4.2 Distribution and supply chain strategies
6.4.3 Expansion plans and new product launches
6.4.4 Strategic partnerships and collaborations
6.5 Technological Advancements
6.6 Market Positioning and Branding
7. Ammonium Sulfate Market Segmentation, by Form
7.1 Chapter Overview
7.2 Solid
7.2.1 Solid Market Trends Analysis (2020-2032)
7.2.2 Solid Market Size Estimates and Forecasts to 2032 (USD Billion)
7.3 Liquid
7.3.1 Liquid Market Trends Analysis (2020-2032)
7.3.2 Liquid Market Size Estimates and Forecasts to 2032 (USD Billion)
8. Ammonium Sulfate Market Segmentation, by Production Process
8.1 Chapter Overview
8.2 Caprolactam Byproduct Process
8.2.1 Caprolactam Byproduct Process Market Trends Analysis (2020-2032)
8.2.2 Caprolactam Byproduct Process Market Size Estimates and Forecasts to 2032 (USD Billion)
8.3 Coke Oven Gas Process
8.3.1 Coke Oven Gas Process Market Trends Analysis (2020-2032)
8.3.2 Coke Oven Gas Process Market Size Estimates and Forecasts to 2032 (USD Billion)
8.4 Gypsum Conversion Process
8.4.1 Gypsum Conversion Process Market Trends Analysis (2020-2032)
8.4.2 Gypsum Conversion Process Market Size Estimates and Forecasts to 2032 (USD Billion)
8.5 Neutralization Process
8.5.1 Neutralization Process Market Trends Analysis (2020-2032)
8.5.2 Neutralization Process Market Size Estimates and Forecasts to 2032 (USD Billion)
9. Ammonium Sulfate Market Segmentation, by Application
9.1 Chapter Overview
9.2 Fertilizers
9.2.1 Fertilizers Market Trends Analysis (2020-2032)
9.2.2 Fertilizers Market Size Estimates and Forecasts to 2032 (USD Billion)
9.3 Pharmaceuticals
9.3.1 Pharmaceuticals Market Trends Analysis (2020-2032)
9.3.2 Pharmaceuticals Market Size Estimates and Forecasts to 2032 (USD Billion)
9.4 Food & Feed Additive
9.4.1 Food & Feed Additive Market Trends Analysis (2020-2032)
9.4.2 Food & Feed Additive Market Size Estimates and Forecasts to 2032 (USD Billion)
9.5 Water Treatment
9.5.1 Water Treatment Market Trends Analysis (2020-2032)
9.5.2 Water Treatment Market Size Estimates and Forecasts to 2032 (USD Billion)
9.6 Others
9.6.1 Others Market Trends Analysis (2020-2032)
9.6.2 Others Market Size Estimates and Forecasts to 2032 (USD Billion)
10. Regional Analysis
10.1 Chapter Overview
10.2 North America
10.2.1 Trends Analysis
10.2.2 North America Ammonium Sulfate Market Estimates and Forecasts, by Country (2020-2032) (USD Billion)
10.2.3 North America Ammonium Sulfate Market Estimates and Forecasts, by Form (2020-2032) (USD Billion)
10.2.4 North America Ammonium Sulfate Market Estimates and Forecasts, by Production Process (2020-2032) (USD Billion)
10.2.5 North America Ammonium Sulfate Market Estimates and Forecasts, by Application (2020-2032) (USD Billion)
10.2.6 USA
10.2.6.1 USA Ammonium Sulfate Market Estimates and Forecasts, by Form (2020-2032) (USD Billion)
10.2.6.2 USA Ammonium Sulfate Market Estimates and Forecasts, by Production Process (2020-2032) (USD Billion)
10.2.6.3 USA Ammonium Sulfate Market Estimates and Forecasts, by Application (2020-2032) (USD Billion)
10.2.7 Canada
10.2.7.1 Canada Ammonium Sulfate Market Estimates and Forecasts, by Form (2020-2032) (USD Billion)
10.2.7.2 Canada Ammonium Sulfate Market Estimates and Forecasts, by Production Process (2020-2032) (USD Billion)
10.2.7.3 Canada Ammonium Sulfate Market Estimates and Forecasts, by Application (2020-2032) (USD Billion)
10.2.8 Mexico
10.2.8.1 Mexico Ammonium Sulfate Market Estimates and Forecasts, by Form (2020-2032) (USD Billion)
10.2.8.2 Mexico Ammonium Sulfate Market Estimates and Forecasts, by Production Process (2020-2032) (USD Billion)
10.2.8.3 Mexico Ammonium Sulfate Market Estimates and Forecasts, by Application (2020-2032) (USD Billion)
10.3 Europe
10.3.1 Eastern Europe
10.3.1.1 Trends Analysis
10.3.1.2 Eastern Europe Ammonium Sulfate Market Estimates and Forecasts, by Country (2020-2032) (USD Billion)
10.3.1.3 Eastern Europe Ammonium Sulfate Market Estimates and Forecasts, by Form (2020-2032) (USD Billion)
10.3.1.4 Eastern Europe Ammonium Sulfate Market Estimates and Forecasts, by Production Process (2020-2032) (USD Billion)
10.3.1.5 Eastern Europe Ammonium Sulfate Market Estimates and Forecasts, by Application (2020-2032) (USD Billion)
10.3.1.6 Poland
10.3.1.6.1 Poland Ammonium Sulfate Market Estimates and Forecasts, by Form (2020-2032) (USD Billion)
10.3.1.6.2 Poland Ammonium Sulfate Market Estimates and Forecasts, by Production Process (2020-2032) (USD Billion)
10.3.1.6.3 Poland Ammonium Sulfate Market Estimates and Forecasts, by Application (2020-2032) (USD Billion)
10.3.1.7 Romania
10.3.1.7.1 Romania Ammonium Sulfate Market Estimates and Forecasts, by Form (2020-2032) (USD Billion)
10.3.1.7.2 Romania Ammonium Sulfate Market Estimates and Forecasts, by Production Process (2020-2032) (USD Billion)
10.3.1.7.3 Romania Ammonium Sulfate Market Estimates and Forecasts, by Application (2020-2032) (USD Billion)
10.3.1.8 Hungary
10.3.1.8.1 Hungary Ammonium Sulfate Market Estimates and Forecasts, by Form (2020-2032) (USD Billion)
10.3.1.8.2 Hungary Ammonium Sulfate Market Estimates and Forecasts, by Production Process (2020-2032) (USD Billion)
10.3.1.8.3 Hungary Ammonium Sulfate Market Estimates and Forecasts, by Application (2020-2032) (USD Billion)
10.3.1.9 Turkey
10.3.1.9.1 Turkey Ammonium Sulfate Market Estimates and Forecasts, by Form (2020-2032) (USD Billion)
10.3.1.9.2 Turkey Ammonium Sulfate Market Estimates and Forecasts, by Production Process (2020-2032) (USD Billion)
10.3.1.9.3 Turkey Ammonium Sulfate Market Estimates and Forecasts, by Application (2020-2032) (USD Billion)
10.3.1.10 Rest of Eastern Europe
10.3.1.10.1 Rest of Eastern Europe Ammonium Sulfate Market Estimates and Forecasts, by Form (2020-2032) (USD Billion)
10.3.1.10.2 Rest of Eastern Europe Ammonium Sulfate Market Estimates and Forecasts, by Production Process (2020-2032) (USD Billion)
10.3.1.10.3 Rest of Eastern Europe Ammonium Sulfate Market Estimates and Forecasts, by Application (2020-2032) (USD Billion)
10.3.2 Western Europe
10.3.2.1 Trends Analysis
10.3.2.2 Western Europe Ammonium Sulfate Market Estimates and Forecasts, by Country (2020-2032) (USD Billion)
10.3.2.3 Western Europe Ammonium Sulfate Market Estimates and Forecasts, by Form (2020-2032) (USD Billion)
10.3.2.4 Western Europe Ammonium Sulfate Market Estimates and Forecasts, by Production Process (2020-2032) (USD Billion)
10.3.2.5 Western Europe Ammonium Sulfate Market Estimates and Forecasts, by Application (2020-2032) (USD Billion)
10.3.2.6 Germany
10.3.2.6.1 Germany Ammonium Sulfate Market Estimates and Forecasts, by Form (2020-2032) (USD Billion)
10.3.2.6.2 Germany Ammonium Sulfate Market Estimates and Forecasts, by Production Process (2020-2032) (USD Billion)
10.3.2.6.3 Germany Ammonium Sulfate Market Estimates and Forecasts, by Application (2020-2032) (USD Billion)
10.3.2.7 France
10.3.2.7.1 France Ammonium Sulfate Market Estimates and Forecasts, by Form (2020-2032) (USD Billion)
10.3.2.7.2 France Ammonium Sulfate Market Estimates and Forecasts, by Production Process (2020-2032) (USD Billion)
10.3.2.7.3 France Ammonium Sulfate Market Estimates and Forecasts, by Application (2020-2032) (USD Billion)
10.3.2.8 UK
10.3.2.8.1 UK Ammonium Sulfate Market Estimates and Forecasts, by Form (2020-2032) (USD Billion)
10.3.2.8.2 UK Ammonium Sulfate Market Estimates and Forecasts, by Production Process (2020-2032) (USD Billion)
10.3.2.8.3 UK Ammonium Sulfate Market Estimates and Forecasts, by Application (2020-2032) (USD Billion)
10.3.2.9 Italy
10.3.2.9.1 Italy Ammonium Sulfate Market Estimates and Forecasts, by Form (2020-2032) (USD Billion)
10.3.2.9.2 Italy Ammonium Sulfate Market Estimates and Forecasts, by Production Process (2020-2032) (USD Billion)
10.3.2.9.3 Italy Ammonium Sulfate Market Estimates and Forecasts, by Application (2020-2032) (USD Billion)
10.3.2.10 Spain
10.3.2.10.1 Spain Ammonium Sulfate Market Estimates and Forecasts, by Form (2020-2032) (USD Billion)
10.3.2.10.2 Spain Ammonium Sulfate Market Estimates and Forecasts, by Production Process (2020-2032) (USD Billion)
10.3.2.10.3 Spain Ammonium Sulfate Market Estimates and Forecasts, by Application (2020-2032) (USD Billion)
10.3.2.11 Netherlands
10.3.2.11.1 Netherlands Ammonium Sulfate Market Estimates and Forecasts, by Form (2020-2032) (USD Billion)
10.3.2.11.2 Netherlands Ammonium Sulfate Market Estimates and Forecasts, by Production Process (2020-2032) (USD Billion)
10.3.2.11.3 Netherlands Ammonium Sulfate Market Estimates and Forecasts, by Application (2020-2032) (USD Billion)
10.3.2.12 Switzerland
10.3.2.12.1 Switzerland Ammonium Sulfate Market Estimates and Forecasts, by Form (2020-2032) (USD Billion)
10.3.2.12.2 Switzerland Ammonium Sulfate Market Estimates and Forecasts, by Production Process (2020-2032) (USD Billion)
10.3.2.12.3 Switzerland Ammonium Sulfate Market Estimates and Forecasts, by Application (2020-2032) (USD Billion)
10.3.2.13 Austria
10.3.2.13.1 Austria Ammonium Sulfate Market Estimates and Forecasts, by Form (2020-2032) (USD Billion)
10.3.2.13.2 Austria Ammonium Sulfate Market Estimates and Forecasts, by Production Process (2020-2032) (USD Billion)
10.3.2.13.3 Austria Ammonium Sulfate Market Estimates and Forecasts, by Application (2020-2032) (USD Billion)
10.3.2.14 Rest of Western Europe
10.3.2.14.1 Rest of Western Europe Ammonium Sulfate Market Estimates and Forecasts, by Form (2020-2032) (USD Billion)
10.3.2.14.2 Rest of Western Europe Ammonium Sulfate Market Estimates and Forecasts, by Production Process (2020-2032) (USD Billion)
10.3.2.14.3 Rest of Western Europe Ammonium Sulfate Market Estimates and Forecasts, by Application (2020-2032) (USD Billion)
10.4 Asia Pacific
10.4.1 Trends Analysis
10.4.2 Asia Pacific Ammonium Sulfate Market Estimates and Forecasts, by Country (2020-2032) (USD Billion)
10.4.3 Asia Pacific Ammonium Sulfate Market Estimates and Forecasts, by Form (2020-2032) (USD Billion)
10.4.4 Asia Pacific Ammonium Sulfate Market Estimates and Forecasts, by Production Process (2020-2032) (USD Billion)
10.4.5 Asia Pacific Ammonium Sulfate Market Estimates and Forecasts, by Application (2020-2032) (USD Billion)
10.4.6 China
10.4.6.1 China Ammonium Sulfate Market Estimates and Forecasts, by Form (2020-2032) (USD Billion)
10.4.6.2 China Ammonium Sulfate Market Estimates and Forecasts, by Production Process (2020-2032) (USD Billion)
10.4.6.3 China Ammonium Sulfate Market Estimates and Forecasts, by Application (2020-2032) (USD Billion)
10.4.7 India
10.4.7.1 India Ammonium Sulfate Market Estimates and Forecasts, by Form (2020-2032) (USD Billion)
10.4.7.2 India Ammonium Sulfate Market Estimates and Forecasts, by Production Process (2020-2032) (USD Billion)
10.4.7.3 India Ammonium Sulfate Market Estimates and Forecasts, by Application (2020-2032) (USD Billion)
10.4.8 Japan
10.4.8.1 Japan Ammonium Sulfate Market Estimates and Forecasts, by Form (2020-2032) (USD Billion)
10.4.8.2 Japan Ammonium Sulfate Market Estimates and Forecasts, by Production Process (2020-2032) (USD Billion)
10.4.8.3 Japan Ammonium Sulfate Market Estimates and Forecasts, by Application (2020-2032) (USD Billion)
10.4.9 South Korea
10.4.9.1 South Korea Ammonium Sulfate Market Estimates and Forecasts, by Form (2020-2032) (USD Billion)
10.4.9.2 South Korea Ammonium Sulfate Market Estimates and Forecasts, by Production Process (2020-2032) (USD Billion)
10.4.9.3 South Korea Ammonium Sulfate Market Estimates and Forecasts, by Application (2020-2032) (USD Billion)
10.4.10 Vietnam
10.4.10.1 Vietnam Ammonium Sulfate Market Estimates and Forecasts, by Form (2020-2032) (USD Billion)
10.4.10.2 Vietnam Ammonium Sulfate Market Estimates and Forecasts, by Production Process (2020-2032) (USD Billion)
10.4.10.3 Vietnam Ammonium Sulfate Market Estimates and Forecasts, by Application (2020-2032) (USD Billion)
10.4.11 Singapore
10.4.11.1 Singapore Ammonium Sulfate Market Estimates and Forecasts, by Form (2020-2032) (USD Billion)
10.4.11.2 Singapore Ammonium Sulfate Market Estimates and Forecasts, by Production Process (2020-2032) (USD Billion)
10.4.11.3 Singapore Ammonium Sulfate Market Estimates and Forecasts, by Application (2020-2032) (USD Billion)
10.4.12 Australia
10.4.12.1 Australia Ammonium Sulfate Market Estimates and Forecasts, by Form (2020-2032) (USD Billion)
10.4.12.2 Australia Ammonium Sulfate Market Estimates and Forecasts, by Production Process (2020-2032) (USD Billion)
10.4.12.3 Australia Ammonium Sulfate Market Estimates and Forecasts, by Application (2020-2032) (USD Billion)
10.4.13 Rest of Asia Pacific
10.4.13.1 Rest of Asia Pacific Ammonium Sulfate Market Estimates and Forecasts, by Form (2020-2032) (USD Billion)
10.4.13.2 Rest of Asia Pacific Ammonium Sulfate Market Estimates and Forecasts, by Production Process (2020-2032) (USD Billion)
10.4.13.3 Rest of Asia Pacific Ammonium Sulfate Market Estimates and Forecasts, by Application (2020-2032) (USD Billion)
10.5 Middle East and Africa
10.5.1 Middle East
10.5.1.1 Trends Analysis
10.5.1.2 Middle East Ammonium Sulfate Market Estimates and Forecasts, by Country (2020-2032) (USD Billion)
10.5.1.3 Middle East Ammonium Sulfate Market Estimates and Forecasts, by Form (2020-2032) (USD Billion)
10.5.1.4 Middle East Ammonium Sulfate Market Estimates and Forecasts, by Production Process (2020-2032) (USD Billion)
10.5.1.5 Middle East Ammonium Sulfate Market Estimates and Forecasts, by Application (2020-2032) (USD Billion)
10.5.1.6 UAE
10.5.1.6.1 UAE Ammonium Sulfate Market Estimates and Forecasts, by Form (2020-2032) (USD Billion)
10.5.1.6.2 UAE Ammonium Sulfate Market Estimates and Forecasts, by Production Process (2020-2032) (USD Billion)
10.5.1.6.3 UAE Ammonium Sulfate Market Estimates and Forecasts, by Application (2020-2032) (USD Billion)
10.5.1.7 Egypt
10.5.1.7.1 Egypt Ammonium Sulfate Market Estimates and Forecasts, by Form (2020-2032) (USD Billion)
10.5.1.7.2 Egypt Ammonium Sulfate Market Estimates and Forecasts, by Production Process (2020-2032) (USD Billion)
10.5.1.7.3 Egypt Ammonium Sulfate Market Estimates and Forecasts, by Application (2020-2032) (USD Billion)
10.5.1.8 Saudi Arabia
10.5.1.8.1 Saudi Arabia Ammonium Sulfate Market Estimates and Forecasts, by Form (2020-2032) (USD Billion)
10.5.1.8.2 Saudi Arabia Ammonium Sulfate Market Estimates and Forecasts, by Production Process (2020-2032) (USD Billion)
10.5.1.8.3 Saudi Arabia Ammonium Sulfate Market Estimates and Forecasts, by Application (2020-2032) (USD Billion)
10.5.1.9 Qatar
10.5.1.9.1 Qatar Ammonium Sulfate Market Estimates and Forecasts, by Form (2020-2032) (USD Billion)
10.5.1.9.2 Qatar Ammonium Sulfate Market Estimates and Forecasts, by Production Process (2020-2032) (USD Billion)
10.5.1.9.3 Qatar Ammonium Sulfate Market Estimates and Forecasts, by Application (2020-2032) (USD Billion)
10.5.1.10 Rest of Middle East
10.5.1.10.1 Rest of Middle East Ammonium Sulfate Market Estimates and Forecasts, by Form (2020-2032) (USD Billion)
10.5.1.10.2 Rest of Middle East Ammonium Sulfate Market Estimates and Forecasts, by Production Process (2020-2032) (USD Billion)
10.5.1.10.3 Rest of Middle East Ammonium Sulfate Market Estimates and Forecasts, by Application (2020-2032) (USD Billion)
10.5.2 Africa
10.5.2.1 Trends Analysis
10.5.2.2 Africa Ammonium Sulfate Market Estimates and Forecasts, by Country (2020-2032) (USD Billion)
10.5.2.3 Africa Ammonium Sulfate Market Estimates and Forecasts, by Form (2020-2032) (USD Billion)
10.5.2.4 Africa Ammonium Sulfate Market Estimates and Forecasts, by Production Process (2020-2032) (USD Billion)
10.5.2.5 Africa Ammonium Sulfate Market Estimates and Forecasts, by Application (2020-2032) (USD Billion)
10.5.2.6 South Africa
10.5.2.6.1 South Africa Ammonium Sulfate Market Estimates and Forecasts, by Form (2020-2032) (USD Billion)
10.5.2.6.2 South Africa Ammonium Sulfate Market Estimates and Forecasts, by Production Process (2020-2032) (USD Billion)
10.5.2.6.3 South Africa Ammonium Sulfate Market Estimates and Forecasts, by Application (2020-2032) (USD Billion)
10.5.2.7 Nigeria
10.5.2.7.1 Nigeria Ammonium Sulfate Market Estimates and Forecasts, by Form (2020-2032) (USD Billion)
10.5.2.7.2 Nigeria Ammonium Sulfate Market Estimates and Forecasts, by Production Process (2020-2032) (USD Billion)
10.5.2.7.3 Nigeria Ammonium Sulfate Market Estimates and Forecasts, by Application (2020-2032) (USD Billion)
10.5.2.8 Rest of Africa
10.5.2.8.1 Rest of Africa Ammonium Sulfate Market Estimates and Forecasts, by Form (2020-2032) (USD Billion)
10.5.2.8.2 Rest of Africa Ammonium Sulfate Market Estimates and Forecasts, by Production Process (2020-2032) (USD Billion)
10.5.2.8.3 Rest of Africa Ammonium Sulfate Market Estimates and Forecasts, by Application (2020-2032) (USD Billion)
10.6 Latin America
10.6.1 Trends Analysis
10.6.2 Latin America Ammonium Sulfate Market Estimates and Forecasts, by Country (2020-2032) (USD Billion)
10.6.3 Latin America Ammonium Sulfate Market Estimates and Forecasts, by Form (2020-2032) (USD Billion)
10.6.4 Latin America Ammonium Sulfate Market Estimates and Forecasts, by Production Process (2020-2032) (USD Billion)
10.6.5 Latin America Ammonium Sulfate Market Estimates and Forecasts, by Application (2020-2032) (USD Billion)
10.6.6 Brazil
10.6.6.1 Brazil Ammonium Sulfate Market Estimates and Forecasts, by Form (2020-2032) (USD Billion)
10.6.6.2 Brazil Ammonium Sulfate Market Estimates and Forecasts, by Production Process (2020-2032) (USD Billion)
10.6.6.3 Brazil Ammonium Sulfate Market Estimates and Forecasts, by Application (2020-2032) (USD Billion)
10.6.7 Argentina
10.6.7.1 Argentina Ammonium Sulfate Market Estimates and Forecasts, by Form (2020-2032) (USD Billion)
10.6.7.2 Argentina Ammonium Sulfate Market Estimates and Forecasts, by Production Process (2020-2032) (USD Billion)
10.6.7.3 Argentina Ammonium Sulfate Market Estimates and Forecasts, by Application (2020-2032) (USD Billion)
10.6.8 Colombia
10.6.8.1 Colombia Ammonium Sulfate Market Estimates and Forecasts, by Form (2020-2032) (USD Billion)
10.6.8.2 Colombia Ammonium Sulfate Market Estimates and Forecasts, by Production Process (2020-2032) (USD Billion)
10.6.8.3 Colombia Ammonium Sulfate Market Estimates and Forecasts, by Application (2020-2032) (USD Billion)
10.6.9 Rest of Latin America
10.6.9.1 Rest of Latin America Ammonium Sulfate Market Estimates and Forecasts, by Form (2020-2032) (USD Billion)
10.6.9.2 Rest of Latin America Ammonium Sulfate Market Estimates and Forecasts, by Production Process (2020-2032) (USD Billion)
10.6.9.3 Rest of Latin America Ammonium Sulfate Market Estimates and Forecasts, by Application (2020-2032) (USD Billion)
11. Company Profiles
11.1 BASF SE
11.1.1 Company Overview
11.1.2 Financial
11.1.3 Products/ Services Offered
11.1.4 SWOT Analysis
11.2 Evonik Industries AG
11.2.1 Company Overview
11.2.2 Financial
11.2.3 Products/ Services Offered
11.2.4 SWOT Analysis
11.3 Sumitomo Chemical Co., Ltd.
11.3.1 Company Overview
11.3.2 Financial
11.3.3 Products/ Services Offered
11.3.4 SWOT Analysis
11.4 LANXESS
11.4.1 Company Overview
11.4.2 Financial
11.4.3 Products/ Services Offered
11.4.4 SWOT Analysis
11.5 Domo Chemicals
11.5.1 Company Overview
11.5.2 Financial
11.5.3 Products/ Services Offered
11.5.4 SWOT Analysis
11.6 Arkema
11.6.1 Company Overview
11.6.2 Financial
11.6.3 Products/ Services Offered
11.6.4 SWOT Analysis
11.7 OCI Global
11.7.1 Company Overview
11.7.2 Financial
11.7.3 Products/ Services Offered
11.7.4 SWOT Analysis
11.8 Fibrant
11.8.1 Company Overview
11.8.2 Financial
11.8.3 Products/ Services Offered
11.8.4 SWOT Analysis
11.9 AdvanSix
11.9.1 Company Overview
11.9.2 Financial
11.9.3 Products/ Services Offered
11.9.4 SWOT Analysis
11.10 Nutrien
11.10.1 Company Overview
11.10.2 Financial
11.10.3 Products/ Services Offered
11.10.4 SWOT Analysis
12. Use Cases and Best Practices
13. Conclusion
An accurate research report requires proper strategizing as well as implementation. There are multiple factors involved in the completion of good and accurate research report and selecting the best methodology to compete the research is the toughest part. Since the research reports we provide play a crucial role in any company’s decision-making process, therefore we at SNS Insider always believe that we should choose the best method which gives us results closer to reality. This allows us to reach at a stage wherein we can provide our clients best and accurate investment to output ratio.
Each report that we prepare takes a timeframe of 350-400 business hours for production. Starting from the selection of titles through a couple of in-depth brain storming session to the final QC process before uploading our titles on our website we dedicate around 350 working hours. The titles are selected based on their current market cap and the foreseen CAGR and growth.
The 5 steps process:
Step 1: Secondary Research:
Secondary Research or Desk Research is as the name suggests is a research process wherein, we collect data through the readily available information. In this process we use various paid and unpaid databases which our team has access to and gather data through the same. This includes examining of listed companies’ annual reports, Journals, SEC filling etc. Apart from this our team has access to various associations across the globe across different industries. Lastly, we have exchange relationships with various university as well as individual libraries.

Step 2: Primary Research
When we talk about primary research, it is a type of study in which the researchers collect relevant data samples directly, rather than relying on previously collected data. This type of research is focused on gaining content specific facts that can be sued to solve specific problems. Since the collected data is fresh and first hand therefore it makes the study more accurate and genuine.
We at SNS Insider have divided Primary Research into 2 parts.
Part 1 wherein we interview the KOLs of major players as well as the upcoming ones across various geographic regions. This allows us to have their view over the market scenario and acts as an important tool to come closer to the accurate market numbers. As many as 45 paid and unpaid primary interviews are taken from both the demand and supply side of the industry to make sure we land at an accurate judgement and analysis of the market.
This step involves the triangulation of data wherein our team analyses the interview transcripts, online survey responses and observation of on filed participants. The below mentioned chart should give a better understanding of the part 1 of the primary interview.

Part 2: In this part of primary research the data collected via secondary research and the part 1 of the primary research is validated with the interviews from individual consultants and subject matter experts.
Consultants are those set of people who have at least 12 years of experience and expertise within the industry whereas Subject Matter Experts are those with at least 15 years of experience behind their back within the same space. The data with the help of two main processes i.e., FGDs (Focused Group Discussions) and IDs (Individual Discussions). This gives us a 3rd party nonbiased primary view of the market scenario making it a more dependable one while collation of the data pointers.
Step 3: Data Bank Validation
Once all the information is collected via primary and secondary sources, we run that information for data validation. At our intelligence centre our research heads track a lot of information related to the market which includes the quarterly reports, the daily stock prices, and other relevant information. Our data bank server gets updated every fortnight and that is how the information which we collected using our primary and secondary information is revalidated in real time.

Step 4: QA/QC Process
After all the data collection and validation our team does a final level of quality check and quality assurance to get rid of any unwanted or undesired mistakes. This might include but not limited to getting rid of the any typos, duplication of numbers or missing of any important information. The people involved in this process include technical content writers, research heads and graphics people. Once this process is completed the title gets uploader on our platform for our clients to read it.
Step 5: Final QC/QA Process:
This is the last process and comes when the client has ordered the study. In this process a final QA/QC is done before the study is emailed to the client. Since we believe in giving our clients a good experience of our research studies, therefore, to make sure that we do not lack at our end in any way humanly possible we do a final round of quality check and then dispatch the study to the client.
Key Segments:
By Form
Solid
Liquid
By Production Process
Caprolactam Byproduct Process
Coke Oven Gas Process
Gypsum Conversion Process
Neutralization Process
By Application
Fertilizers
Pharmaceuticals
Food & Feed Additive
Water Treatment
Others
Request for Segment Customization as per your Business Requirement: Segment Customization Request
Regional Coverage:
North America
US
Canada
Mexico
Europe
Eastern Europe
Poland
Romania
Hungary
Turkey
Rest of Eastern Europe
Western Europe
Germany
France
UK
Italy
Spain
Netherlands
Switzerland
Austria
Rest of Western Europe
Asia Pacific
China
India
Japan
South Korea
Vietnam
Singapore
Australia
Rest of Asia Pacific
Middle East & Africa
Middle East
UAE
Egypt
Saudi Arabia
Qatar
Rest of Middle East
Africa
Nigeria
South Africa
Rest of Africa
Latin America
Brazil
Argentina
Colombia
Rest of Latin America
Request for Country Level Research Report: Country Level Customization Request
Available Customization
With the given market data, SNS Insider offers customization as per the company’s specific needs. The following customization options are available for the report:
Detailed Volume Analysis
Criss-Cross segment analysis (e.g. Product X Application)
Competitive Product Benchmarking
Geographic Analysis
Additional countries in any of the regions
Customized Data Representation
Detailed analysis and profiling of additional market players
The Acetonitrile Market size was USD 414.94 Million in 2023 and is expected to reach USD 692.74 Million by 2032, growing at a CAGR of 5.86 % from 2024-2032.
The Concrete Floor Coating Market size was USD 4.75 Billion in 2023. It is estimated to hit USD 7.61 Billion by 2032 and grow at a CAGR of 5.4% by 2024-2032.
The Zeolite Market Size was valued at USD 6.3 billion in 2023 and is expected to reach USD 9.3 billion by 2032 and grow at a CAGR of 4.4% by 2024-2032.
The Waterproof Adhesives & Sealants Market Size was valued at USD 25.66 Billion in 2023 and is expected to reach USD 44.18 Billion by 2032, growing at a CAGR of 6.23% over the forecast period of 2024-2032.
Hydrogel Market Size was valued at USD 28.4 billion in 2023, and is expected to reach USD 50.0 billion by 2032, growing at a CAGR of 6.5% from 2024 to 2032.
Catalyst Regeneration Market Size was USD 5.77 Billion in 2023 and is expected to reach USD 9.07 Billion by 2032, growing at a CAGR of 5.16 % from 2024-2032.

Hi! Click one of our member below to chat on Phone
© 2025 All Rights Reserved by SNS Insider Pvt Ltd


