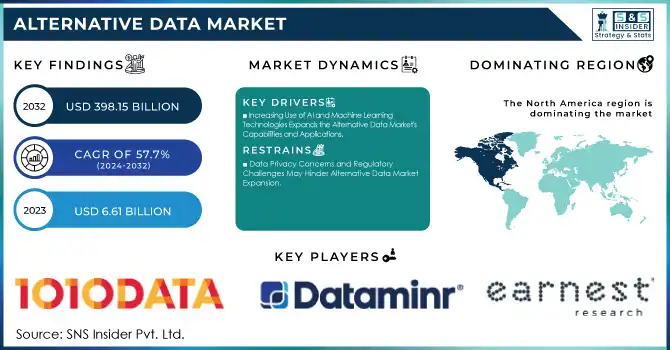
The Alternative Data Market Size was valued at USD 6.61 Billion in 2023 and is expected to reach USD 398.15 Billion by 2032 and grow at a CAGR of 57.7% over the forecast period 2024-2032.
Get More Information on Alternative Data Market - Request Sample Report
The Alternative Data Market has experienced rapid growth in recent years, driven by the increasing need for organizations to make more informed and data-driven decisions. Alternative data is data from non-traditional sources that may be used to get unique insights about different business, economic, and consumer behaviors. While conventional data comes from structured sources like financial reports, sales figures, or market surveys, alternative data comes from unstructured or non-traditional sources like social media, satellite imagery, web scraping, geolocation data, sensor data, and transaction records.
For instance, hedge funds are planning a 'budget boom' in 2025 for datasets that cost them millions annually, with 95% of buyers, including hedge funds and venture capital managers, expecting their budgets to grow or remain the same in 2025.
Additionally, the proliferation of digital transformation and the Internet of Things has resulted in increasing data generation. This has led to alternative streams of data from businesses to be analyzed. Most importantly, the growth of sustainable and ESG (Environmental, Social, and Governance) investing has influenced market growth significantly, as investors and companies look for ways to evaluate sustainability metrics. Overall, the market for alternative data is going to continue growing forward with technological growth, increasing access to data and the growing requirements for data-informed decision making across all areas.
Increasing Use of AI and Machine Learning Technologies Expands the Alternative Data Market's Capabilities and Applications
High-speed AI and ML technology has greatly improved data processing and analysis capabilities for large alt data volumes. With automation of data processing, AI and ML models can draw out otherwise intractable patterns and insights from complex, unstructured datasets that are hard to interpret using traditional methods. The use cases for alternative data have proliferated across various sectors, such as finance, healthcare, retail, and real estate.
For example, in finance hedge funds and institutional investors are using AI and ML to predict market movements and identify investment opportunities based on alternative data such as satellite imagery, social media sentiment, and transaction data. Similarly, retailers are leveraging AI to analyze consumer behavior, enabling them to optimize inventory management and personalize marketing campaigns.
With AI and ML processing alternative data in real-time, businesses gain insights that enable them to make faster, better decisions. With time, AI and ML are improving, so is the business value of alternative data, hence pushing the market's growth forward in the next years.
Rise of Sustainable and ESG Investing Creates New Demand for Alternative Data Solutions
Increasing interest in sustainability and ESG investing has greatly increased demand for alternative data solutions. More and more investors and companies rely on alternative data to analyze the ESG performance of organizations, industries, and markets. Traditional financial metrics have proven inadequate as concerns about climate change, social responsibility, and corporate governance gain greater attention and are not considered sufficient enough for evaluating the long-term sustainability of a company. Alternative data used include satellite imagery, geospatial data, and supply chain transparency tools used in tracking the environmental impact and social engagement for assessing governance practice in real time.
For instance, satellite images are used to detect deforestation, track carbon emissions, or monitor agricultural practices, providing valuable insights that were previously unavailable or difficult to assess.
Alternative data would be integrated into ESG analysis, providing an investor with a more holistic view of the company's performance to make better-informed decisions, which are sustainability-oriented. Sustainable investing is a growing focus; therefore, demand for alternative data solutions will be on the increase, fueling market growth.
Data Privacy Concerns and Regulatory Challenges May Hinder Alternative Data Market Expansion
The most important hindrance to growth in the alternative data market will be concerns around data privacy, coupled with issues around regulation. Data from non-traditional sources such as social media, geolocation tracking, and IoT devices are collecting enormous volumes of information that seriously raises questions over consumer privacy and data protection. Governments around the globe are introducing data privacy regulations to be stricter; for example, the General Data Protection Regulation (GDPR) in Europe and the California Consumer Privacy Act (CCPA) in the United States require organizations to be more transparent about collecting data, requiring consent from the users, and having tighter control over data use. This regulation may reduce access to certain kinds of alternative data or drive-up compliance costs for businesses looking to incorporate these datasets.
Furthermore, the potential legal liabilities and reputational damage due to breaches or misuse of data makes companies reluctant to embrace alternative data solutions without adequate safeguards. The privacy concerns will continue to evolve, and navigating the complex regulatory landscapes will become challenging for companies in the alternative data market; otherwise, it may limit their ability to fully capitalize on the market's potential.
In 2023, the Credit & Debit Card Transactions segment captured the largest share of the alternative data market with a 19% revenue share, and it continues to play a vital role in business decision-making. Card transaction data provides real-time information on consumer spending habits, purchase patterns, and preferences, which makes it an invaluable resource for financial institutions, retailers, and market researchers.
For instance, Mastercard recently introduced its "Mastercard SpendingPulse" service, which utilizes aggregated card transaction data to give insights into retail sales trends across industries. It helps businesses monitor shifts in consumer spending and makes strategic decisions accordingly.
Growth in e-commerce and digital payments has further intensified the demand for credit and debit card transaction data. As companies increasingly rely on alternative data to improve operations, the Credit & Debit Card Transactions segment will continue to lead and support broader growth in the alternative data market.
The Social & Sentiment Data segment is experiencing the largest CAGR of 61.07% within the forecasted period, this reflects a rapidly expanding market demand for insights from social media, online reviews, and digital interactions. The data is increasingly being used by businesses to track brand health, understand consumer sentiment, and gain real-time market intelligence.
For example, Brandwatch, a leading digital consumer intelligence platform, has launched advanced sentiment analysis features that enable businesses to track public opinion across different social channels, thereby enabling brands to fine-tune their marketing strategies. Similarly, Sprinklr has launched AI-powered sentiment analysis tools to deliver deeper insights into customer feedback on social platforms.
In 2023, the Hedge Fund Operators segment dominated the alternative data market with a substantial 55% revenue share, reflecting the increasing dependence of hedge funds on alternative data to outsmart their peers in investment strategy, hedge fund operators use alternative data sources like satellite imagery, credit card transactions, social media sentiment, and web scraping to unearth market trends, assess risks, and spot opportunities that are overlooked by traditional financial data.
For example, Bridgewater Associates and Two Sigma, two of the largest hedge funds, have incorporated advanced analytics platforms to analyze unstructured data, such as social media feeds and geopolitical news, to inform trading strategies.
Additionally, AQR Capital Management, meanwhile, has been experimenting with alternative data to enrich their systematic investment models. Since hedge funds are ever-hungry alpha generators and predictors with increasing accuracy, demand for high-quality, diversified alternative data sets will continue.
The Retail Companies segment is witnessing the largest CAGR of 60.79% within the forecasted period, From the increasing usage of alternative data by retailers in maximizing customer experience, optimizing supply chains, and also sales forecasting, retailers have been embracing much alternative data from multiple alternative sources, such as foot traffic analytics, credit card transaction data, e-commerce behavior, and social media sentiment.
For instance, Walmart has collaborated with companies like Quantifind in analyzing social and transactional data, which deepens the insights of consumer behavior and enhances product offerings. Similarly, Target has integrated sophisticated analytics tools that analyze alternative data to predict shopping trends and optimize inventory management to ensure more effective product availability.
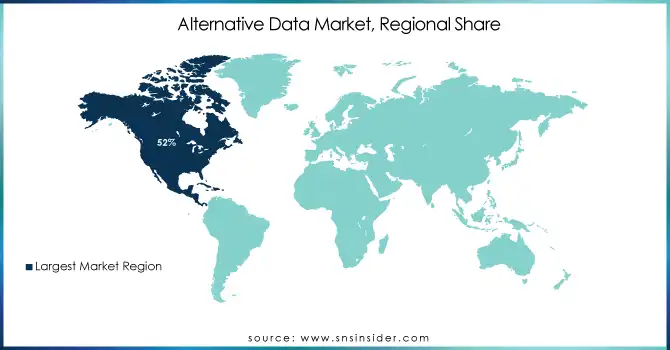
In 2023, North America held the largest market share in the alternative data market, commanding approximately 52% of the total revenue. This is because of the region's strong technological infrastructure, high investment in data analytics, and many financial institutions and technology companies. The United States, for example, is host to some of the world's leading hedge funds, venture capitals, and other financial organizations, which are keen on using alternative data in formulating investment strategies, managing risk, and in market analysis.
For example, companies like BlackRock, Bridgewater Associates, and Two Sigma integrate alternative data such as satellite imagery, credit card transactions, and social media sentiment to predict market trends and enhance their trading strategies.
Moreover, the presence of major technology firms such as Google, Amazon, and Microsoft, who also rely on big data and alternative data to enhance their products and services, contributes significantly to North America's market dominance.
The Asia Pacific region is the fastest-growing market for alternative data in 2023, with an estimated CAGR of 60.15% within the forecasted period. This rapid growth is being driven by the increasing digital transformation, growing e-commerce activities, and adoption of AI and big data analytics across several industries. In specific terms, it includes countries like China, Japan, and India that are expanding the data-driven businesses handling alternative data to make informed decisions within sectors such as retail, finance, and real estate.
For example, Alibaba and JD.com in China use alternative data sources such as transaction records and social media sentiment to enhance customer targeting and optimize inventory management. In India, the fintech companies Paytm and Razorpay make use of credit card transaction data, mobile payment records, and consumer behavior analytics to offer personalized financial products.
Get Customized Report as per Your Business Requirement - Request For Customized Report
Some of the major players in the Alternative Data Market are:
1010Data (1010Data Insights Platform, 1010Data Retail Analytics)
Advan (Advan GeoData, Advan Foot Traffic Analytics)
Dataminr (Dataminr Alerts, Dataminr Pulse)
Earnest Research (Earnest Consumer Spend, Earnest Foot Traffic)
M Science (M Science Transaction Insights, M Science Mobile Data Solutions)
Preqin (Preqin Insights+, Preqin Pro)
RavenPack (RavenPack News Analytics, RavenPack Sentiment Indicators)
UBS Evidence Lab (UBS Alternative Data Insights, UBS GeoData Analytics)
YipitData (YipitData Consumer Insights, YipitData E-commerce Trends)
Preqin Ltd. (Preqin Hedge Fund Data, Preqin Private Equity Intelligence)
7Park Data Inc. (7Park Transaction Insights, 7Park App Usage Analytics)
Convergence Inc. (Convergence Asset Management Data, Convergence Fund Insights)
Eagle Alpha Ltd. (Eagle Alpha Data Sourcing, Eagle Alpha Sentiment Analysis)
Geotab Inc. (Geotab Fleet Analytics, Geotab Location Intelligence)
Jumpshot (Jumpshot Web Traffic Insights, Jumpshot E-commerce Analytics)
JWN Energy (JWN Energy Market Intelligence, JWN Energy Data Insights)
The Earnest Research Company (Earnest Consumer Data, Earnest Market Trends)
Thinknum Inc. (Thinknum Web Data, Thinknum Alternative Data Platform)
Talkingdata (Talkingdata Mobile Analytics, Talkingdata Consumer Insights)
In October 2024, RavenPack launched Bigdata.com, an advanced AI platform designed to transform financial research and decision-making. The platform enables users to interact with billions of financial documents in real-time, create custom research tools, and automate tasks, thereby accelerating the research process.
In November 2024, Advan Research Corporation, a leader in foot traffic and transaction data analytics for the financial, real estate, and retail industries, acquired Real Estate Intelligence (REI) from RetailStat, a retailer health data and analytics company. REI, powered by mobile device location data, offers a custom graphical user interface and associated data feeds for retail real estate analytics.
Report Attributes | Details |
---|---|
Market Size in 2023 | US$ 6.61 Billion |
Market Size by 2032 | US$ 398.15 Billion |
CAGR | CAGR of 57.7 % From 2024 to 2032 |
Base Year | 2023 |
Forecast Period | 2024-2032 |
Historical Data | 2020-2022 |
Report Scope & Coverage | Market Size, Segments Analysis, Competitive Landscape, Regional Analysis, DROC & SWOT Analysis, Forecast Outlook |
Key Segments | • By Type (Credit & Debit Card Transactions, Email Receipts, Geo-location (Foot Traffic) Records, Mobile Application Usage, Satellite & Weather Data, Social & Sentiment Data, Web Scraped Data, Web Traffic, Other Data Types) • By Industry (Automotive, BFSI, Energy, Industrial, IT & Telecommunications, Media & Entertainment, Real Estate & Construction, Retail, Transportation & Logistics, Other Industries) • By End Use (Hedge Fund Operators, Investment Institutions, Retail Companies, Other End Use) |
Regional Analysis/Coverage | North America (US, Canada, Mexico), Europe (Eastern Europe [Poland, Romania, Hungary, Turkey, Rest of Eastern Europe] Western Europe] Germany, France, UK, Italy, Spain, Netherlands, Switzerland, Austria, Rest of Western Europe]), Asia Pacific (China, India, Japan, South Korea, Vietnam, Singapore, Australia, Rest of Asia Pacific), Middle East & Africa (Middle East [UAE, Egypt, Saudi Arabia, Qatar, Rest of Middle East], Africa [Nigeria, South Africa, Rest of Africa], Latin America (Brazil, Argentina, Colombia, Rest of Latin America) |
Company Profiles | 1010Data, Advan, Dataminr, Earnest Analytics, M Science, Preqin, RavenPack, UBS Evidence Lab, YipitData, Preqin Ltd., 7Park Data Inc., Convergence Inc., Eagle Alpha Ltd., Geotab Inc., Jumpshot, JWN Energy, The Earnest Research Company, Thinknum Inc., Talkingdata. |
Key Drivers | • Increasing Use of AI and Machine Learning Technologies Expands the Alternative Data Market's Capabilities and Applications • Rise of Sustainable and ESG Investing Creates New Demand for Alternative Data Solutions |
Restraints | • Data Privacy Concerns and Regulatory Challenges May Hinder Alternative Data Market Expansion |
Ans: The Alternative Data Market is expected to grow at a CAGR of 57.7% during 2024-2032.
Ans: The Alternative Data Market size was USD 6.61 billion in 2023 and is expected to Reach USD 398.15 billion by 2032.
Ans: The major growth factor of the Alternative Data Market is the increasing demand for data-driven insights across various industries to enhance decision-making and gain a competitive edge.
Ans: Credit & Debit Card Transactions segment dominated the Alternative Data Market.
Ans: North America dominated the Alternative Data Market in 2023.
Table Of Contents
1. Introduction
1.1 Market Definition
1.2 Scope (Inclusion and Exclusions)
1.3 Research Assumptions
2. Executive Summary
2.1 Market Overview
2.2 Regional Synopsis
2.3 Competitive Summary
3. Research Methodology
3.1 Top-Down Approach
3.2 Bottom-up Approach
3.3. Data Validation
3.4 Primary Interviews
4. Market Dynamics Impact Analysis
4.1 Market Driving Factors Analysis
4.1.1 Drivers
4.1.2 Restraints
4.1.3 Opportunities
4.1.4 Challenges
4.2 PESTLE Analysis
4.3 Porter’s Five Forces Model
5. Statistical Insights and Trends Reporting
5.1 Investment Trends in Alternative Data (2023)
5.2 Data Privacy and Regulatory Compliance Trends
5.3 Customer Insights and Behavior Trends
5.4 Data Quality and Accuracy Improvements
6. Competitive Landscape
6.1 List of Major Companies, By Region
6.2 Market Share Analysis, By Region
6.3 Product Benchmarking
6.3.1 Product specifications and features
6.3.2 Pricing
6.4 Strategic Initiatives
6.4.1 Marketing and promotional activities
6.4.2 Distribution and supply chain strategies
6.4.3 Expansion plans and new product launches
6.4.4 Strategic partnerships and collaborations
6.5 Technological Advancements
6.6 Market Positioning and Branding
7. Alternative Data Market Segmentation, By Industry
7.1 Chapter Overview
7.2 BFSI
7.2.1 BFSI Market Trends Analysis (2020-2032)
7.2.2 BFSI Market Size Estimates and Forecasts to 2032 (USD Million)
7.3 Energy
7.3.1 Energy Market Trends Analysis (2020-2032)
7.3.2 Energy Market Size Estimates and Forecasts to 2032 (USD Million)
7.4 Automotive
7.4.1 Automotive Market Trends Analysis (2020-2032)
7.4.2 Automotive Market Size Estimates and Forecasts to 2032 (USD Million)
7.5 Industrial
7.5.1 Industrial Market Trends Analysis (2020-2032)
7.5.2 Industrial Market Size Estimates and Forecasts to 2032 (USD Million)
7.6 IT & Telecommunications
7.6.1 IT & Telecommunications Market Trends Analysis (2020-2032)
7.6.2 IT & Telecommunications Market Size Estimates and Forecasts to 2032 (USD Million)
7.7 Media & Entertainment
7.7.1 Media & Entertainment Market Trends Analysis (2020-2032)
7.7.2 Media & Entertainment Market Size Estimates and Forecasts to 2032 (USD Million)
7.8 Real Estate & Construction
7.8.1 Real Estate & Construction Market Trends Analysis (2020-2032)
7.8.2 Real Estate & Construction Market Size Estimates and Forecasts to 2032 (USD Million)
7.9 Retail
7.9.1 Retail Market Trends Analysis (2020-2032)
7.9.2 Retail Market Size Estimates and Forecasts to 2032 (USD Million)
7.10 Transportation & Logistics
7.10.1 Transportation & Logistics Market Trends Analysis (2020-2032)
7.10.2 Transportation & Logistics Market Size Estimates and Forecasts to 2032 (USD Million)
7.11 Other Industries
7.11.1 Other Industries Market Trends Analysis (2020-2032)
7.11.2 Other Industries Market Size Estimates and Forecasts to 2032 (USD Million)
8. Alternative Data Market Segmentation, By End Use
8.1 Chapter Overview
8.2 Hedge Fund Operators
8.2.1 Hedge Fund Operators Market Trends Analysis (2020-2032)
8.2.2 Hedge Fund Operators Market Size Estimates and Forecasts to 2032 (USD Million)
8.3 Investment Institutions
8.3.1 Investment Institutions Market Trends Analysis (2020-2032)
8.3.2 Investment Institutions Market Size Estimates and Forecasts to 2032 (USD Million)
8.4 Retail Companies
8.4.1 Retail Companies Market Trends Analysis (2020-2032)
8.4.2 Retail Companies Market Size Estimates and Forecasts to 2032 (USD Million)
8.5 Other End Use
8.5.1 Other End Use Market Trends Analysis (2020-2032)
8.5.2 Other End Use Market Size Estimates and Forecasts to 2032 (USD Million)
9. Alternative Data Market Segmentation, By Type
9.1 Chapter Overview
9.2 Credit & Debit Card Transactions
9.2.1 Credit & Debit Card Transactions Market Trends Analysis (2020-2032)
9.2.2 Credit & Debit Card Transactions Market Size Estimates and Forecasts to 2032 (USD Million)
9.3 Email Receipts
9.3.1 Email Receipts Market Trends Analysis (2020-2032)
9.3.2 Email Receipts Market Size Estimates and Forecasts to 2032 (USD Million)
9.4 Geo-location (Foot Traffic) Records
9.4.1 Geo-location (Foot Traffic) Records Market Trends Analysis (2020-2032)
9.4.2 Geo-location (Foot Traffic) Records Market Size Estimates and Forecasts to 2032 (USD Million)
9.5 Mobile Application Usage
9.5.1 Mobile Application Usage Market Trends Analysis (2020-2032)
9.5.2 Mobile Application Usage Market Size Estimates and Forecasts to 2032 (USD Million)
9.6 Satellite & Weather Data
9.6.1 Satellite & Weather Data Market Trends Analysis (2020-2032)
9.6.2 Satellite & Weather Data Market Size Estimates and Forecasts to 2032 (USD Million)
9.7 Social & Sentiment Data
9.7.1 Social & Sentiment Data Market Trends Analysis (2020-2032)
9.7.2 Social & Sentiment Data Market Size Estimates and Forecasts to 2032 (USD Million)
9.8 Web Scraped Data
9.8.1 Web Scraped Data Market Trends Analysis (2020-2032)
9.8.2 Web Scraped Data Market Size Estimates and Forecasts to 2032 (USD Million)
9.9 Web Traffic
9.9.1 Web Traffic Market Trends Analysis (2020-2032)
9.9.2 Web Traffic Market Size Estimates and Forecasts to 2032 (USD Million)
9.10 Other Data Types
9.10.1 Other Data Types Market Trends Analysis (2020-2032)
9.10.2 Other Data Types Market Size Estimates and Forecasts to 2032 (USD Million)
10. Regional Analysis
10.1 Chapter Overview
10.2 North America
10.2.1 Trends Analysis
10.2.2 North America Alternative Data Market Estimates and Forecasts, by Country (2020-2032) (USD Million)
10.2.3 North America Alternative Data Market Estimates and Forecasts, By Industry (2020-2032) (USD Million)
10.2.4 North America Alternative Data Market Estimates and Forecasts, By End Use (2020-2032) (USD Million)
10.2.5 North America Alternative Data Market Estimates and Forecasts, By Type (2020-2032) (USD Million)
10.2.6 USA
10.2.6.1 USA Alternative Data Market Estimates and Forecasts, By Industry (2020-2032) (USD Million)
10.2.6.2 USA Alternative Data Market Estimates and Forecasts, By End Use (2020-2032) (USD Million)
10.2.6.3 USA Alternative Data Market Estimates and Forecasts, By Type (2020-2032) (USD Million)
10.2.7 Canada
10.2.7.1 Canada Alternative Data Market Estimates and Forecasts, By Industry (2020-2032) (USD Million)
10.2.7.2 Canada Alternative Data Market Estimates and Forecasts, By End Use (2020-2032) (USD Million)
10.2.7.3 Canada Alternative Data Market Estimates and Forecasts, By Type (2020-2032) (USD Million)
10.2.8 Mexico
10.2.8.1 Mexico Alternative Data Market Estimates and Forecasts, By Industry (2020-2032) (USD Million)
10.2.8.2 Mexico Alternative Data Market Estimates and Forecasts, By End Use (2020-2032) (USD Million)
10.2.8.3 Mexico Alternative Data Market Estimates and Forecasts, By Type (2020-2032) (USD Million)
10.3 Europe
10.3.1 Eastern Europe
10.3.1.1 Trends Analysis
10.3.1.2 Eastern Europe Alternative Data Market Estimates and Forecasts, by Country (2020-2032) (USD Million)
10.3.1.3 Eastern Europe Alternative Data Market Estimates and Forecasts, By Industry (2020-2032) (USD Million)
10.3.1.4 Eastern Europe Alternative Data Market Estimates and Forecasts, By End Use (2020-2032) (USD Million)
10.3.1.5 Eastern Europe Alternative Data Market Estimates and Forecasts, By Type (2020-2032) (USD Million)
10.3.1.6 Poland
10.3.1.6.1 Poland Alternative Data Market Estimates and Forecasts, By Industry (2020-2032) (USD Million)
10.3.1.6.2 Poland Alternative Data Market Estimates and Forecasts, By End Use (2020-2032) (USD Million)
10.3.1.6.3 Poland Alternative Data Market Estimates and Forecasts, By Type (2020-2032) (USD Million)
10.3.1.7 Romania
10.3.1.7.1 Romania Alternative Data Market Estimates and Forecasts, By Industry (2020-2032) (USD Million)
10.3.1.7.2 Romania Alternative Data Market Estimates and Forecasts, By End Use (2020-2032) (USD Million)
10.3.1.7.3 Romania Alternative Data Market Estimates and Forecasts, By Type (2020-2032) (USD Million)
10.3.1.8 Hungary
10.3.1.8.1 Hungary Alternative Data Market Estimates and Forecasts, By Industry (2020-2032) (USD Million)
10.3.1.8.2 Hungary Alternative Data Market Estimates and Forecasts, By End Use (2020-2032) (USD Million)
10.3.1.8.3 Hungary Alternative Data Market Estimates and Forecasts, By Type (2020-2032) (USD Million)
10.3.1.9 Turkey
10.3.1.9.1 Turkey Alternative Data Market Estimates and Forecasts, By Industry (2020-2032) (USD Million)
10.3.1.9.2 Turkey Alternative Data Market Estimates and Forecasts, By End Use (2020-2032) (USD Million)
10.3.1.9.3 Turkey Alternative Data Market Estimates and Forecasts, By Type (2020-2032) (USD Million)
10.3.1.10 Rest of Eastern Europe
10.3.1.10.1 Rest of Eastern Europe Alternative Data Market Estimates and Forecasts, By Industry (2020-2032) (USD Million)
10.3.1.10.2 Rest of Eastern Europe Alternative Data Market Estimates and Forecasts, By End Use (2020-2032) (USD Million)
10.3.1.10.3 Rest of Eastern Europe Alternative Data Market Estimates and Forecasts, By Type (2020-2032) (USD Million)
10.3.2 Western Europe
10.3.2.1 Trends Analysis
10.3.2.2 Western Europe Alternative Data Market Estimates and Forecasts, by Country (2020-2032) (USD Million)
10.3.2.3 Western Europe Alternative Data Market Estimates and Forecasts, By Industry (2020-2032) (USD Million)
10.3.2.4 Western Europe Alternative Data Market Estimates and Forecasts, By End Use (2020-2032) (USD Million)
10.3.2.5 Western Europe Alternative Data Market Estimates and Forecasts, By Type (2020-2032) (USD Million)
10.3.2.6 Germany
10.3.2.6.1 Germany Alternative Data Market Estimates and Forecasts, By Industry (2020-2032) (USD Million)
10.3.2.6.2 Germany Alternative Data Market Estimates and Forecasts, By End Use (2020-2032) (USD Million)
10.3.2.6.3 Germany Alternative Data Market Estimates and Forecasts, By Type (2020-2032) (USD Million)
10.3.2.7 France
10.3.2.7.1 France Alternative Data Market Estimates and Forecasts, By Industry (2020-2032) (USD Million)
10.3.2.7.2 France Alternative Data Market Estimates and Forecasts, By End Use (2020-2032) (USD Million)
10.3.2.7.3 France Alternative Data Market Estimates and Forecasts, By Type (2020-2032) (USD Million)
10.3.2.8 UK
10.3.2.8.1 UK Alternative Data Market Estimates and Forecasts, By Industry (2020-2032) (USD Million)
10.3.2.8.2 UK Alternative Data Market Estimates and Forecasts, By End Use (2020-2032) (USD Million)
10.3.2.8.3 UK Alternative Data Market Estimates and Forecasts, By Type (2020-2032) (USD Million)
10.3.2.9 Italy
10.3.2.9.1 Italy Alternative Data Market Estimates and Forecasts, By Industry (2020-2032) (USD Million)
10.3.2.9.2 Italy Alternative Data Market Estimates and Forecasts, By End Use (2020-2032) (USD Million)
10.3.2.9.3 Italy Alternative Data Market Estimates and Forecasts, By Type (2020-2032) (USD Million)
10.3.2.10 Spain
10.3.2.10.1 Spain Alternative Data Market Estimates and Forecasts, By Industry (2020-2032) (USD Million)
10.3.2.10.2 Spain Alternative Data Market Estimates and Forecasts, By End Use (2020-2032) (USD Million)
10.3.2.10.3 Spain Alternative Data Market Estimates and Forecasts, By Type (2020-2032) (USD Million)
10.3.2.11 Netherlands
10.3.2.11.1 Netherlands Alternative Data Market Estimates and Forecasts, By Industry (2020-2032) (USD Million)
10.3.2.11.2 Netherlands Alternative Data Market Estimates and Forecasts, By End Use (2020-2032) (USD Million)
10.3.2.11.3 Netherlands Alternative Data Market Estimates and Forecasts, By Type (2020-2032) (USD Million)
10.3.2.12 Switzerland
10.3.2.12.1 Switzerland Alternative Data Market Estimates and Forecasts, By Industry (2020-2032) (USD Million)
10.3.2.12.2 Switzerland Alternative Data Market Estimates and Forecasts, By End Use (2020-2032) (USD Million)
10.3.2.12.3 Switzerland Alternative Data Market Estimates and Forecasts, By Type (2020-2032) (USD Million)
10.3.2.13 Austria
10.3.2.13.1 Austria Alternative Data Market Estimates and Forecasts, By Industry (2020-2032) (USD Million)
10.3.2.13.2 Austria Alternative Data Market Estimates and Forecasts, By End Use (2020-2032) (USD Million)
10.3.2.13.3 Austria Alternative Data Market Estimates and Forecasts, By Type (2020-2032) (USD Million)
10.3.2.14 Rest of Western Europe
10.3.2.14.1 Rest of Western Europe Alternative Data Market Estimates and Forecasts, By Industry (2020-2032) (USD Million)
10.3.2.14.2 Rest of Western Europe Alternative Data Market Estimates and Forecasts, By End Use (2020-2032) (USD Million)
10.3.2.14.3 Rest of Western Europe Alternative Data Market Estimates and Forecasts, By Type (2020-2032) (USD Million)
10.4 Asia Pacific
10.4.1 Trends Analysis
10.4.2 Asia Pacific Alternative Data Market Estimates and Forecasts, by Country (2020-2032) (USD Million)
10.4.3 Asia Pacific Alternative Data Market Estimates and Forecasts, By Industry (2020-2032) (USD Million)
10.4.4 Asia Pacific Alternative Data Market Estimates and Forecasts, By End Use (2020-2032) (USD Million)
10.4.5 Asia Pacific Alternative Data Market Estimates and Forecasts, By Type (2020-2032) (USD Million)
10.4.6 China
10.4.6.1 China Alternative Data Market Estimates and Forecasts, By Industry (2020-2032) (USD Million)
10.4.6.2 China Alternative Data Market Estimates and Forecasts, By End Use (2020-2032) (USD Million)
10.4.6.3 China Alternative Data Market Estimates and Forecasts, By Type (2020-2032) (USD Million)
10.4.7 India
10.4.7.1 India Alternative Data Market Estimates and Forecasts, By Industry (2020-2032) (USD Million)
10.4.7.2 India Alternative Data Market Estimates and Forecasts, By End Use (2020-2032) (USD Million)
10.4.7.3 India Alternative Data Market Estimates and Forecasts, By Type (2020-2032) (USD Million)
10.4.8 Japan
10.4.8.1 Japan Alternative Data Market Estimates and Forecasts, By Industry (2020-2032) (USD Million)
10.4.8.2 Japan Alternative Data Market Estimates and Forecasts, By End Use (2020-2032) (USD Million)
10.4.8.3 Japan Alternative Data Market Estimates and Forecasts, By Type (2020-2032) (USD Million)
10.4.9 South Korea
10.4.9.1 South Korea Alternative Data Market Estimates and Forecasts, By Industry (2020-2032) (USD Million)
10.4.9.2 South Korea Alternative Data Market Estimates and Forecasts, By End Use (2020-2032) (USD Million)
10.4.9.3 South Korea Alternative Data Market Estimates and Forecasts, By Type (2020-2032) (USD Million)
10.4.10 Vietnam
10.4.10.1 Vietnam Alternative Data Market Estimates and Forecasts, By Industry (2020-2032) (USD Million)
10.4.10.2 Vietnam Alternative Data Market Estimates and Forecasts, By End Use (2020-2032) (USD Million)
10.4.10.3 Vietnam Alternative Data Market Estimates and Forecasts, By Type (2020-2032) (USD Million)
10.4.11 Singapore
10.4.11.1 Singapore Alternative Data Market Estimates and Forecasts, By Industry (2020-2032) (USD Million)
10.4.11.2 Singapore Alternative Data Market Estimates and Forecasts, By End Use (2020-2032) (USD Million)
10.4.11.3 Singapore Alternative Data Market Estimates and Forecasts, By Type (2020-2032) (USD Million)
10.4.12 Australia
10.4.12.1 Australia Alternative Data Market Estimates and Forecasts, By Industry (2020-2032) (USD Million)
10.4.12.2 Australia Alternative Data Market Estimates and Forecasts, By End Use (2020-2032) (USD Million)
10.4.12.3 Australia Alternative Data Market Estimates and Forecasts, By Type (2020-2032) (USD Million)
10.4.13 Rest of Asia Pacific
10.4.13.1 Rest of Asia Pacific Alternative Data Market Estimates and Forecasts, By Industry (2020-2032) (USD Million)
10.4.13.2 Rest of Asia Pacific Alternative Data Market Estimates and Forecasts, By End Use (2020-2032) (USD Million)
10.4.13.3 Rest of Asia Pacific Alternative Data Market Estimates and Forecasts, By Type (2020-2032) (USD Million)
10.5 Middle East and Africa
10.5.1 Middle East
10.5.1.1 Trends Analysis
10.5.1.2 Middle East Alternative Data Market Estimates and Forecasts, by Country (2020-2032) (USD Million)
10.5.1.3 Middle East Alternative Data Market Estimates and Forecasts, By Industry (2020-2032) (USD Million)
10.5.1.4 Middle East Alternative Data Market Estimates and Forecasts, By End Use (2020-2032) (USD Million)
10.5.1.5 Middle East Alternative Data Market Estimates and Forecasts, By Type (2020-2032) (USD Million)
10.5.1.6 UAE
10.5.1.6.1 UAE Alternative Data Market Estimates and Forecasts, By Industry (2020-2032) (USD Million)
10.5.1.6.2 UAE Alternative Data Market Estimates and Forecasts, By End Use (2020-2032) (USD Million)
10.5.1.6.3 UAE Alternative Data Market Estimates and Forecasts, By Type (2020-2032) (USD Million)
10.5.1.7 Egypt
10.5.1.7.1 Egypt Alternative Data Market Estimates and Forecasts, By Industry (2020-2032) (USD Million)
10.5.1.7.2 Egypt Alternative Data Market Estimates and Forecasts, By End Use (2020-2032) (USD Million)
10.5.1.7.3 Egypt Alternative Data Market Estimates and Forecasts, By Type (2020-2032) (USD Million)
10.5.1.8 Saudi Arabia
10.5.1.8.1 Saudi Arabia Alternative Data Market Estimates and Forecasts, By Industry (2020-2032) (USD Million)
10.5.1.8.2 Saudi Arabia Alternative Data Market Estimates and Forecasts, By End Use (2020-2032) (USD Million)
10.5.1.8.3 Saudi Arabia Alternative Data Market Estimates and Forecasts, By Type (2020-2032) (USD Million)
10.5.1.9 Qatar
10.5.1.9.1 Qatar Alternative Data Market Estimates and Forecasts, By Industry (2020-2032) (USD Million)
10.5.1.9.2 Qatar Alternative Data Market Estimates and Forecasts, By End Use (2020-2032) (USD Million)
10.5.1.9.3 Qatar Alternative Data Market Estimates and Forecasts, By Type (2020-2032) (USD Million)
10.5.1.10 Rest of Middle East
10.5.1.10.1 Rest of Middle East Alternative Data Market Estimates and Forecasts, By Industry (2020-2032) (USD Million)
10.5.1.10.2 Rest of Middle East Alternative Data Market Estimates and Forecasts, By End Use (2020-2032) (USD Million)
10.5.1.10.3 Rest of Middle East Alternative Data Market Estimates and Forecasts, By Type (2020-2032) (USD Million)
10.5.2 Africa
10.5.2.1 Trends Analysis
10.5.2.2 Africa Alternative Data Market Estimates and Forecasts, by Country (2020-2032) (USD Million)
10.5.2.3 Africa Alternative Data Market Estimates and Forecasts, By Industry (2020-2032) (USD Million)
10.5.2.4 Africa Alternative Data Market Estimates and Forecasts, By End Use (2020-2032) (USD Million)
10.5.2.5 Africa Alternative Data Market Estimates and Forecasts, By Type (2020-2032) (USD Million)
10.5.2.6 South Africa
10.5.2.6.1 South Africa Alternative Data Market Estimates and Forecasts, By Industry (2020-2032) (USD Million)
10.5.2.6.2 South Africa Alternative Data Market Estimates and Forecasts, By End Use (2020-2032) (USD Million)
10.5.2.6.3 South Africa Alternative Data Market Estimates and Forecasts, By Type (2020-2032) (USD Million)
10.5.2.7 Nigeria
10.5.2.7.1 Nigeria Alternative Data Market Estimates and Forecasts, By Industry (2020-2032) (USD Million)
10.5.2.7.2 Nigeria Alternative Data Market Estimates and Forecasts, By End Use (2020-2032) (USD Million)
10.5.2.7.3 Nigeria Alternative Data Market Estimates and Forecasts, By Type (2020-2032) (USD Million)
10.5.2.8 Rest of Africa
10.5.2.8.1 Rest of Africa Alternative Data Market Estimates and Forecasts, By Industry (2020-2032) (USD Million)
10.5.2.8.2 Rest of Africa Alternative Data Market Estimates and Forecasts, By End Use (2020-2032) (USD Million)
10.5.2.8.3 Rest of Africa Alternative Data Market Estimates and Forecasts, By Type (2020-2032) (USD Million)
10.6 Latin America
10.6.1 Trends Analysis
10.6.2 Latin America Alternative Data Market Estimates and Forecasts, by Country (2020-2032) (USD Million)
10.6.3 Latin America Alternative Data Market Estimates and Forecasts, By Industry (2020-2032) (USD Million)
10.6.4 Latin America Alternative Data Market Estimates and Forecasts, By End Use (2020-2032) (USD Million)
10.6.5 Latin America Alternative Data Market Estimates and Forecasts, By Type (2020-2032) (USD Million)
10.6.6 Brazil
10.6.6.1 Brazil Alternative Data Market Estimates and Forecasts, By Industry (2020-2032) (USD Million)
10.6.6.2 Brazil Alternative Data Market Estimates and Forecasts, By End Use (2020-2032) (USD Million)
10.6.6.3 Brazil Alternative Data Market Estimates and Forecasts, By Type (2020-2032) (USD Million)
10.6.7 Argentina
10.6.7.1 Argentina Alternative Data Market Estimates and Forecasts, By Industry (2020-2032) (USD Million)
10.6.7.2 Argentina Alternative Data Market Estimates and Forecasts, By End Use (2020-2032) (USD Million)
10.6.7.3 Argentina Alternative Data Market Estimates and Forecasts, By Type (2020-2032) (USD Million)
10.6.8 Colombia
10.6.8.1 Colombia Alternative Data Market Estimates and Forecasts, By Industry (2020-2032) (USD Million)
10.6.8.2 Colombia Alternative Data Market Estimates and Forecasts, By End Use (2020-2032) (USD Million)
10.6.8.3 Colombia Alternative Data Market Estimates and Forecasts, By Type (2020-2032) (USD Million)
10.6.9 Rest of Latin America
10.6.9.1 Rest of Latin America Alternative Data Market Estimates and Forecasts, By Industry (2020-2032) (USD Million)
10.6.9.2 Rest of Latin America Alternative Data Market Estimates and Forecasts, By End Use (2020-2032) (USD Million)
10.6.9.3 Rest of Latin America Alternative Data Market Estimates and Forecasts, By Type (2020-2032) (USD Million)
11. Company Profiles
11.1 1010Data
11.1.1 Company Overview
11.1.2 Financial
11.1.3 Products/ Services Offered
11.1.4 SWOT Analysis
11.2 Advan
11.2.1 Company Overview
11.2.2 Financial
11.2.3 Products/ Services Offered
11.2.4 SWOT Analysis
11.3 Dataminr
11.3.1 Company Overview
11.3.2 Financial
11.3.3 Products/ Services Offered
11.3.4 SWOT Analysis
11.4 Earnest Analytics
11.4.1 Company Overview
11.4.2 Financial
11.4.3 Products/ Services Offered
11.4.4 SWOT Analysis
11.5 M Science
11.5.1 Company Overview
11.5.2 Financial
11.5.3 Products/ Services Offered
11.5.4 SWOT Analysis
11.6 Preqin
11.6.1 Company Overview
11.6.2 Financial
11.6.3 Products/ Services Offered
11.6.4 SWOT Analysis
11.7 RavenPack
11.7.1 Company Overview
11.7.2 Financial
11.7.3 Products/ Services Offered
11.7.4 SWOT Analysis
11.8 UBS Evidence Lab
11.8.1 Company Overview
11.8.2 Financial
11.8.3 Products/ Services Offered
11.8.4 SWOT Analysis
11.9 YipitData
11.9.1 Company Overview
11.9.2 Financial
11.9.3 Products/ Services Offered
11.9.4 SWOT Analysis
11.10 Convergence Inc.
11.10.1 Company Overview
11.10.2 Financial
11.10.3 Products/ Services Offered
11.10.4 SWOT Analysis
12. Use Cases and Best Practices
13. Conclusion
An accurate research report requires proper strategizing as well as implementation. There are multiple factors involved in the completion of good and accurate research report and selecting the best methodology to compete the research is the toughest part. Since the research reports we provide play a crucial role in any company’s decision-making process, therefore we at SNS Insider always believe that we should choose the best method which gives us results closer to reality. This allows us to reach at a stage wherein we can provide our clients best and accurate investment to output ratio.
Each report that we prepare takes a timeframe of 350-400 business hours for production. Starting from the selection of titles through a couple of in-depth brain storming session to the final QC process before uploading our titles on our website we dedicate around 350 working hours. The titles are selected based on their current market cap and the foreseen CAGR and growth.
The 5 steps process:
Step 1: Secondary Research:
Secondary Research or Desk Research is as the name suggests is a research process wherein, we collect data through the readily available information. In this process we use various paid and unpaid databases which our team has access to and gather data through the same. This includes examining of listed companies’ annual reports, Journals, SEC filling etc. Apart from this our team has access to various associations across the globe across different industries. Lastly, we have exchange relationships with various university as well as individual libraries.
Step 2: Primary Research
When we talk about primary research, it is a type of study in which the researchers collect relevant data samples directly, rather than relying on previously collected data. This type of research is focused on gaining content specific facts that can be sued to solve specific problems. Since the collected data is fresh and first hand therefore it makes the study more accurate and genuine.
We at SNS Insider have divided Primary Research into 2 parts.
Part 1 wherein we interview the KOLs of major players as well as the upcoming ones across various geographic regions. This allows us to have their view over the market scenario and acts as an important tool to come closer to the accurate market numbers. As many as 45 paid and unpaid primary interviews are taken from both the demand and supply side of the industry to make sure we land at an accurate judgement and analysis of the market.
This step involves the triangulation of data wherein our team analyses the interview transcripts, online survey responses and observation of on filed participants. The below mentioned chart should give a better understanding of the part 1 of the primary interview.
Part 2: In this part of primary research the data collected via secondary research and the part 1 of the primary research is validated with the interviews from individual consultants and subject matter experts.
Consultants are those set of people who have at least 12 years of experience and expertise within the industry whereas Subject Matter Experts are those with at least 15 years of experience behind their back within the same space. The data with the help of two main processes i.e., FGDs (Focused Group Discussions) and IDs (Individual Discussions). This gives us a 3rd party nonbiased primary view of the market scenario making it a more dependable one while collation of the data pointers.
Step 3: Data Bank Validation
Once all the information is collected via primary and secondary sources, we run that information for data validation. At our intelligence centre our research heads track a lot of information related to the market which includes the quarterly reports, the daily stock prices, and other relevant information. Our data bank server gets updated every fortnight and that is how the information which we collected using our primary and secondary information is revalidated in real time.
Step 4: QA/QC Process
After all the data collection and validation our team does a final level of quality check and quality assurance to get rid of any unwanted or undesired mistakes. This might include but not limited to getting rid of the any typos, duplication of numbers or missing of any important information. The people involved in this process include technical content writers, research heads and graphics people. Once this process is completed the title gets uploader on our platform for our clients to read it.
Step 5: Final QC/QA Process:
This is the last process and comes when the client has ordered the study. In this process a final QA/QC is done before the study is emailed to the client. Since we believe in giving our clients a good experience of our research studies, therefore, to make sure that we do not lack at our end in any way humanly possible we do a final round of quality check and then dispatch the study to the client.
MARKET SEGMENTATION
Credit & Debit Card Transactions
Email Receipts
Geo-location (Foot Traffic) Records
Mobile Application Usage
Satellite & Weather Data
Social & Sentiment Data
Web Scraped Data
Web Traffic
Other Data Types
By Industry
Automotive
BFSI
Energy
Industrial
IT & Telecommunications
Media & Entertainment
Real Estate & Construction
Retail
Transportation & Logistics
Other Industries
By End Use
Hedge Fund Operators
Investment Institutions
Retail Companies
Other End Use
Request for Segment Customization as per your Business Requirement: Segment Customization Request
REGIONAL COVERAGE:
North America
US
Canada
Mexico
Europe
Eastern Europe
Poland
Romania
Hungary
Turkey
Rest of Eastern Europe
Western Europe
Germany
France
UK
Italy
Spain
Netherlands
Switzerland
Austria
Rest of Western Europe
Asia Pacific
China
India
Japan
South Korea
Vietnam
Singapore
Australia
Rest of Asia Pacific
Middle East & Africa
Middle East
UAE
Egypt
Saudi Arabia
Qatar
Rest of the Middle East
Africa
Nigeria
South Africa
Rest of Africa
Latin America
Brazil
Argentina
Colombia
Rest Of Latin America
Request for Country Level Research Report: Country Level Customization Request
Available Customization
With the given market data, SNS Insider offers customization as per the company’s specific needs. The following customization options are available for the report:
Product Analysis
Criss-Cross segment analysis (e.g. Product X Application)
Product Matrix which gives a detailed comparison of product portfolio of each company
Geographic Analysis
Additional countries in any of the regions
Company Information
Detailed analysis and profiling of additional market players (Up to five)
The Enterprise Collaboration Market size was valued at USD 54.54 Billion in 2023 and is estimated to reach over USD 154.96 Billion in 2032 with an increasing CAGR of 12.30% From 2024-2032.
The Super App Market size was recorded at USD 75.5 Bn in 2023 and is expected to reach USD 706.2 Bn by 2032, growing at a CAGR of 28.2 % over the forecast period 2024-2032.
The Digital Workplace Market size was valued at USD 30.3 Billion in 2023 and is expected to grow to USD 200.61 Billion By 2032 and grow at a CAGR of 23.39% over the forecast period of 2024-2032.
The Talent Management Software Market size was recorded at USD 9.17 billion in 2023 and is expected to reach USD 25.42 billion by 2032, growing at a CAGR of 12.0 % over the forecast period of 2024-2032.
The AI Video Generator Market size was valued at USD 544.65 Million in 2023. It is expected to grow to USD 2706.60 Million by 2032 and grow at a CAGR of 19.55% over the forecast period of 2024-2032.
The Digital Identity Solutions Market was valued at USD 32.4 Billion in 2023 and will reach USD 142.6 Billion by 2032, growing at a CAGR of 17.90% by 2032.
Hi! Click one of our member below to chat on Phone