All-Flash Array Market Size & Growth Analysis:
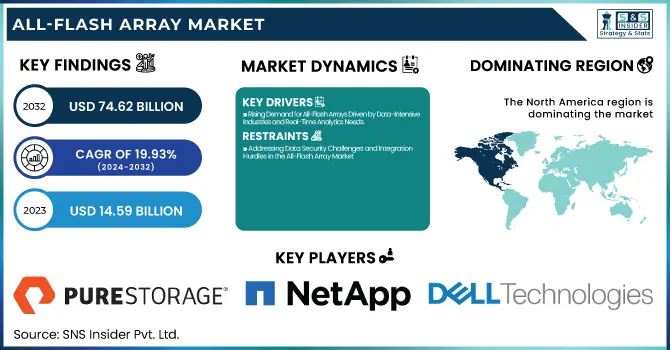
The All-Flash Array Market Size was valued at USD 14.59 billion in 2023 and is expected to reach USD 74.62 billion by 2032, growing at a CAGR of 19.93% over the forecast period 2024-2032. Enterprises searching for better performance in data access, particularly quicker access, Reliability, and deployment processes are rapidly adopting the All-Flash Array (AFA) market. NAND flash technology advancements improved performance and provided lower latency and higher input/output operations per second (IOPS). Today, based on scalable infrastructure with a very large amount of storage capacity, AFAs can help to meet growing data requirements. Besides, energy-efficient architecture and innovative data reduction methods also lead to greater sustainability by minimizing power consumption and cooling expenses. In an industry with a growing demand for speed, scalability, and green solutions, AFAs are reshaping data storage in various industries.
To Get more information on All-Flash Array Market - Request Free Sample Report
The U.S. All-Flash Array market, valued at USD 4.18 billion in 2023, is expanding at a 19.6% CAGR. The growth can be attributed to the growing demand for high-performance storage systems in data-intensive industries such as BFSI, healthcare, and IT, coupled with a rise in the adoption of AI, big data, and cloud computing solutions.
All-Flash Array Market Dynamics
Key Drivers:
-
Rising Demand for All-Flash Arrays Driven by Data-Intensive Industries and Real-Time Analytics Needs
Increasing demand for high-performance storage solutions across data-intensive industries is fueling the growth of the All-Flash Array (AFA) market. The increasing number of organizations adopting cloud computing, big data analytics, and artificial intelligence (AI) has increased the demand for rapid and low-latency access to data making AFAs one of the core solutions for enterprises. Furthermore, the increasing transition of HDD-based storage to flash-based ones is propelling the market growth. Companies such as BFSI, healthcare, telecommunications, etc. are heavily investing in AFAs to increase data processing speed, and data security, and improve IT infrastructure efficiency. Further, the volume of unstructured data is always on the rise, and demand for real-time analytics is driving enterprises to adopt AFAs for improved scalability and performance.
Restrain:
-
Addressing Data Security Challenges and Integration Hurdles in the All-Flash Array Market
Data security and privacy is one of the big issues in front of the All-Flash Array (AFA) market. This widespread shift to AFAs makes the enterprise more susceptible to cyber intrusions, data breaches, and ransomware. Having solid data protection, encryption, and disaster recovery mechanisms is important, particularly for sectors that deal with sensitive information such as BFSI and healthcare. Moreover, AFAs can also struggle to integrate with legacy IT infrastructure, often requiring upgrades to take on several components and the time and skill it takes to guarantee the integration process goes smoothly. The requirement for this level of integration generally puts up an adoption hurdle, especially if an organization lacks the technical resources.
Opportunity:
-
Emerging Technologies and Digital Transformation Driving Growth Opportunities in the All-Flash Array Market
Emerging technologies like NVMe (Non-Volatile Memory Express), which dramatically increase data transfer speeds and help to manage workloads faster, represent more opportunities in the AFA market. With the enhancement of customized storage options tailored to particular trade calls (e.g., Custom Flash Modules (CFM) for AI workloads, and financial analytics), there may be further room for progress right here as effectively, as Hwang provides. Furthermore, the increasing investments in digital transformation by developing economies in the Asia Pacific and Latin America region are creating a wide range of growth opportunities. As the data center is continuously transformed with energy-efficient solutions, the vendor is likely to leverage innovations that increase performance and minimize the total cost of ownership.
Challenges:
-
Overcoming Durability Challenges and Skill Gaps for Successful All-Flash Array Implementation
AFAs support a large number of write/erase cycles that can cause deterioration of the storage cell and can lead to long-term performance and reliability issues. Organizations that deal with high-frequency, IoT-type data transactions could struggle to achieve storage efficiency over time, due to a lack of wear-leveling and data management techniques. Having no proper skillful IT professionals who can deploy and maintain flash problems is also one of the major roadblocks that hamper businesses from implementing AFA solutions. To overcome this challenge and ensure the adoption of this solution among industries, the vendors need to emphasize increasing product durability, managing the data tools, and providing thorough training programs to users.
All-Flash Array Market Segments Overview
By Storage
Block storage continued to lead the AFA sector in 2023 representing 46.4% of the total market. This domination occurred due to its strong performance and low wait times, as well as its optimized design for structured data, which made it the go-to option for usability in critical enterprise applications such as databases and ERP systems, as well as virtualization. The widespread adoption of block storage by different industries such as BFSI, healthcare, and telecommunications is primarily due to the ability to manage high-performance workloads with minimal downtime.
File storage is expected to register the highest CAGR from 2024-2032. The increasing need for content collaboration platforms, unstructured data, and media-rich applications is driving this growth. Demand is also being supported by increasing adoption in media & entertainment, research institutions, and cloud storage service sectors. The scalability and ease of data sharing offered with file storage make this storage type attractive to enterprises that are looking for a flexible and cost-effective storage solution.
By Flash Media
Solid State Drives dominated the AFA market in 2023 with a 73.9% share. This domination stemmed from the established role, cost-effectiveness, and proliferation of SSD in enterprise storage systems and data centers. Most SDDs are SSDs for the advantage of processing large data at high speed and are more reliable than traditional drives, in addition to being easier to integrate into existing IT infrastructure. BFSI, healthcare, and retail industries require SSDs to store transactional data efficiently, as this data resides in large volumes that a standard HDD couldn't support.
Custom Flash Modules are expected to witness the fastest CAGR from 2024 to 2032. CFMs are increasing in popularity because they deliver high-performance, customized storage solutions designed for specific workloads like AI/ML, real-time analytics, and financial modeling. Because of improved stamina, elasticity, and efficiency when dealing with complex data sets, CFMs have once again become a storage solution that companies seek out when creating a complex high-performance computing environment.
By Industry
The BFSI (Banking, Financial Services, and Insurance) Sector contributed to 29.8% of the total market share of the All-Flash Array Market. The sector's growing dependence on swift, secure, and high-performance data storage technologies for critical financial transactions, client records, and real-time analytics drove this domination. AFAs help deliver low-latency access to data, improve fraud detection systems, and create digital banking platforms. The BFSI sector is aiming to augment customer experience by utilizing data-driven insights, which have further accelerated the use of AFA.
The retail industry may have the highest CAGR from 2024-2032. The increase in usage of e-commerce platforms, customer analysis, and personalized marketing techniques has increased the need for streamlined and scalable storage solutions. AFAs are becoming vital for retailers to manage inventory data, track customer behavior, and facilitate online transactions as they are using AFAs to improve operational efficiency and customer engagement.
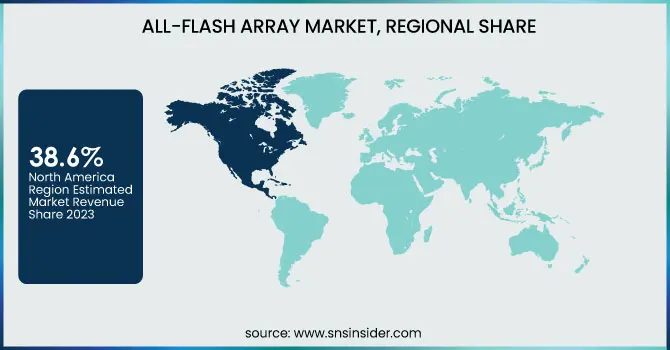
All-Flash Array Market Regional Landscape
North America dominated the AFA market in 2023, representing 38.6% of total market share. This is mainly due to the high concentration of data centers, cloud services providers, and large tech companies based in the region. AFAs are being adopted by enterprises in sectors such as BFSI, healthcare, and IT to provide superior data processing capabilities for uninterrupted business operations. This type of organization such as Amazon Web Services (AWS) and Microsoft Azure depends on AFA-based high-performance storage solutions to drive cloud workload, data analytics, and enterprise applications. US financial institutions are also using AFAs to store transaction data privately and securely.
Asia Pacific is expected to register the highest CAGR between 2024-2032. The likes of China, India, and Japan are undergoing rapid investments in smart Cities, rapid deployment of 5G, and digital services-driven data generation. For example, in China, Alibaba Cloud has taken advanced AFA solutions to control the continuous increase of e-commerce and data in the cloud platform. India is also seeing a rise in the adoption of AFAs, as the nation’s booming fintech sector rapidly adopts AFAs to maintain rapid negotiation and improved customer experience, with this providing a major boost to growth within the region.
Get Customized Report as per Your Business Requirement - Enquiry Now
Key Players
Some of the major players in the All-Flash Array Market are:
-
IBM (FlashSystem)
-
Pure Storage (FlashArray)
-
NetApp (AFF A-Series)
-
HPE (Nimble Storage)
-
Dell Technologies (Unity XT)
-
Huawei (OceanStor Dorado)
-
Hitachi Vantara (VSP F1500)
-
Western Digital (IntelliFlash)
-
Cisco (SmartStack)
-
iXsystems (TrueNAS)
-
Tintri (VMstore)
-
StarWind (Storage Appliance)
-
Supermicro (SuperStorage)
-
DDN (IntelliFlash)
-
Oracle (FS1 Flash Storage)
Recent Trends
-
In April 2024, IBM unveiled the FlashSystem 5300, an entry-level all-flash storage platform designed to deliver enhanced performance, scalability, and cyber resilience for SMEs.
| Report Attributes | Details |
|---|---|
| Market Size in 2023 | USD 14.59 Billion |
| Market Size by 2032 | USD 74.62 Billion |
| CAGR | CAGR of 19.93% From 2024 to 2032 |
| Base Year | 2023 |
| Forecast Period | 2024-2032 |
| Historical Data | 2020-2022 |
| Report Scope & Coverage | Market Size, Segments Analysis, Competitive Landscape, Regional Analysis, DROC & SWOT Analysis, Forecast Outlook |
| Key Segments | • By Storage (File, Object, Block) • By Flash Media (Custom Flash Modules (CFM), Solid-State Drives (SSD)) • By Industry (BFSI, Healthcare, Retail, Telecommunications, Government) |
| Regional Analysis/Coverage | North America (US, Canada, Mexico), Europe (Eastern Europe [Poland, Romania, Hungary, Turkey, Rest of Eastern Europe] Western Europe] Germany, France, UK, Italy, Spain, Netherlands, Switzerland, Austria, Rest of Western Europe]), Asia Pacific (China, India, Japan, South Korea, Vietnam, Singapore, Australia, Rest of Asia Pacific), Middle East & Africa (Middle East [UAE, Egypt, Saudi Arabia, Qatar, Rest of Middle East], Africa [Nigeria, South Africa, Rest of Africa], Latin America (Brazil, Argentina, Colombia, Rest of Latin America) |
| Company Profiles | IBM, Pure Storage, NetApp, HPE, Dell Technologies, Huawei, Hitachi Vantara, Western Digital, Cisco, iXsystems, Tintri, StarWind, Supermicro, DDN, Oracle. |
