AI Sensor Market Report Scope & Overview:
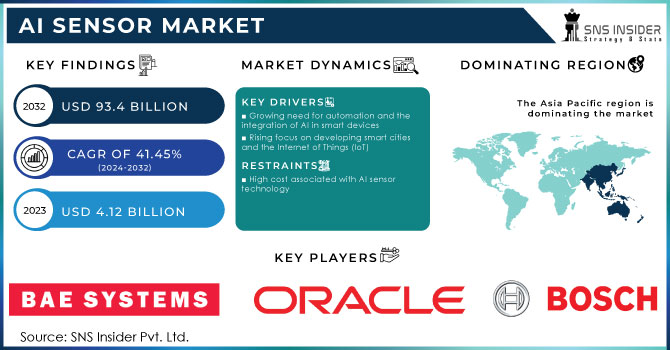
The Artificial Intelligence Sensor Market was valued at USD 3.9 Billion in 2023 and is expected to reach USD 98.7 Billion by 2032, growing at a CAGR of 43.06% from 2024-2032. Major vendors in the AI Sensor Market in 2023 focus on edge AI processing, real-time analytics, and energy efficiency. We did performance benchmarks and it consistently delivered superior accuracy, faster response, and better performance which we can leverage for autonomous vehicles, healthcare, etc. Widespread software integration and enhanced IoT and cloud compatibility fueled adoption in smart homes, robotics, and wearables. The new report also provides competitive analysis, regulatory insights, and trends in AI sensor fusion aimed at better accuracy and performance.
Get more information on AI Sensor Market - Request Free Sample Report
Market Dynamics
Drivers
-
The increasing use of AI-powered sensors in IoT and smart systems enhances automation, real-time data processing, and predictive analytics.
Market growth is majorly attributed to the growing integration of AI-powered sensors in IoT devices and smart systems. They make automation, real-time data processing, and predictive analysis a matter of argument as essential in several applications in smart homes, healthcare monitoring, industrial automation, etc. AI sensors enhance real-time detection and self-learning capabilities that are expected to increase adoption in areas such as consumer electronics, autonomous vehicles, and security systems. AI sensors are in demand with industries looking for automation and efficiency, paving the way for innovation in miniaturized and energy-efficient sensors with enhanced computing power.
Restraints
-
The expensive hardware, software, and infrastructure required for AI sensors limit adoption, especially among small and medium enterprises.
While AI-based sensors bring several advantages, the high-cost development and implementation limits the adoption of these technologies, particularly among small and medium-sized enterprises. It requires a smart chip of AI in sensors along with a big data processing backbone to provide high-end software that makes it costly. This adds to the operational challenge, besides businesses now also need professionals who can operate AI-based sensor systems. Such factors could impede the market growth, particularly in price-sensitive sectors. That said, as AI chip technology develops and cheaper AI models are developed, costs should go down and availability should go up over the next few years.
Opportunities
-
AI-driven sensor fusion improves precision and reliability, creating new opportunities in autonomous vehicles, robotics, and smart surveillance.
The new business growth opportunities may be due to AI sensor fusion: mixing the data from multiple sensors to provide more accurate and less false-positive outcomes. It is useful in areas like autonomous systems, robotics, and smart surveillance which rely on high accuracy. Being groundbreaking in automotive safety, industrial automation, and medical diagnostics, AI sensor fusion is incredibly useful in tackling environmental challenges like noise, interference, and sensor limitations. Advancements in AI algorithms and the availability of ever-higher computational power will provide the groundwork upon which AI-driven sensor fusion will unlock new possibilities, enabling more intelligent and efficient sensor-based technologies.
Challenges
-
AI sensors collect vast amounts of data, raising concerns about cybersecurity risks, unauthorized access, and regulatory compliance.
While different AI sensors detail, gather, and study tons of data from the real world in real time, privacy and security issues continue to pose significant obstacles. In industries such as healthcare, smart cities, and finance, AI-powered sensors process and analyze sensitive data, which cyber attackers can easily exploit to access unauthorized monitoring and surveillance information. These concerns stem from the need for data encryption, regulatory compliance, and secure training of AI models. Additionally, the use of AI for surveillance and monitoring purposes presents ethical concerns, creating hurdles related to regulation. Organizations are deploying strong cybersecurity and compliance mechanisms to avoid such risks but still data privacy remains a concern that is restraining market growth.
Segment Analysis
By Technology
The machine learning segment dominates the market with a revenue share of more than 32% in 2023. With the rise of data in almost every sector, the demand for tools that can provide high-level data analysis and predictive modeling is massive, something that ML is very good at doing. An increasing number of organizations are adopting ML-powered sensors to use data-driven insights to improve decision-making, increase operational efficiency, and provide better customer experience.
The fastest growth is expected over the forecast period from 2024 to 2032 for the context-aware computing technology segment. Context-aware computing uses AI sensors to collect and analyze context – including location, surrounding environment, and modality of the user to give a personalized and adaptive response. Such done feature is most important in smart homes and offices where sensors change the brightness, temperature, and security as per the preference of the occupants, thus providing comfort and saving energy. With the ever-advancing AI and ML algorithms, the performance as well as reliability of context-aware systems have also improved significantly, establishing them as a significant part of various applications.
By Sensor type
In 2023, the optical sensors segment dominated the market and accounted for a significant revenue share, owing to its high capability of measuring and evaluating light-readable data in a precise manner. Optical sensors consist of several technologies such as LiDAR, photodetector, and image sensor, and they play a vital role in all applications that need to measure light levels and optical information accurately.
The ultrasonic segment is expected to witness the fastest CAGR over the forecast period. Ultrasound sensors work on the principle of sound waves; they emit high-frequency sound pulses and measure the time the reflected waves return after hitting an object. The distance data are accurate, reliable, and therefore important for applications with high demands on spatial awareness. Ultrasonic Sensor Market Scope: The increasing applications of ultrasonic sensors across sectors, including automotive safety systems, robotics, industrial automation, and smart home devices, continue to fuel the high demand for these sensors.
By Application
In 2023, the smart home automation segment dominated the market and accounted for the highest share. Smart home systems use AI sensors for two central functionalities, the former being monitoring and the latter being any kind of automation. Smart homes are equipped with sensors like motion detectors, temperature sensors, smart cameras, etc., allowing these homes to adjust according to the resident's needs at that moment. Motion sensors, for example, help automate lights and thermostat controls to be turned on when there are occupants in a room, and temperature sensors to help ensure heating and cooling systems work more efficiently and effectively, which can save significant energy.
The robotics segment is projected to register the fastest CAGR from 2024 to 2032. AI-powered smart cameras can further improve home security by alerting suspicious activities in real time. AI's integration is providing more advanced automation and personalization with home automation, thus enhancing the overall experience.
Regional Landscape
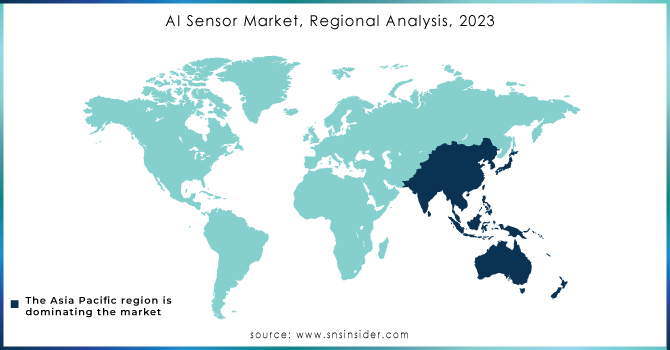
North America dominated the market and accounted for 39% of revenue share in 2023. The growth of the AI sensor market in North America can be attributed to technological advancements, a rise in industry adoption and a favorable regulatory environment. Furthermore, the increasing prevalence of autonomous vehicles and ADAS is a primary motivator for the growth of Lidar, radar and camera sensors in the region. AI sensors, for example, are utilized for patient monitoring, wearable devices, and medical imaging, improving diagnostics and treatment.
Asia Pacific is anticipated to be the fastest-growing region for the AI sensor market over the forecasted timeframe. The regional market is driven by quick technological developments and huge investments in AI, and IoT technologies. A wide range of Asia Pacific states such as China, Japan, and South Korea, are investing heavily in AI research and development, buoyed by large injections of state grants and the private sector.
Need any customization research on AI Sensor Market - Enquiry Now
Key Players
The major key players along with their products are
-
Robert Bosch GmbH– Bosch MEMS Sensors
-
Teledyne Technologies Incorporated – Teledyne FLIR Thermal Cameras
-
Sensirion AG – SCD4x CO₂ Sensor
-
Sensata Technologies, Inc.– Sensata Pressure Sensors
-
Goertek Inc. – Goertek MEMS Microphones
-
STMicroelectronics – LSM6DSOX iNEMO Inertial Module
-
Texas Instruments – LMT70 Temperature Sensor
-
Honeywell International Inc. – HPMA115S0 Particle Sensor
-
Analog Devices – ADXL345 Accelerometer
-
Infineon Technologies – XENSIV™ MEMS Microphones
-
NXP Semiconductors – FXOS8700CQ Accelerometer and Magnetometer
-
TE Connectivity – HTU21D Humidity and Temperature Sensor
-
Omron Corporation – D6T MEMS Thermal Sensors
-
Panasonic Corporation – Grid-EYE Infrared Array Sensor
-
Sony Corporation – IMX500 Intelligent Vision Sensor
Recent Developments
-
In November 2024, China's Hesai Group announced plans to halve the price of its key lidar product in 2025, aiming to increase the adoption of this technology in electric vehicles.
-
In October 2024, Samsara expanded its offerings by introducing "asset tags" for non-vehicle assets, enhancing its market presence beyond vehicle fleet management.
-
In July 2024, Edison Partners invested USD15 million in Seismos, an AI-driven acoustic technology firm specializing in using sound sensors and software to analyze long-distance acoustic reflections in oil-and-gas wells.
| Report Attributes | Details |
|---|---|
| Market Size in 2023 | USD 3.9 Billion |
| Market Size by 2032 | USD 98.7 Billion |
| CAGR | CAGR of 43.06% From 2024 to 2032 |
| Base Year | 2023 |
| Forecast Period | 2024-2032 |
| Historical Data | 2020-2022 |
| Report Scope & Coverage | Market Size, Segments Analysis, Competitive Landscape, Regional Analysis, DROC & SWOT Analysis, Forecast Outlook |
| Key Segments | • By Technology (NLP, Machine Learning, Computer Vision, Context-aware Computing) • By Application (Automotive, Consumer Electronic, Manufacturing, Aerospace & Defense, Robotics, Smart home automation, Aerospace & Defense, Others) • By Sensor Type (Pressure, Temperature, Optical, Position, Ultrasonic, Motion, Navigation, Others) |
| Regional Analysis/Coverage | North America (US, Canada, Mexico), Europe (Eastern Europe [Poland, Romania, Hungary, Turkey, Rest of Eastern Europe] Western Europe] Germany, France, UK, Italy, Spain, Netherlands, Switzerland, Austria, Rest of Western Europe]), Asia Pacific (China, India, Japan, South Korea, Vietnam, Singapore, Australia, Rest of Asia Pacific), Middle East & Africa (Middle East [UAE, Egypt, Saudi Arabia, Qatar, Rest of Middle East], Africa [Nigeria, South Africa, Rest of Africa], Latin America (Brazil, Argentina, Colombia, Rest of Latin America) |
| Company Profiles | Robert Bosch GmbH, Teledyne Technologies Incorporated, Sensirion AG, Sensata Technologies Inc., Goertek Inc., STMicroelectronics, Texas Instruments, Honeywell International Inc., Analog Devices, Infineon Technologies, NXP Semiconductors, TE Connectivity, Omron Corporation, Panasonic Corporation, Sony Corporation |
