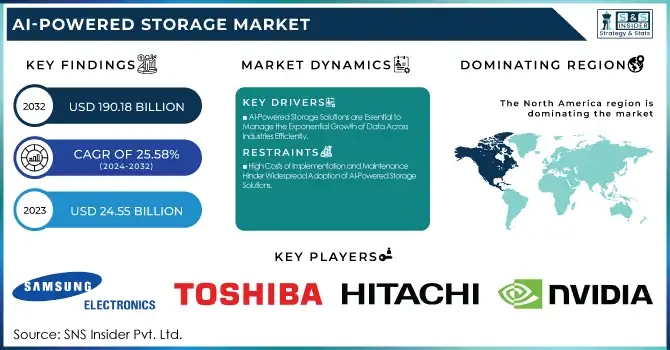
The AI-Powered Storage Market Size was valued at USD 24.55 billion in 2023 and is expected to reach USD 190.18 billion by 2032, growing at a CAGR of 25.58% from 2024-2032. This report provides a detailed examination of the market's demographics, adoption rate, technology trends, and investment trends. It emphasizes the increasing demand for data-driven solutions, the use of AI technologies for optimal storage management, and the rising investments in AI infrastructure. The market is propelled by the demand for scalable, efficient, and smart storage systems to deal with the exponential growth of data in different industries, such as healthcare, finance, and IT.
Get more information on AI-Powered Storage Market - Request Sample Report
Drivers
AI-Powered Storage Solutions are Essential to Manage the Exponential Growth of Data Across Industries Efficiently
The exponential growth of data production in different industries is pushing the demand for better and more efficient storage systems. With companies producing enormous amounts of data from IoT devices, social media, and other sources, conventional storage solutions are unable to handle, process, and protect it efficiently. AI-based storage systems solve these issues by providing automated data management, space optimization, and improved performance. These technologies can scale rapidly to meet increasing data demands and minimize manual intervention, enhance efficiency, and save costs. With data emerging as a key asset for decision-making, sectors need storage systems that not only keep pace with expansion but also support quicker access and enhanced security, making AI-based storage technologies vital for the future.
Restraints
High Costs of Implementation and Maintenance Hinder Widespread Adoption of AI-Powered Storage Solutions
The adoption of AI-driven storage systems has major cost hurdles. Creating and integrating such sophisticated systems involves high hardware and software infrastructure investment, which may prove costly for low-budget organizations. Additionally, AI-based algorithms utilized in storage management are sophisticated and need continuous training and optimization, which necessitates expert skills. This results in high maintenance and operational expenses in the long run. Smaller organizations, especially, might not be able to afford the initial cost and ongoing updates and monitoring. For this reason, most organizations are slow to embrace AI-enabled storage systems, despite the benefits, for fear of the cost of deployment and ongoing maintenance.
Opportunities
Advancements in AI and Machine Learning Drive the Development of Smarter, More Efficient Storage Solutions
Continuous advancements in machine learning algorithms and AI are opening doors to new opportunities for more sophisticated, efficient, and cost-effective storage systems. AI-powered storage systems can become increasingly intelligent, adapting to evolving data requirements, streamlining processes, and maximizing performance with these innovations. With organizations seeking scalable, secure, and high-performance storage solutions, incorporating AI provides the means to process large volumes of data while speeding up and making it more secure. In addition, ongoing innovation in AI offers prospects for lowering operating expenses and enhancing user experience. Such technological improvements are not only expanding the applications of AI-driven storage but also increasing its prospects across sectors like healthcare, finance, and retail, fueling market growth.
Challenges
Ensuring Data Privacy and Compliance Remains a Major Challenge for AI-Powered Storage Solutions
AI-driven storage systems manage huge amounts of sensitive information, triggering serious issues of data privacy and regulatory compliance. Ensuring these systems comply with strict data privacy laws, like GDPR, can be difficult and tricky. Organizations handling very sensitive data, like healthcare or finance, are under greater scrutiny when they implement AI-based storage solutions. Protecting this data from breaches or unauthorized access and, at the same time, complying with local and international regulations is paramount. These compliance and privacy issues need constant surveillance, auditing, and revamping of storage infrastructure, increasing complexity in implementing them and their day-to-day management. For companies, remaining compliant with emerging data protection legislation using AI-based storage technologies continues to be a big challenge for them in the marketplace.
By Storage Architecture
The file-based segment held the largest market share of approximately 59% in terms of revenue in 2023, thanks to its extensive use across enterprises. File-based storage finds extensive use owing to its ease of use and compatibility with the current systems. It provides an easy-to-use method of managing data, and hence it finds extensive use across industries such as healthcare, finance, and education, where file management and structured data are highly important. Its established infrastructure and ease of integration into legacy systems make it a preferred choice.
The object-based segment will expand at the fastest CAGR of approximately 27.85% during 2024-2032 because of its scalability and flexibility. With more companies embracing cloud-based solutions, object storage's capacity to manage unstructured data, such as multimedia content and big data, is increasingly valuable. Being cost-effective, highly scalable, and having better data management features, object-based storage is ideal for companies that want to store large volumes of data securely and efficiently.
By Storage Medium
The Hard Disk Drive (HDD) segment led the AI-driven storage space with the largest revenue share of approximately 59% in 2023 owing to its affordability and large storage capacity. HDDs have been the norm for data storage at a large scale for years, providing huge amounts of data at a relatively low cost per gigabyte. They are still widely used for applications that demand lots of storage with no high-speed performance requirements, and thus are well suited to markets like backup and archiving, where affordable storage is key.
The Solid State Drive (SSD) segment will register the highest CAGR of around 27.06% during the forecast period of 2024-2032 based on its faster speed, reliability, and lower energy consumption. With the increasing need for AI and data-intensive applications that need quicker data access, SSDs are gaining importance in high-performance computing environments. As the price is reducing and SSD technology continues to advance, companies are increasingly implementing SSDs for important workloads, thus witnessing huge growth in this segment during the forecast period.
By End-User
Enterprise segment led the AI-based storage market with a largest revenue contribution of around 31% by 2023 because of mounting dependence on AI-based solutions to handle large volumes of business-related data. Organizations in various industry verticals including retail, health, and banking create huge amounts of structured data and unstructured data, the storage of which needs to be efficient and speedier retrieval is needed. Storage solutions based on AI assist in maximizing data management, improving security, and facilitating scalability, thus becoming the first choice for enterprises looking for high-performance and dependable storage systems.
The Government Bodies segment is projected to expand at the fastest CAGR of around 27.85% during 2024-2032 owing to the growing demand for secure and effective data management systems. Governments are implementing AI-based storage solutions to manage large volumes of public sector data, enhance decision-making, and maintain data security. Furthermore, government organizations are more interested in digitization, regulatory compliance, and increased data accessibility, which is promoting the demand for sophisticated storage solutions that cater to these requirements.
By Storage System
The Hard Disk Drive (HDD) segment led the AI-driven storage space with the largest revenue share of approximately 59% in 2023 owing to its affordability and large storage capacity. HDDs have been the norm for data storage at a large scale for years, providing huge amounts of data at a relatively low cost per gigabyte. They are still widely used for applications that demand lots of storage with no high-speed performance requirements, and thus are well suited to markets like backup and archiving, where affordable storage is key.
The Network Attached Storage (NAS) market is anticipated to expand at the fastest CAGR of approximately 23.43% during the period 2024-2032 owing to its scalability, centralized storage support, and network access. As companies continue to focus on sharing data and collaborating, NAS offerings are increasingly used for their potential to offer numerous users access to shared storage over a network. With the advent of cloud computing and remote work, NAS systems present a secure and flexible solution to expanding data storage requirements.
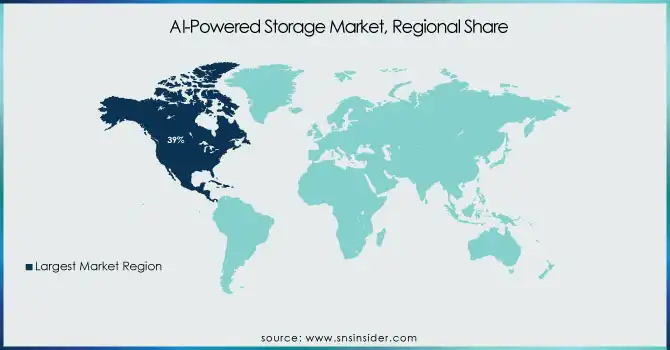
North America dominated the AI-powered storage market with the highest revenue share of about 39% in 2023 due to its advanced technological infrastructure, early adoption of AI technologies, and a strong presence of leading IT and cloud storage companies. The region has a high demand for AI-driven solutions across industries such as healthcare, finance, and retail, where data management and performance optimization are critical. Additionally, significant investments in research and development and the presence of major technology players further fuel the region's dominance.
Asia Pacific is expected to grow at the fastest CAGR of approximately 27.40% during 2024-2032 owing to high-speed digitalization, higher data generation, and growing uptake of AI solutions in nations such as China, India, and Japan. Greater emphasis on smart cities, IoT, and cloud computing in the region is promoting demand for storage solutions powered by AI. Also, the rising number of startups and businesses adopting AI-based systems will further lead to the strong market growth in this region.
Need any customization research on AI-Powered Storage Market - Enquiry Now
Samsung Electronics (Samsung SSDs, Samsung PM1733)
Toshiba (XG6 SSD, MG08 Series HDD)
Hitachi (Virtual Storage Platform, Data Systems)
Lenovo (ThinkSystem DM Series, ThinkSystem Storage)
NVIDIA (DGX A100, BlueField Data Processing Unit)
Dell Inc. (PowerMax, VxRail)
Intel Corporation (Optane SSD, 3D NAND SSD)
NetApp (ONTAP, AFF A400)
IBM Corporation (FlashSystem, Cloud Object Storage)
Micron Technology Inc. (9300 SSD, 5100 Series)
Hewlett Packard Enterprise Development LP (Nimble Storage, 3PAR StoreServ)
Huawei Technologies Co. Ltd. (OceanStor, FusionStorage)
Pure Storage, Inc. (FlashArray, FlashBlade)
Infortrend Technology Inc. (EonStor GS, EonStor RAID Storage)
CISCO Systems Inc. (HyperFlex, UCS)
Microsoft Corporation (Azure Storage, Data Box)
Alphabet (Google Inc.) (Cloud Storage, Persistent Disk)
Advanced Micro Devices (EPYC Processors, Radeon Instinct)
Amazon Web Services (S3, EBS)
At FMS 2024, Samsung introduced cutting-edge memory and storage solutions designed for ultra-high capacity and performance, specifically aimed at supporting AI and data-intensive applications. These innovations are set to revolutionize data handling for AI workloads in 2024
In 2024, Intel outlined its enterprise AI strategy, focusing on maximizing growth and return on investment by integrating AI across platforms like data centers, cloud, and edge devices to accelerate AI adoption.
Report Attributes | Details |
---|---|
Market Size in 2023 | USD 24.55 Billion |
Market Size by 2032 | USD 190.18 Billion |
CAGR | CAGR of 25.58% From 2024 to 2032 |
Base Year | 2023 |
Forecast Period | 2024-2032 |
Historical Data | 2020-2022 |
Report Scope & Coverage | Market Size, Segments Analysis, Competitive Landscape, Regional Analysis, DROC & SWOT Analysis, Forecast Outlook |
Key Segments | • By Storage System (Direct Attached Storage, Network Attached Storage, Storage Area Network) • By Storage Architecture (File Based, Object Based) • By Storage Medium (Hard Disk Drive, Solid State Drive) • By End-User (Enterprise, Telecom Companies, Cloud Service Providers, Government Bodies) |
Regional Analysis/Coverage | North America (US, Canada, Mexico), Europe (Eastern Europe [Poland, Romania, Hungary, Turkey, Rest of Eastern Europe] Western Europe] Germany, France, UK, Italy, Spain, Netherlands, Switzerland, Austria, Rest of Western Europe]), Asia Pacific (China, India, Japan, South Korea, Vietnam, Singapore, Australia, Rest of Asia Pacific), Middle East & Africa (Middle East [UAE, Egypt, Saudi Arabia, Qatar, Rest of Middle East], Africa [Nigeria, South Africa, Rest of Africa], Latin America (Brazil, Argentina, Colombia, Rest of Latin America) |
Company Profiles | Samsung Electronics, Toshiba, Hitachi, Lenovo, NVIDIA, Dell Inc., Intel Corporation, NetApp, IBM Corporation, Micron Technology Inc., Hewlett Packard Enterprise Development LP, Huawei Technologies Co. Ltd., Pure Storage, Inc., Infortrend Technology Inc., Cisco Systems Inc., Microsoft Corporation, Alphabet (Google Inc.), Advanced Micro Devices, Amazon Web Services |
ANS: AI-Powered Storage Market was valued at USD 24.55 billion in 2023 and is expected to reach USD 190.18 billion by 2032, growing at a CAGR of 25.58% from 2024-2032.
ANS: The file-based segment dominated with a 59% revenue share in 2023.
ANS: The Solid State Drive (SSD) segment is expected to grow at a CAGR of 27.06% from 2024 to 2032.
ANS: The Government Bodies segment is expected to grow at a CAGR of 27.85%.
ANS: North America dominated with a 39% revenue share in 2023.
1. Introduction
1.1 Market Definition
1.2 Scope (Inclusion and Exclusions)
1.3 Research Assumptions
2. Executive Summary
2.1 Market Overview
2.2 Regional Synopsis
2.3 Competitive Summary
3. Research Methodology
3.1 Top-Down Approach
3.2 Bottom-up Approach
3.3. Data Validation
3.4 Primary Interviews
4. Market Dynamics Impact Analysis
4.1 Market Driving Factors Analysis
4.1.1 Drivers
4.1.2 Restraints
4.1.3 Opportunities
4.1.4 Challenges
4.2 PESTLE Analysis
4.3 Porter’s Five Forces Model
5. Statistical Insights and Trends Reporting
5.1 User Demographics
5.2 Adoption Rate
5.3 Technology Trends
5.4 Investment Trends
6. Competitive Landscape
6.1 List of Major Companies, By Region
6.2 Market Share Analysis, By Region
6.3 Product Benchmarking
6.3.1 Product specifications and features
6.3.2 Pricing
6.4 Strategic Initiatives
6.4.1 Marketing and promotional activities
6.4.2 Distribution and supply chain strategies
6.4.3 Expansion plans and new product launches
6.4.4 Strategic partnerships and collaborations
6.5 Technological Advancements
6.6 Market Positioning and Branding
7. AI-Powered Storage Market Segmentation, By Storage System
7.1 Chapter Overview
7.2 Direct Attached Storage (DAS)
7.2.1 Direct Attached Storage (DAS) Market Trends Analysis (2020-2032)
7.2.2 Direct Attached Storage (DAS) Market Size Estimates and Forecasts to 2032 (USD Billion)
7.3 Network Attached Storage (NAS)
7.3.1 Network Attached Storage (NAS) Market Trends Analysis (2020-2032)
7.3.2 Network Attached Storage (NAS) Market Size Estimates and Forecasts to 2032 (USD Billion)
7.4 Storage Area Network (SAN)
7.4.1 Storage Area Network (SAN) Market Trends Analysis (2020-2032)
7.4.2 Storage Area Network (SAN) Market Size Estimates and Forecasts to 2032 (USD Billion)
8. AI-Powered Storage Market Segmentation, By Storage Architecture
8.1 Chapter Overview
8.2 File Based
8.2.1 File Based Market Trends Analysis (2020-2032)
8.2.2 File Based Market Size Estimates and Forecasts to 2032 (USD Billion)
8.3 Object Based
8.3.1 Object Based Market Trends Analysis (2020-2032)
8.3.2 Object Based Market Size Estimates and Forecasts to 2032 (USD Billion)
9. AI-Powered Storage Market Segmentation, By Storage Medium
9.1 Chapter Overview
9.2 Hard Disk Drive (HDD)
9.2.1 Hard Disk Drive (HDD) Market Trends Analysis (2020-2032)
9.2.2 Hard Disk Drive (HDD) Market Size Estimates and Forecasts to 2032 (USD Billion)
9.3 Solid State Drive (SSD)
9.3.1 Solid State Drive (SSD) Market Trends Analysis (2020-2032)
9.3.2 Solid State Drive (SSD) Market Size Estimates and Forecasts to 2032 (USD Billion)
10. AI-Powered Storage Market Segmentation, By End-User
10.1 Chapter Overview
10.2 Enterprise
10.2.1 Enterprise Market Trends Analysis (2020-2032)
10.2.2 Enterprise Market Size Estimates and Forecasts to 2032 (USD Billion)
10.3 Telecom Companies
10.3.1 Telecom Companies Market Trends Analysis (2020-2032)
10.3.2 Telecom Companies Market Size Estimates and Forecasts to 2032 (USD Billion)
10.4 Cloud Service Providers (CSPs)
10.4.1 Cloud Service Providers (CSPs) Market Trends Analysis (2020-2032)
10.4.2 Cloud Service Providers (CSPs) Market Size Estimates and Forecasts to 2032 (USD Billion)
10.5 Government Bodies
10.5.1 Government Bodies Market Trends Analysis (2020-2032)
10.5.2 Government Bodies Market Size Estimates and Forecasts to 2032 (USD Billion)
11. Regional Analysis
11.1 Chapter Overview
11.2 North America
11.2.1 Trends Analysis
11.2.2 North America AI-Powered Storage Market Estimates and Forecasts, by Country (2020-2032) (USD Billion)
11.2.3 North America AI-Powered Storage Market Estimates and Forecasts, By Storage System (2020-2032) (USD Billion)
11.2.4 North America AI-Powered Storage Market Estimates and Forecasts, By Storage Architecture (2020-2032) (USD Billion)
11.2.5 North America AI-Powered Storage Market Estimates and Forecasts, By Storage Medium (2020-2032) (USD Billion)
11.2.6 North America AI-Powered Storage Market Estimates and Forecasts, By End-User (2020-2032) (USD Billion)
11.2.7 USA
11.2.7.1 USA AI-Powered Storage Market Estimates and Forecasts, By Storage System (2020-2032) (USD Billion)
11.2.7.2 USA AI-Powered Storage Market Estimates and Forecasts, By Storage Architecture (2020-2032) (USD Billion)
11.2.7.3 USA AI-Powered Storage Market Estimates and Forecasts, By Storage Medium (2020-2032) (USD Billion)
11.2.7.4 USA AI-Powered Storage Market Estimates and Forecasts, By End-User (2020-2032) (USD Billion)
11.2.8 Canada
11.2.8.1 Canada AI-Powered Storage Market Estimates and Forecasts, By Storage System (2020-2032) (USD Billion)
11.2.8.2 Canada AI-Powered Storage Market Estimates and Forecasts, By Storage Architecture (2020-2032) (USD Billion)
11.2.8.3 Canada AI-Powered Storage Market Estimates and Forecasts, By Storage Medium (2020-2032) (USD Billion)
11.2.8.4 Canada AI-Powered Storage Market Estimates and Forecasts, By End-User (2020-2032) (USD Billion)
11.2.9 Mexico
11.2.9.1 Mexico AI-Powered Storage Market Estimates and Forecasts, By Storage System (2020-2032) (USD Billion)
11.2.9.2 Mexico AI-Powered Storage Market Estimates and Forecasts, By Storage Architecture (2020-2032) (USD Billion)
11.2.9.3 Mexico AI-Powered Storage Market Estimates and Forecasts, By Storage Medium (2020-2032) (USD Billion)
11.2.9.4 Mexico AI-Powered Storage Market Estimates and Forecasts, By End-User (2020-2032) (USD Billion)
11.3 Europe
11.3.1 Eastern Europe
11.3.1.1 Trends Analysis
11.3.1.2 Eastern Europe AI-Powered Storage Market Estimates and Forecasts, by Country (2020-2032) (USD Billion)
11.3.1.3 Eastern Europe AI-Powered Storage Market Estimates and Forecasts, By Storage System (2020-2032) (USD Billion)
11.3.1.4 Eastern Europe AI-Powered Storage Market Estimates and Forecasts, By Storage Architecture (2020-2032) (USD Billion)
11.3.1.5 Eastern Europe AI-Powered Storage Market Estimates and Forecasts, By Storage Medium (2020-2032) (USD Billion)
11.3.1.6 Eastern Europe AI-Powered Storage Market Estimates and Forecasts, By End-User (2020-2032) (USD Billion)
11.3.1.7 Poland
11.3.1.7.1 Poland AI-Powered Storage Market Estimates and Forecasts, By Storage System (2020-2032) (USD Billion)
11.3.1.7.2 Poland AI-Powered Storage Market Estimates and Forecasts, By Storage Architecture (2020-2032) (USD Billion)
11.3.1.7.3 Poland AI-Powered Storage Market Estimates and Forecasts, By Storage Medium (2020-2032) (USD Billion)
11.3.1.7.4 Poland AI-Powered Storage Market Estimates and Forecasts, By End-User (2020-2032) (USD Billion)
11.3.1.8 Romania
11.3.1.8.1 Romania AI-Powered Storage Market Estimates and Forecasts, By Storage System (2020-2032) (USD Billion)
11.3.1.8.2 Romania AI-Powered Storage Market Estimates and Forecasts, By Storage Architecture (2020-2032) (USD Billion)
11.3.1.8.3 Romania AI-Powered Storage Market Estimates and Forecasts, By Storage Medium (2020-2032) (USD Billion)
11.3.1.8.4 Romania AI-Powered Storage Market Estimates and Forecasts, By End-User (2020-2032) (USD Billion)
11.3.1.9 Hungary
11.3.1.9.1 Hungary AI-Powered Storage Market Estimates and Forecasts, By Storage System (2020-2032) (USD Billion)
11.3.1.9.2 Hungary AI-Powered Storage Market Estimates and Forecasts, By Storage Architecture (2020-2032) (USD Billion)
11.3.1.9.3 Hungary AI-Powered Storage Market Estimates and Forecasts, By Storage Medium (2020-2032) (USD Billion)
11.3.1.9.4 Hungary AI-Powered Storage Market Estimates and Forecasts, By End-User (2020-2032) (USD Billion)
11.3.1.10 Turkey
11.3.1.10.1 Turkey AI-Powered Storage Market Estimates and Forecasts, By Storage System (2020-2032) (USD Billion)
11.3.1.10.2 Turkey AI-Powered Storage Market Estimates and Forecasts, By Storage Architecture (2020-2032) (USD Billion)
11.3.1.10.3 Turkey AI-Powered Storage Market Estimates and Forecasts, By Storage Medium (2020-2032) (USD Billion)
11.3.1.10.4 Turkey AI-Powered Storage Market Estimates and Forecasts, By End-User (2020-2032) (USD Billion)
11.3.1.11 Rest of Eastern Europe
11.3.1.11.1 Rest of Eastern Europe AI-Powered Storage Market Estimates and Forecasts, By Storage System (2020-2032) (USD Billion)
11.3.1.11.2 Rest of Eastern Europe AI-Powered Storage Market Estimates and Forecasts, By Storage Architecture (2020-2032) (USD Billion)
11.3.1.11.3 Rest of Eastern Europe AI-Powered Storage Market Estimates and Forecasts, By Storage Medium (2020-2032) (USD Billion)
11.3.1.11.4 Rest of Eastern Europe AI-Powered Storage Market Estimates and Forecasts, By End-User (2020-2032) (USD Billion)
11.3.2 Western Europe
11.3.2.1 Trends Analysis
11.3.2.2 Western Europe AI-Powered Storage Market Estimates and Forecasts, by Country (2020-2032) (USD Billion)
11.3.2.3 Western Europe AI-Powered Storage Market Estimates and Forecasts, By Storage System (2020-2032) (USD Billion)
11.3.2.4 Western Europe AI-Powered Storage Market Estimates and Forecasts, By Storage Architecture (2020-2032) (USD Billion)
11.3.2.5 Western Europe AI-Powered Storage Market Estimates and Forecasts, By Storage Medium (2020-2032) (USD Billion)
11.3.2.6 Western Europe AI-Powered Storage Market Estimates and Forecasts, By End-User (2020-2032) (USD Billion)
11.3.2.7 Germany
11.3.2.7.1 Germany AI-Powered Storage Market Estimates and Forecasts, By Storage System (2020-2032) (USD Billion)
11.3.2.7.2 Germany AI-Powered Storage Market Estimates and Forecasts, By Storage Architecture (2020-2032) (USD Billion)
11.3.2.7.3 Germany AI-Powered Storage Market Estimates and Forecasts, By Storage Medium (2020-2032) (USD Billion)
11.3.2.7.4 Germany AI-Powered Storage Market Estimates and Forecasts, By End-User (2020-2032) (USD Billion)
11.3.2.8 France
11.3.2.8.1 France AI-Powered Storage Market Estimates and Forecasts, By Storage System (2020-2032) (USD Billion)
11.3.2.8.2 France AI-Powered Storage Market Estimates and Forecasts, By Storage Architecture (2020-2032) (USD Billion)
11.3.2.8.3 France AI-Powered Storage Market Estimates and Forecasts, By Storage Medium (2020-2032) (USD Billion)
11.3.2.8.4 France AI-Powered Storage Market Estimates and Forecasts, By End-User (2020-2032) (USD Billion)
11.3.2.9 UK
11.3.2.9.1 UK AI-Powered Storage Market Estimates and Forecasts, By Storage System (2020-2032) (USD Billion)
11.3.2.9.2 UK AI-Powered Storage Market Estimates and Forecasts, By Storage Architecture (2020-2032) (USD Billion)
11.3.2.9.3 UK AI-Powered Storage Market Estimates and Forecasts, By Storage Medium (2020-2032) (USD Billion)
11.3.2.9.4 UK AI-Powered Storage Market Estimates and Forecasts, By End-User (2020-2032) (USD Billion)
11.3.2.10 Italy
11.3.2.10.1 Italy AI-Powered Storage Market Estimates and Forecasts, By Storage System (2020-2032) (USD Billion)
11.3.2.10.2 Italy AI-Powered Storage Market Estimates and Forecasts, By Storage Architecture (2020-2032) (USD Billion)
11.3.2.10.3 Italy AI-Powered Storage Market Estimates and Forecasts, By Storage Medium (2020-2032) (USD Billion)
11.3.2.10.4 Italy AI-Powered Storage Market Estimates and Forecasts, By End-User (2020-2032) (USD Billion)
11.3.2.11 Spain
11.3.2.11.1 Spain AI-Powered Storage Market Estimates and Forecasts, By Storage System (2020-2032) (USD Billion)
11.3.2.11.2 Spain AI-Powered Storage Market Estimates and Forecasts, By Storage Architecture (2020-2032) (USD Billion)
11.3.2.11.3 Spain AI-Powered Storage Market Estimates and Forecasts, By Storage Medium (2020-2032) (USD Billion)
11.3.2.11.4 Spain AI-Powered Storage Market Estimates and Forecasts, By End-User (2020-2032) (USD Billion)
11.3.2.12 Netherlands
11.3.2.12.1 Netherlands AI-Powered Storage Market Estimates and Forecasts, By Storage System (2020-2032) (USD Billion)
11.3.2.12.2 Netherlands AI-Powered Storage Market Estimates and Forecasts, By Storage Architecture (2020-2032) (USD Billion)
11.3.2.12.3 Netherlands AI-Powered Storage Market Estimates and Forecasts, By Storage Medium (2020-2032) (USD Billion)
11.3.2.12.4 Netherlands AI-Powered Storage Market Estimates and Forecasts, By End-User (2020-2032) (USD Billion)
11.3.2.13 Switzerland
11.3.2.13.1 Switzerland AI-Powered Storage Market Estimates and Forecasts, By Storage System (2020-2032) (USD Billion)
11.3.2.13.2 Switzerland AI-Powered Storage Market Estimates and Forecasts, By Storage Architecture (2020-2032) (USD Billion)
11.3.2.13.3 Switzerland AI-Powered Storage Market Estimates and Forecasts, By Storage Medium (2020-2032) (USD Billion)
11.3.2.13.4 Switzerland AI-Powered Storage Market Estimates and Forecasts, By End-User (2020-2032) (USD Billion)
11.3.2.14 Austria
11.3.2.14.1 Austria AI-Powered Storage Market Estimates and Forecasts, By Storage System (2020-2032) (USD Billion)
11.3.2.14.2 Austria AI-Powered Storage Market Estimates and Forecasts, By Storage Architecture (2020-2032) (USD Billion)
11.3.2.14.3 Austria AI-Powered Storage Market Estimates and Forecasts, By Storage Medium (2020-2032) (USD Billion)
11.3.2.14.4 Austria AI-Powered Storage Market Estimates and Forecasts, By End-User (2020-2032) (USD Billion)
11.3.2.15 Rest of Western Europe
11.3.2.15.1 Rest of Western Europe AI-Powered Storage Market Estimates and Forecasts, By Storage System (2020-2032) (USD Billion)
11.3.2.15.2 Rest of Western Europe AI-Powered Storage Market Estimates and Forecasts, By Storage Architecture (2020-2032) (USD Billion)
11.3.2.15.3 Rest of Western Europe AI-Powered Storage Market Estimates and Forecasts, By Storage Medium (2020-2032) (USD Billion)
11.3.2.15.4 Rest of Western Europe AI-Powered Storage Market Estimates and Forecasts, By End-User (2020-2032) (USD Billion)
11.4 Asia Pacific
11.4.1 Trends Analysis
11.4.2 Asia Pacific AI-Powered Storage Market Estimates and Forecasts, by Country (2020-2032) (USD Billion)
11.4.3 Asia Pacific AI-Powered Storage Market Estimates and Forecasts, By Storage System (2020-2032) (USD Billion)
11.4.4 Asia Pacific AI-Powered Storage Market Estimates and Forecasts, By Storage Architecture (2020-2032) (USD Billion)
11.4.5 Asia Pacific AI-Powered Storage Market Estimates and Forecasts, By Storage Medium (2020-2032) (USD Billion)
11.4.6 Asia Pacific AI-Powered Storage Market Estimates and Forecasts, By End-User (2020-2032) (USD Billion)
11.4.7 China
11.4.7.1 China AI-Powered Storage Market Estimates and Forecasts, By Storage System (2020-2032) (USD Billion)
11.4.7.2 China AI-Powered Storage Market Estimates and Forecasts, By Storage Architecture (2020-2032) (USD Billion)
11.4.7.3 China AI-Powered Storage Market Estimates and Forecasts, By Storage Medium (2020-2032) (USD Billion)
11.4.7.4 China AI-Powered Storage Market Estimates and Forecasts, By End-User (2020-2032) (USD Billion)
11.4.8 India
11.4.8.1 India AI-Powered Storage Market Estimates and Forecasts, By Storage System (2020-2032) (USD Billion)
11.4.8.2 India AI-Powered Storage Market Estimates and Forecasts, By Storage Architecture (2020-2032) (USD Billion)
11.4.8.3 India AI-Powered Storage Market Estimates and Forecasts, By Storage Medium (2020-2032) (USD Billion)
11.4.8.4 India AI-Powered Storage Market Estimates and Forecasts, By End-User (2020-2032) (USD Billion)
11.4.9 Japan
11.4.9.1 Japan AI-Powered Storage Market Estimates and Forecasts, By Storage System (2020-2032) (USD Billion)
11.4.9.2 Japan AI-Powered Storage Market Estimates and Forecasts, By Storage Architecture (2020-2032) (USD Billion)
11.4.9.3 Japan AI-Powered Storage Market Estimates and Forecasts, By Storage Medium (2020-2032) (USD Billion)
11.4.9.4 Japan AI-Powered Storage Market Estimates and Forecasts, By End-User (2020-2032) (USD Billion)
11.4.10 South Korea
11.4.10.1 South Korea AI-Powered Storage Market Estimates and Forecasts, By Storage System (2020-2032) (USD Billion)
11.4.10.2 South Korea AI-Powered Storage Market Estimates and Forecasts, By Storage Architecture (2020-2032) (USD Billion)
11.4.10.3 South Korea AI-Powered Storage Market Estimates and Forecasts, By Storage Medium (2020-2032) (USD Billion)
11.4.10.4 South Korea AI-Powered Storage Market Estimates and Forecasts, By End-User (2020-2032) (USD Billion)
11.4.11 Vietnam
11.4.11.1 Vietnam AI-Powered Storage Market Estimates and Forecasts, By Storage System (2020-2032) (USD Billion)
11.4.11.2 Vietnam AI-Powered Storage Market Estimates and Forecasts, By Storage Architecture (2020-2032) (USD Billion)
11.4.11.3 Vietnam AI-Powered Storage Market Estimates and Forecasts, By Storage Medium (2020-2032) (USD Billion)
11.4.11.4 Vietnam AI-Powered Storage Market Estimates and Forecasts, By End-User (2020-2032) (USD Billion)
11.4.12 Singapore
11.4.12.1 Singapore AI-Powered Storage Market Estimates and Forecasts, By Storage System (2020-2032) (USD Billion)
11.4.12.2 Singapore AI-Powered Storage Market Estimates and Forecasts, By Storage Architecture (2020-2032) (USD Billion)
11.4.12.3 Singapore AI-Powered Storage Market Estimates and Forecasts, By Storage Medium (2020-2032) (USD Billion)
11.4.12.4 Singapore AI-Powered Storage Market Estimates and Forecasts, By End-User (2020-2032) (USD Billion)
11.4.13 Australia
11.4.13.1 Australia AI-Powered Storage Market Estimates and Forecasts, By Storage System (2020-2032) (USD Billion)
11.4.13.2 Australia AI-Powered Storage Market Estimates and Forecasts, By Storage Architecture (2020-2032) (USD Billion)
11.4.13.3 Australia AI-Powered Storage Market Estimates and Forecasts, By Storage Medium (2020-2032) (USD Billion)
11.4.13.4 Australia AI-Powered Storage Market Estimates and Forecasts, By End-User (2020-2032) (USD Billion)
11.4.14 Rest of Asia Pacific
11.4.14.1 Rest of Asia Pacific AI-Powered Storage Market Estimates and Forecasts, By Storage System (2020-2032) (USD Billion)
11.4.14.2 Rest of Asia Pacific AI-Powered Storage Market Estimates and Forecasts, By Storage Architecture (2020-2032) (USD Billion)
11.4.14.3 Rest of Asia Pacific AI-Powered Storage Market Estimates and Forecasts, By Storage Medium (2020-2032) (USD Billion)
11.4.14.4 Rest of Asia Pacific AI-Powered Storage Market Estimates and Forecasts, By End-User (2020-2032) (USD Billion)
11.5 Middle East and Africa
11.5.1 Middle East
11.5.1.1 Trends Analysis
11.5.1.2 Middle East AI-Powered Storage Market Estimates and Forecasts, by Country (2020-2032) (USD Billion)
11.5.1.3 Middle East AI-Powered Storage Market Estimates and Forecasts, By Storage System (2020-2032) (USD Billion)
11.5.1.4 Middle East AI-Powered Storage Market Estimates and Forecasts, By Storage Architecture (2020-2032) (USD Billion)
11.5.1.5 Middle East AI-Powered Storage Market Estimates and Forecasts, By Storage Medium (2020-2032) (USD Billion)
11.5.1.6 Middle East AI-Powered Storage Market Estimates and Forecasts, By End-User (2020-2032) (USD Billion)
11.5.1.7 UAE
11.5.1.7.1 UAE AI-Powered Storage Market Estimates and Forecasts, By Storage System (2020-2032) (USD Billion)
11.5.1.7.2 UAE AI-Powered Storage Market Estimates and Forecasts, By Storage Architecture (2020-2032) (USD Billion)
11.5.1.7.3 UAE AI-Powered Storage Market Estimates and Forecasts, By Storage Medium (2020-2032) (USD Billion)
11.5.1.7.4 UAE AI-Powered Storage Market Estimates and Forecasts, By End-User (2020-2032) (USD Billion)
11.5.1.8 Egypt
11.5.1.8.1 Egypt AI-Powered Storage Market Estimates and Forecasts, By Storage System (2020-2032) (USD Billion)
11.5.1.8.2 Egypt AI-Powered Storage Market Estimates and Forecasts, By Storage Architecture (2020-2032) (USD Billion)
11.5.1.8.3 Egypt AI-Powered Storage Market Estimates and Forecasts, By Storage Medium (2020-2032) (USD Billion)
11.5.1.8.4 Egypt AI-Powered Storage Market Estimates and Forecasts, By End-User (2020-2032) (USD Billion)
11.5.1.9 Saudi Arabia
11.5.1.9.1 Saudi Arabia AI-Powered Storage Market Estimates and Forecasts, By Storage System (2020-2032) (USD Billion)
11.5.1.9.2 Saudi Arabia AI-Powered Storage Market Estimates and Forecasts, By Storage Architecture (2020-2032) (USD Billion)
11.5.1.9.3 Saudi Arabia AI-Powered Storage Market Estimates and Forecasts, By Storage Medium (2020-2032) (USD Billion)
11.5.1.9.4 Saudi Arabia AI-Powered Storage Market Estimates and Forecasts, By End-User (2020-2032) (USD Billion)
11.5.1.10 Qatar
11.5.1.10.1 Qatar AI-Powered Storage Market Estimates and Forecasts, By Storage System (2020-2032) (USD Billion)
11.5.1.10.2 Qatar AI-Powered Storage Market Estimates and Forecasts, By Storage Architecture (2020-2032) (USD Billion)
11.5.1.10.3 Qatar AI-Powered Storage Market Estimates and Forecasts, By Storage Medium (2020-2032) (USD Billion)
11.5.1.10.4 Qatar AI-Powered Storage Market Estimates and Forecasts, By End-User (2020-2032) (USD Billion)
11.5.1.11 Rest of Middle East
11.5.1.11.1 Rest of Middle East AI-Powered Storage Market Estimates and Forecasts, By Storage System (2020-2032) (USD Billion)
11.5.1.11.2 Rest of Middle East AI-Powered Storage Market Estimates and Forecasts, By Storage Architecture (2020-2032) (USD Billion)
11.5.1.11.3 Rest of Middle East AI-Powered Storage Market Estimates and Forecasts, By Storage Medium (2020-2032) (USD Billion)
11.5.1.11.4 Rest of Middle East AI-Powered Storage Market Estimates and Forecasts, By End-User (2020-2032) (USD Billion)
11.5.2 Africa
11.5.2.1 Trends Analysis
11.5.2.2 Africa AI-Powered Storage Market Estimates and Forecasts, by Country (2020-2032) (USD Billion)
11.5.2.3 Africa AI-Powered Storage Market Estimates and Forecasts, By Storage System (2020-2032) (USD Billion)
11.5.2.4 Africa AI-Powered Storage Market Estimates and Forecasts, By Storage Architecture (2020-2032) (USD Billion)
11.5.2.5 Africa AI-Powered Storage Market Estimates and Forecasts, By Storage Medium (2020-2032) (USD Billion)
11.5.2.6 Africa AI-Powered Storage Market Estimates and Forecasts, By End-User (2020-2032) (USD Billion)
11.5.2.7 South Africa
11.5.2.7.1 South Africa AI-Powered Storage Market Estimates and Forecasts, By Storage System (2020-2032) (USD Billion)
11.5.2.7.2 South Africa AI-Powered Storage Market Estimates and Forecasts, By Storage Architecture (2020-2032) (USD Billion)
11.5.2.7.3 South Africa AI-Powered Storage Market Estimates and Forecasts, By Storage Medium (2020-2032) (USD Billion)
11.5.2.7.4 South Africa AI-Powered Storage Market Estimates and Forecasts, By End-User (2020-2032) (USD Billion)
11.5.2.8 Nigeria
11.5.2.8.1 Nigeria AI-Powered Storage Market Estimates and Forecasts, By Storage System (2020-2032) (USD Billion)
11.5.2.8.2 Nigeria AI-Powered Storage Market Estimates and Forecasts, By Storage Architecture (2020-2032) (USD Billion)
11.5.2.8.3 Nigeria AI-Powered Storage Market Estimates and Forecasts, By Storage Medium (2020-2032) (USD Billion)
11.5.2.8.4 Nigeria AI-Powered Storage Market Estimates and Forecasts, By End-User (2020-2032) (USD Billion)
11.5.2.9 Rest of Africa
11.5.2.9.1 Rest of Africa AI-Powered Storage Market Estimates and Forecasts, By Storage System (2020-2032) (USD Billion)
11.5.2.9.2 Rest of Africa AI-Powered Storage Market Estimates and Forecasts, By Storage Architecture (2020-2032) (USD Billion)
11.5.2.9.3 Rest of Africa AI-Powered Storage Market Estimates and Forecasts, By Storage Medium (2020-2032) (USD Billion)
11.5.2.9.4 Rest of Africa AI-Powered Storage Market Estimates and Forecasts, By End-User (2020-2032) (USD Billion)
11.6 Latin America
11.6.1 Trends Analysis
11.6.2 Latin America AI-Powered Storage Market Estimates and Forecasts, by Country (2020-2032) (USD Billion)
11.6.3 Latin America AI-Powered Storage Market Estimates and Forecasts, By Storage System (2020-2032) (USD Billion)
11.6.4 Latin America AI-Powered Storage Market Estimates and Forecasts, By Storage Architecture (2020-2032) (USD Billion)
11.6.5 Latin America AI-Powered Storage Market Estimates and Forecasts, By Storage Medium (2020-2032) (USD Billion)
11.6.6 Latin America AI-Powered Storage Market Estimates and Forecasts, By End-User (2020-2032) (USD Billion)
11.6.7 Brazil
11.6.7.1 Brazil AI-Powered Storage Market Estimates and Forecasts, By Storage System (2020-2032) (USD Billion)
11.6.7.2 Brazil AI-Powered Storage Market Estimates and Forecasts, By Storage Architecture (2020-2032) (USD Billion)
11.6.7.3 Brazil AI-Powered Storage Market Estimates and Forecasts, By Storage Medium (2020-2032) (USD Billion)
11.6.7.4 Brazil AI-Powered Storage Market Estimates and Forecasts, By End-User (2020-2032) (USD Billion)
11.6.8 Argentina
11.6.8.1 Argentina AI-Powered Storage Market Estimates and Forecasts, By Storage System (2020-2032) (USD Billion)
11.6.8.2 Argentina AI-Powered Storage Market Estimates and Forecasts, By Storage Architecture (2020-2032) (USD Billion)
11.6.8.3 Argentina AI-Powered Storage Market Estimates and Forecasts, By Storage Medium (2020-2032) (USD Billion)
11.6.8.4 Argentina AI-Powered Storage Market Estimates and Forecasts, By End-User (2020-2032) (USD Billion)
11.6.9 Colombia
11.6.9.1 Colombia AI-Powered Storage Market Estimates and Forecasts, By Storage System (2020-2032) (USD Billion)
11.6.9.2 Colombia AI-Powered Storage Market Estimates and Forecasts, By Storage Architecture (2020-2032) (USD Billion)
11.6.9.3 Colombia AI-Powered Storage Market Estimates and Forecasts, By Storage Medium (2020-2032) (USD Billion)
11.6.9.4 Colombia AI-Powered Storage Market Estimates and Forecasts, By End-User (2020-2032) (USD Billion)
11.6.10 Rest of Latin America
11.6.10.1 Rest of Latin America AI-Powered Storage Market Estimates and Forecasts, By Storage System (2020-2032) (USD Billion)
11.6.10.2 Rest of Latin America AI-Powered Storage Market Estimates and Forecasts, By Storage Architecture (2020-2032) (USD Billion)
11.6.10.3 Rest of Latin America AI-Powered Storage Market Estimates and Forecasts, By Storage Medium (2020-2032) (USD Billion)
11.6.10.4 Rest of Latin America AI-Powered Storage Market Estimates and Forecasts, By End-User (2020-2032) (USD Billion)
12. Company Profiles
12.1 Samsung Electronics
12.1.1 Company Overview
12.1.2 Financial
12.1.3 Products/ Services Offered
12.1.4 SWOT Analysis
12.2 Toshiba
12.2.1 Company Overview
12.2.2 Financial
12.2.3 Products/ Services Offered
12.2.4 SWOT Analysis
12.3 Hitachi
12.3.1 Company Overview
12.3.2 Financial
12.3.3 Products/ Services Offered
12.3.4 SWOT Analysis
12.4 Lenovo
12.4.1 Company Overview
12.4.2 Financial
12.4.3 Products/ Services Offered
12.4.4 SWOT Analysis
12.5 NVIDIA
12.5.1 Company Overview
12.5.2 Financial
12.5.3 Products/ Services Offered
12.5.4 SWOT Analysis
12.6 Dell Inc.
12.6.1 Company Overview
12.6.2 Financial
12.6.3 Products/ Services Offered
12.6.4 SWOT Analysis
12.7 Intel Corporation
12.7.1 Company Overview
12.7.2 Financial
12.7.3 Products/ Services Offered
12.7.4 SWOT Analysis
12.8 NetApp
12.8.1 Company Overview
12.8.2 Financial
12.8.3 Products/ Services Offered
12.8.4 SWOT Analysis
12.9 IBM Corporation
12.9.1 Company Overview
12.9.2 Financial
12.9.3 Products/ Services Offered
12.9.4 SWOT Analysis
12.10 Micron Technology Inc.
12.10.1 Company Overview
12.10.2 Financial
12.10.3 Products/ Services Offered
12.10.4 SWOT Analysis
13. Use Cases and Best Practices
14. Conclusion
An accurate research report requires proper strategizing as well as implementation. There are multiple factors involved in the completion of good and accurate research report and selecting the best methodology to compete the research is the toughest part. Since the research reports we provide play a crucial role in any company’s decision-making process, therefore we at SNS Insider always believe that we should choose the best method which gives us results closer to reality. This allows us to reach at a stage wherein we can provide our clients best and accurate investment to output ratio.
Each report that we prepare takes a timeframe of 350-400 business hours for production. Starting from the selection of titles through a couple of in-depth brain storming session to the final QC process before uploading our titles on our website we dedicate around 350 working hours. The titles are selected based on their current market cap and the foreseen CAGR and growth.
The 5 steps process:
Step 1: Secondary Research:
Secondary Research or Desk Research is as the name suggests is a research process wherein, we collect data through the readily available information. In this process we use various paid and unpaid databases which our team has access to and gather data through the same. This includes examining of listed companies’ annual reports, Journals, SEC filling etc. Apart from this our team has access to various associations across the globe across different industries. Lastly, we have exchange relationships with various university as well as individual libraries.
Step 2: Primary Research
When we talk about primary research, it is a type of study in which the researchers collect relevant data samples directly, rather than relying on previously collected data. This type of research is focused on gaining content specific facts that can be sued to solve specific problems. Since the collected data is fresh and first hand therefore it makes the study more accurate and genuine.
We at SNS Insider have divided Primary Research into 2 parts.
Part 1 wherein we interview the KOLs of major players as well as the upcoming ones across various geographic regions. This allows us to have their view over the market scenario and acts as an important tool to come closer to the accurate market numbers. As many as 45 paid and unpaid primary interviews are taken from both the demand and supply side of the industry to make sure we land at an accurate judgement and analysis of the market.
This step involves the triangulation of data wherein our team analyses the interview transcripts, online survey responses and observation of on filed participants. The below mentioned chart should give a better understanding of the part 1 of the primary interview.
Part 2: In this part of primary research the data collected via secondary research and the part 1 of the primary research is validated with the interviews from individual consultants and subject matter experts.
Consultants are those set of people who have at least 12 years of experience and expertise within the industry whereas Subject Matter Experts are those with at least 15 years of experience behind their back within the same space. The data with the help of two main processes i.e., FGDs (Focused Group Discussions) and IDs (Individual Discussions). This gives us a 3rd party nonbiased primary view of the market scenario making it a more dependable one while collation of the data pointers.
Step 3: Data Bank Validation
Once all the information is collected via primary and secondary sources, we run that information for data validation. At our intelligence centre our research heads track a lot of information related to the market which includes the quarterly reports, the daily stock prices, and other relevant information. Our data bank server gets updated every fortnight and that is how the information which we collected using our primary and secondary information is revalidated in real time.
Step 4: QA/QC Process
After all the data collection and validation our team does a final level of quality check and quality assurance to get rid of any unwanted or undesired mistakes. This might include but not limited to getting rid of the any typos, duplication of numbers or missing of any important information. The people involved in this process include technical content writers, research heads and graphics people. Once this process is completed the title gets uploader on our platform for our clients to read it.
Step 5: Final QC/QA Process:
This is the last process and comes when the client has ordered the study. In this process a final QA/QC is done before the study is emailed to the client. Since we believe in giving our clients a good experience of our research studies, therefore, to make sure that we do not lack at our end in any way humanly possible we do a final round of quality check and then dispatch the study to the client.
By Storage System
Direct Attached Storage (DAS)
Network Attached Storage (NAS)
Storage Area Network (SAN)
By Storage Architecture
File Based
Object Based
By Storage Medium
Hard Disk Drive (HDD)
Solid State Drive (SSD)
By End-User
Enterprise
Telecom Companies
Cloud Service Providers (CSPs)
Government Bodies
Request for Segment Customization as per your Business Requirement: Segment Customization Request
Regional Coverage:
North America
US
Canada
Mexico
Europe
Eastern Europe
Poland
Romania
Hungary
Turkey
Rest of Eastern Europe
Western Europe
Germany
France
UK
Italy
Spain
Netherlands
Switzerland
Austria
Rest of Western Europe
Asia Pacific
China
India
Japan
South Korea
Vietnam
Singapore
Australia
Rest of Asia Pacific
Middle East & Africa
Middle East
UAE
Egypt
Saudi Arabia
Qatar
Rest of Middle East
Africa
Nigeria
South Africa
Rest of Africa
Latin America
Brazil
Argentina
Colombia
Rest of Latin America
Request for Country Level Research Report: Country Level Customization Request
Available Customization
With the given market data, SNS Insider offers customization as per the company’s specific needs. The following customization options are available for the report:
Detailed Volume Analysis
Criss-Cross segment analysis (e.g. Product X Application)
Competitive Product Benchmarking
Geographic Analysis
Additional countries in any of the regions
Customized Data Representation
Detailed analysis and profiling of additional market players
The Flexible Battery Market size was valued at USD 195.91 Million in 2023. It is estimated to reach USD 1452.77 Million at a CAGR of 24.95% during 2024-2032
Advanced Metering Infrastructure Market was USD 22.6 Bn in 2023 and is expected to reach USD 59.1 Billion by 2032, growing at a CAGR of 11.28% from 2024-2032.
The Body Area Network Market was valued at USD 13.9 Billion in 2023 and is expected to reach USD 39.2 Billion by 2032, growing at a CAGR of 12.24% from 2024-2032.
The Microcontroller Market Size was valued at USD 29.11 Billion in 2023 and is expected to reach USD 69.33 Billion by 2032 and grow at a CAGR of 10.1% over the forecast period 2024-2032.
The Smart Grid Technology Market Size was valued at USD 45.28 Billion in 2023 and is expected to grow at 18.97% CAGR to reach USD 216.04 Billion by 2032.
The Smart Irrigation Market size was valued at USD 1.59 billion in 2023 and is expected to grow at a CAGR of 13.22% to reach USD 4.86 billion by 2032.
Hi! Click one of our member below to chat on Phone